© 2015 Kim et al. This work is published by Dove Medical Press Limited, and licensed under Creative Commons Attribution – Non Commercial (unported, v3.0)
International Journal of COPD 2015:10 1819–1827
International Journal of COPD
Dove
press
submit your manuscript | www.dovepress.com
Dovepress 1819
O r I g I n a l r e s e a r C h open access to scientific and medical research Open access Full Text article
lung function decline rates according to gOlD
group in patients with chronic obstructive
pulmonary disease
Joohae Kim,1 ho Il Yoon,2
Yeon-Mok Oh,3 seong Yong
lim,4 Ji-hyun lee,5 Tae-hyung
Kim,6 sang Yeub lee,7 Jin hwa
lee,8 sang-Do lee,3 Chang-hoon
lee1
1Division of Pulmonary and Critical Care Medicine,
Department of Internal Medicine, seoul national University College of Medicine, seoul national University hospital, seoul, 2Division of Pulmonary
and Critical Care Medicine, Department of Internal Medicine, seoul national University College of Medicine, seoul national University Bundang hospital, seongnam, 3Department of
Pulmonary and Critical Care Medicine and Clinical research Center for Chronic Obstructive airway Diseases, asan Medical Center, University of Ulsan College of Medicine, 4Division of Pulmonary
and Critical Care Medicine, Department of Internal Medicine, Kangbuk samsung hospital, sungkyunkwan University school of Medicine, seoul, 5Department of Internal Medicine, Cha
Bundang Medical Center, Cha University, seongnam, 6Division of Pulmonology, Department
of Internal Medicine, hanyang University guri hospital, hanyang University College of Medicine, guri, 7Division of respiratory and
Critical Care Medicine, Department of Internal Medicine, College of Medicine, Korea University,
8Department of Internal Medicine, ewha Womans
University Mokdong hospital, College of Medicine, ewha Womans University, seoul, republic of Korea
Background: Since the Global Initiative for Chronic Obstructive Lung Disease (GOLD)
groups A-D were introduced, the lung function changes according to group have been evalu-ated rarely.
Objective: We investigated the rate of decline in annual lung function in patients categorized
according to the 2014 GOLD guidelines.
Methods: Patients with COPD included in the Korean Obstructive Lung Disease (KOLD)
prospective study, who underwent yearly postbronchodilator spirometry at least three times, were included. The main outcome was the annual decline in postbronchodilator forced expira-tory volume in 1 second (FEV1), which was analyzed by random-slope and random-intercept mixed linear regression.
Results: A total 175 participants were included. No significant postbronchodilator FEV1 decline was observed between the groups (-34.4±7.9 [group A]; -26.2±9.4 [group B]; -22.7±16.0 [group C]; and -24.0±8.7 mL/year [group D]) (P=0.79). The group with less symptoms (-32.3±7.2 vs -25.0±6.5 mL/year) (P=0.44) and the low risk group (-31.0±6.1 vs -23.6±7.7 mL/year) (P=0.44) at baseline showed a more rapid decline in the postbronchodilator FEV1, but the trends were not statistically significant. However, GOLD stages classified by FEV1 were significantly related to the annual lung function decline.
Conclusion: There was no significant difference in lung function decline rates according to
the GOLD groups. Prior classification using postbronchodilator FEV1 predicts decline in lung function better than does the new classification.
Keywords: annual lung function decline, chronic obstructive pulmonary disease, GOLD 2014
Introduction
The Global Initiative for Chronic Obstructive Lung Disease (GOLD) proposed a new classification system that grouped patients with COPD into four categories, groups A–D,
based on symptom and risk categories.1 Several studies have since evaluated clinical
outcomes in COPD patients, including exacerbation and mortality, according to the GOLD groups.2–4 However, the decline in lung function, which is another critical therapeutic target,5 has been investigated in only two studies.2,6 Furthermore, in these
studies, the lung function decline rates were analyzed with no adjustment2 or with
adjustment by using only disease severity as the sole covariate.6 Finally, the impact
of specific details related to the GOLD classification (ie, “more symptoms” group vs “less symptoms” group or GOLD high risk group vs low risk group), which could provide information on the use of the GOLD classification system, was not fully
investigated.2,6 In the present study, we evaluated the annual lung function decline
Correspondence: Chang-hoon lee
Division of Pulmonary and Critical Care Medicine, Department of Internal Medicine, seoul national University College of Medicine, seoul national University hospital, 101 Daehak-ro Jongno-gu, seoul, 110-744, republic of Korea
Tel +82 2 2072 4743 Fax +82 2 762 9662 email [email protected] sang-Do lee
Department of Pulmonary and Critical Care Medicine and Clinical research Center for Chronic Obstructive airway Diseases, asan Medical Center, University of Ulsan College of Medicine, 88 Olympic-ro songpa-gu, seoul, 138-736, republic of Korea
Tel +82 2 3010 3140 Fax +82 2 3010 6968 email [email protected]
Year: 2015 Volume: 10
Running head verso: Kim et al
Running head recto: Annual FEV1 decline rates according to COPD GOLD groups DOI: http://dx.doi.org/10.2147/COPD.S87766
Number of times this article has been viewed
This article was published in the following Dove Press journal: International Journal of COPD
according to the GOLD guidelines, by using data from the Korean Obstructive Lung Disease (KOLD) cohort study, a multicenter prospective longitudinal study of patients with
COPD in South Korea.7
Methods
Participant eligibility and study protocol
The KOLD cohort included patients diagnosed with COPD or asthma who were recruited from pulmonary clinics at eleven referral hospitals in Korea from June 2005 to October 2012. The inclusion criteria were: (1) age $40 years; (2) postbron-chodilator forced expiratory volume in 1 second (FEV1)/ forced vital capacity (FVC) ,0.7; (3) current or ex-smoker with a smoking history $10 pack-years; and (4) greater than three annual pulmonary function tests (PFTs). Patients with “pure” asthma were excluded based on the judgement of physicians. As there was a 2-week period to wash out therapeutic drugs just before enrollment in the KOLD cohort study, it was expected that lung functions would increase in the early period of study, which is commonly observed in large clinical trials. Therefore, the 12th month from the initial enrollment was set as a baseline of the study, and analysis of lung function changes started from the baseline and continued to the last follow-up at 1-year intervals. The study was approved by the ethics committees of the Seoul National University Hospital Institutional Review Board and by the institutional review boards of the other 16 hospitals; and all patients provided written, informed consent. We adhered to the Declaration of Helsinki.Definition of groups and stages
The recent GOLD guidelines categorize patients with COPD into groups A–D according to symptoms based on either the modified Medical Research Council (mMRC) grade or the COPD assessment test (CAT) score. Risk is based on either
the FEV1 or the exacerbation history. As CAT scores were
not measured in the KOLD study before 2011, we used the St George’s Respiratory Questionnaire (SGRQ) score as a
surrogate for the CAT score.3 According to the most recent
GOLD guidelines, a symptom score equivalent to an SGRQ score $25 should be used as the cutoff for considering regular
treatment of COPD symptoms.5 Patients with an mMRC $2
or a SGRQ score $25 were placed in the more symptoms
group. Those with a postbronchodilator FEV1 ,50% of the
predicted value or who experienced $ two exacerbations (hospitalization $ one time) in the previous year were placed in the high risk group.
GOLD stages were classified based on the percentage of predicted FEV1:5 stage I was defined as predicted FEV
1 $80%;
stage II was defined as predicted FEV1 50%–79%; stage III
was defined as predicted FEV1 30%–49%; and stage IV was
defined as predicted FEV1 ,30%.
Pulmonary function test
PFT was performed according to American Thoracic
Soci-ety guidelines8 using the Vmax 22 (Sensor Medics, Yorba
Linda, CA, USA) and PFDX (Medgraphics, St Paul, MN, USA). The spirometry reference values were based on the
Korean equation.9 Postbronchodilator spirometry values
were measured 15 minutes after administering 400 μg of
salbutamol. Lung volume, including the total lung capac-ity (TLC) and residual volume (RV), was measured using body plethysmography which were V6200 (CareFusion,
San Diego, CA, USA), PFDX, or Vmax 22.10 The
diffus-ing capacity of carbon monoxide (DLCO) was measured by assessing the single-breath carbon monoxide uptake
(Vmax 22 or PFDX).11 The postbronchodilator FEV
1 and FVC, TLC, RV, and DLCO were measured at baseline and at each annual visit.
statistical analysis
Baseline characteristics between groups were compared using the χ2 and Fisher’s exact tests for categorical variables and the t-test and Mann–Whitney U-test for con-tinuous variables. The main outcome was the annual rate of change in the postbronchodilator FEV1. Assuming an
annual rate of decline in the FEV1 between groups A and D
of 30 mL/year with a 45 mL/year standard deviation, the estimated sample size was calculated as 192 (48 patients per group) with a 5% type 1 error and 90% power.
The annual FEV1 decline rates were subjected to
random-slope and random-intercept mixed linear regression analyses. Covariates in the models included time (year), time by group (or category) interaction, age, sex, height,
weight, smoking status,12,13 and the medication possession
ratio of respiratory medications. Respiratory medications included combined inhaled corticosteroids and long-acting β-agonists (ICS/LABA), and inhaled long-acting muscarinic antagonists (LAMA), as these drugs may affect the decline in lung function according to recent large random controlled trials.13,14 Akaike information criterion (AIC) was used to select a better statistical model. All statistical analyses were performed using Stata 13.1 (StataCorp, College Station, TX, USA). A P-value ,0.05 indicated a significant difference.
Results
A total 175 patients were included, with 58 (33.1%) categorized as group A, 45 (25.7%) as group B, 15 (8.6%) as group C, and
57 (32.6%) as group D. Table 1 summarizes the baseline characteristics, including the demographic, symptomatic, and spirometry values, and exacerbation history. The subjects
under-went a mean 4.7±1.2 annual PFTs over the follow-up period
(mean 48.2 months). A total 59.4% underwent annual PFTs
more than five times, and 78.3% underwent PFT more than four times. The proportion of patients who had ever used LAMA during the follow-up period was similar among the four groups
(P=0.17), meanwhile patients who had more severe symptoms
or lower FEV1 were likely to use ICS/LABA (P=0.003).
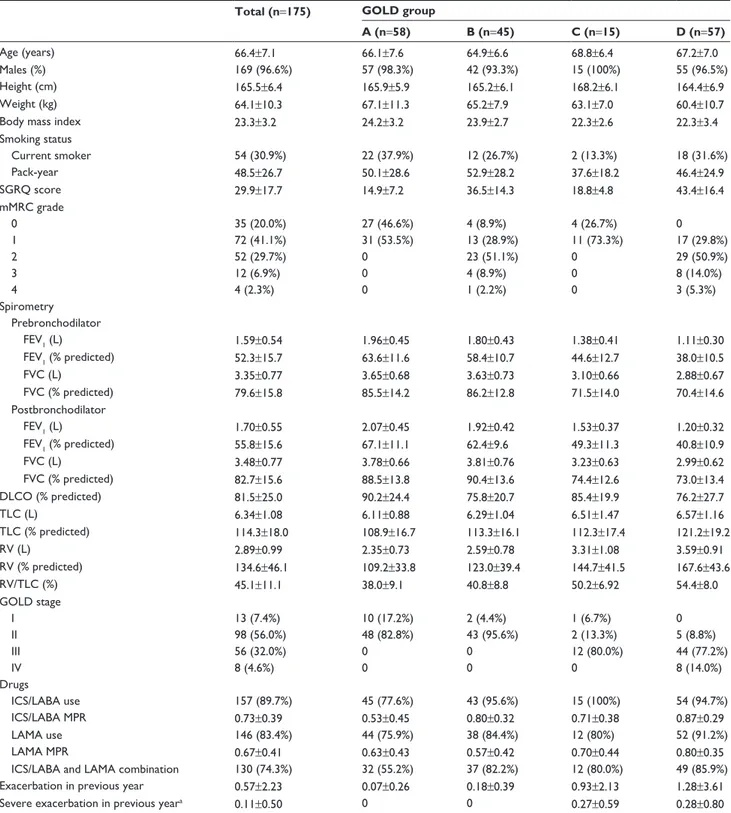
Table 1 Baseline patient characteristics and long-term outcomes
Total (n=175) GOLD group
A (n=58) B (n=45) C (n=15) D (n=57)
age (years) 66.4±7.1 66.1±7.6 64.9±6.6 68.8±6.4 67.2±7.0
Males (%) 169 (96.6%) 57 (98.3%) 42 (93.3%) 15 (100%) 55 (96.5%)
height (cm) 165.5±6.4 165.9±5.9 165.2±6.1 168.2±6.1 164.4±6.9
Weight (kg) 64.1±10.3 67.1±11.3 65.2±7.9 63.1±7.0 60.4±10.7
Body mass index 23.3±3.2 24.2±3.2 23.9±2.7 22.3±2.6 22.3±3.4
smoking status Current smoker 54 (30.9%) 22 (37.9%) 12 (26.7%) 2 (13.3%) 18 (31.6%) Pack-year 48.5±26.7 50.1±28.6 52.9±28.2 37.6±18.2 46.4±24.9 sgrQ score 29.9±17.7 14.9±7.2 36.5±14.3 18.8±4.8 43.4±16.4 mMrC grade 0 35 (20.0%) 27 (46.6%) 4 (8.9%) 4 (26.7%) 0 1 72 (41.1%) 31 (53.5%) 13 (28.9%) 11 (73.3%) 17 (29.8%) 2 52 (29.7%) 0 23 (51.1%) 0 29 (50.9%) 3 12 (6.9%) 0 4 (8.9%) 0 8 (14.0%) 4 4 (2.3%) 0 1 (2.2%) 0 3 (5.3%) spirometry Prebronchodilator FeV1 (l) 1.59±0.54 1.96±0.45 1.80±0.43 1.38±0.41 1.11±0.30 FeV1 (% predicted) 52.3±15.7 63.6±11.6 58.4±10.7 44.6±12.7 38.0±10.5 FVC (l) 3.35±0.77 3.65±0.68 3.63±0.73 3.10±0.66 2.88±0.67 FVC (% predicted) 79.6±15.8 85.5±14.2 86.2±12.8 71.5±14.0 70.4±14.6 Postbronchodilator FeV1 (l) 1.70±0.55 2.07±0.45 1.92±0.42 1.53±0.37 1.20±0.32 FeV1 (% predicted) 55.8±15.6 67.1±11.1 62.4±9.6 49.3±11.3 40.8±10.9 FVC (l) 3.48±0.77 3.78±0.66 3.81±0.76 3.23±0.63 2.99±0.62 FVC (% predicted) 82.7±15.6 88.5±13.8 90.4±13.6 74.4±12.6 73.0±13.4 DlCO (% predicted) 81.5±25.0 90.2±24.4 75.8±20.7 85.4±19.9 76.2±27.7 TlC (l) 6.34±1.08 6.11±0.88 6.29±1.04 6.51±1.47 6.57±1.16 TlC (% predicted) 114.3±18.0 108.9±16.7 113.3±16.1 112.3±17.4 121.2±19.2 rV (l) 2.89±0.99 2.35±0.73 2.59±0.78 3.31±1.08 3.59±0.91 rV (% predicted) 134.6±46.1 109.2±33.8 123.0±39.4 144.7±41.5 167.6±43.6 rV/TlC (%) 45.1±11.1 38.0±9.1 40.8±8.8 50.2±6.92 54.4±8.0 gOlD stage I 13 (7.4%) 10 (17.2%) 2 (4.4%) 1 (6.7%) 0 II 98 (56.0%) 48 (82.8%) 43 (95.6%) 2 (13.3%) 5 (8.8%) III 56 (32.0%) 0 0 12 (80.0%) 44 (77.2%) IV 8 (4.6%) 0 0 0 8 (14.0%) Drugs ICs/laBa use 157 (89.7%) 45 (77.6%) 43 (95.6%) 15 (100%) 54 (94.7%) ICs/laBa MPr 0.73±0.39 0.53±0.45 0.80±0.32 0.71±0.38 0.87±0.29 laMa use 146 (83.4%) 44 (75.9%) 38 (84.4%) 12 (80%) 52 (91.2%) laMa MPr 0.67±0.41 0.63±0.43 0.57±0.42 0.70±0.44 0.80±0.35
ICs/laBa and laMa combination 130 (74.3%) 32 (55.2%) 37 (82.2%) 12 (80.0%) 49 (85.9%)
exacerbation in previous year 0.57±2.23 0.07±0.26 0.18±0.39 0.93±2.13 1.28±3.61
severe exacerbation in previous yeara 0.11±0.50 0 0 0.27±0.59 0.28±0.80
Notes: Data are presented as n (%) or the mean ± standard deviation (range). aexacerbations requiring hospitalization or an emergency department visit.
Abbreviations: DlCO, diffusing capacity for carbon monoxide; FeV1, forced expiratory volume in 1 second; FVC, forced vital capacity; gOlD, global Initiative for Chronic
Obstructive lung Disease; ICs, inhaled corticosteroid; laBa, long-acting β-agonist; LAMA, long-acting muscarinic antagonist; mMRC, modified Medical Round Council; MPR, medication possession ratio; rV, residual volume; sgrQ, st george’s respiratory Questionnaire; TlC, total lung capacity.
The adjusted annual rates of decline in the
postbroncho-dilator FEV1, postbronchodilator FVC, DLCO, and RV/TLC
were -28.3±4.9 mL/year, -26.8±8.6 mL/year, -1.02%±0.38%,
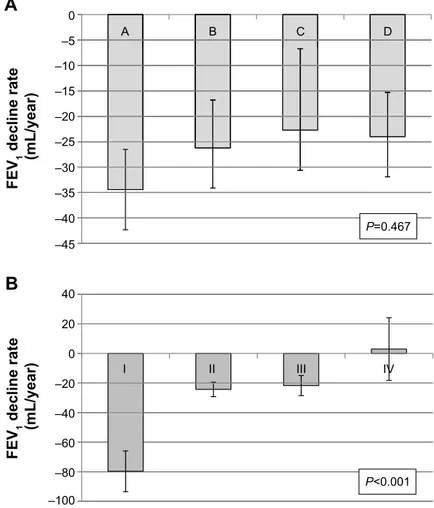
and -0.40%±0.23%, respectively (Figure 1). The decline in
postbronchodilator FEV1 was highest in the GOLD group A,
although no significant differences were observed according to group (Table 2). The group with the fewest symptoms at baseline based on the mMRC and SGRQ criteria showed the fastest decline in postbronchodilator FEV1, although this trend was not statistically significant (P=0.44). The risk group at baseline was not associated with the decline in postbroncho-dilator FEV1. However, GOLD stage was significantly related
with the annual FEV1 decline rates. Stage I COPD patients
showed the fastest lung function decline, while stage IV patients the slowest (P,0.001). The GOLD stage was a
better predictor than was the GOLD group (AIC =423.75 vs
622.08). The decline rates in postbronchodilator FVC were more prominent in groups A and C, which included patients
with the least severe symptoms (P=0.13). When data were
examined according to the percent change per year, the trends were similar (Table 3). The GOLD stage was also a better predictor was than the GOLD group in the annual decline
rates of FEV1%. (AIC =5,384.6 vs 5,497.9) There were no
significant differences in the annual rates of decline in the
postbronchodilator FEV1/FVC, DLCO, and RV/TLC. The
severity of decline in RV/TLC decreased from group A to group D (Table 4).
Discussion
Our findings show that the rate of lung function decline did not differ significantly among the GOLD 2014 groups, which is similar to results in the ECLIPSE cohort study.2
The new GOLD guidelines emphasize that the goals of COPD assessment are to determine the disease severity and its impact on the patient’s current health and risk of future events; to this end, four patient categories were introduced, 0
A
B
–5 –10 –15 –20 –25 –30 –35 –40 –45 A B C D I II III IV 40 20 0 –20 –40 –60 –80 –100 FE V1 decline rate (mL/year)FE
V1 decline rate (mL/year)
P=0.467
P<0.001
Figure 1 annual rate of decline in postbronchodilator FeV1 adjusted by age, sex, height, weight, smoking status, and medication possession ratio of respiratory medications
(ICs-laBa and laMa).
Notes: (A) among gOlD groups (a–D). (B) among gOlD stages (I–IV).
Abbreviations: FeV1, forced expiratory volume in 1 second; gOlD, global Initiative for Chronic Obstructive lung Disease; ICs-laBa, inhaled corticosteroid/long-acting
groups A–D.5 However, it remains unclear whether the GOLD category can accurately predict future risk, including mortality, exacerbations, and the rate of lung function decline. The ECLIPSE cohort study, which included 2,101 COPD patients, showed that group D had the highest mortality and group A the lowest, but surprisingly, group C showed a lower mortality rate than did group B.2 Similar results were reported in a Danish study, which also observed higher mortality in
group B than in group C.15 In a Norwegian study (HUNT2
study), the mortality increased in order from group A to D in men with COPD, but this trend was not observed
in the female patients.16 A similar trend was observed for
severe exacerbation requiring hospitalization and the GOLD group – the risk of severe exacerbation in groups B and C were similar in the Danish study,15 ECLIPSE study,2 and the
COPDGene study.3
The association between the rate of annual lung func-tion decline, another important outcome, and the GOLD groups has rarely been investigated. Although a post hoc analysis of the UPLIFT trial showed group C had lower
annual FEV1 decline rates compared with group B (38 vs
48 mL) (P=0.01), various covariates were not adjusted in
that analysis.6 Only one cohort study has examined the relationship,2 and this report found that the annual FEV
1
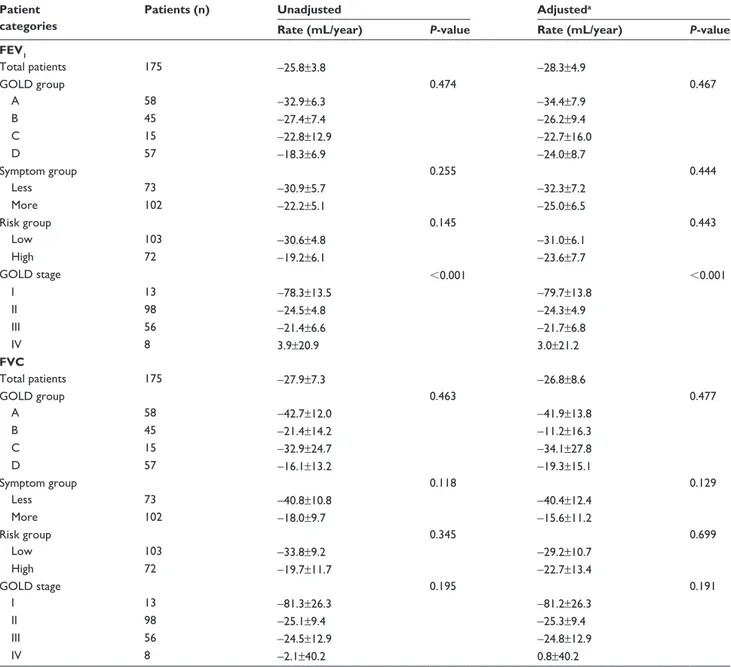
Table 2 annual rate of decline in postbronchodilator FeV1 and FVC (ml/year)
Patient categories
Patients (n) Unadjusted Adjusteda
Rate (mL/year) P-value Rate (mL/year) P-value
FEV1 Total patients 175 -25.8±3.8 -28.3±4.9 gOlD group 0.474 0.467 a 58 -32.9±6.3 -34.4±7.9 B 45 -27.4±7.4 -26.2±9.4 C 15 -22.8±12.9 -22.7±16.0 D 57 -18.3±6.9 -24.0±8.7 symptom group 0.255 0.444 less 73 -30.9±5.7 -32.3±7.2 More 102 -22.2±5.1 -25.0±6.5 risk group 0.145 0.443 low 103 -30.6±4.8 -31.0±6.1 high 72 -19.2±6.1 -23.6±7.7 gOlD stage ,0.001 ,0.001 I 13 -78.3±13.5 -79.7±13.8 II 98 -24.5±4.8 -24.3±4.9 III 56 -21.4±6.6 -21.7±6.8 IV 8 3.9±20.9 3.0±21.2 FVC Total patients 175 -27.9±7.3 -26.8±8.6 gOlD group 0.463 0.477 a 58 -42.7±12.0 -41.9±13.8 B 45 -21.4±14.2 -11.2±16.3 C 15 -32.9±24.7 -34.1±27.8 D 57 -16.1±13.2 -19.3±15.1 symptom group 0.118 0.129 less 73 -40.8±10.8 -40.4±12.4 More 102 -18.0±9.7 -15.6±11.2 risk group 0.345 0.699 low 103 -33.8±9.2 -29.2±10.7 high 72 -19.7±11.7 -22.7±13.4 gOlD stage 0.195 0.191 I 13 -81.3±26.3 -81.2±26.3 II 98 -25.1±9.4 -25.3±9.4 III 56 -24.5±12.9 -24.8±12.9 IV 8 -2.1±40.2 0.8±40.2
Notes: Data are the mean ± standard deviation (range). aadjusted by age, sex, height, weight, smoking status, and the medication possession ratio of respiratory medications
(inhaled corticosteroid/long acting β-agonist and long-acting muscarinic antagonist).
decline rates did not differ significantly between groups
A, B, C, and D (-33.4, -38.0, -30.2, and -31.9 mL/year,
respectively) (P=0.157). Similarly, we did not observe any
significant rate change according to the GOLD groups. In the present study, the annual FEV1 decline rates in groups A,
B, C, and D in the KOLD cohort were -34.4, -26.2, -22.7,
and -24.0 mL/year, respectively (P=0.467).
The lack of significant change in the annual lung function decline between GOLD groups A to D may be explained in
several ways. First, the exacerbation history and FEV1 may
exert differing effects on the annual lung function decline. The exacerbation history and FEV1 are the two criteria used
to categorize patients into the low vs high risk GOLD groups.2 In the ECLIPSE study, the prior exacerbation history did not affect the annual FEV1 change (P=0.57).12 Interestingly, a
lower FEV1 was associated with a slower rate of lung
func-tion decline in the BODE cohort17 and a pooled analysis of
15 randomized controlled trials.18 These varying effects of
exacerbation history and FEV1 on long-term lung function
decline may eliminate any difference in the rate of declines between groups C and D (high risk group) and groups A and B (low risk group). Consistent with these earlier results, in our study, there was no statistical difference between the high risk and low risk groups.
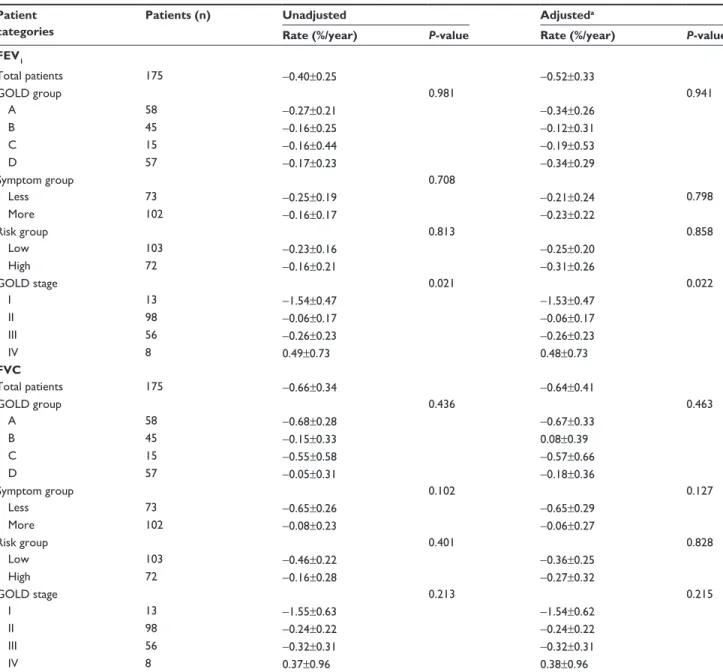
Table 3 annual rate of percentage decline in postbronchodilator FeV1 and FVC (%/year)
Patient categories
Patients (n) Unadjusted Adjusteda
Rate (%/year) P-value Rate (%/year) P-value
FEV1 Total patients 175 -0.40±0.25 -0.52±0.33 gOlD group 0.981 0.941 a 58 -0.27±0.21 -0.34±0.26 B 45 -0.16±0.25 -0.12±0.31 C 15 -0.16±0.44 -0.19±0.53 D 57 -0.17±0.23 -0.34±0.29 symptom group 0.708 less 73 -0.25±0.19 -0.21±0.24 0.798 More 102 -0.16±0.17 -0.23±0.22 risk group 0.813 0.858 low 103 -0.23±0.16 -0.25±0.20 high 72 -0.16±0.21 -0.31±0.26 gOlD stage 0.021 0.022 I 13 -1.54±0.47 -1.53±0.47 II 98 -0.06±0.17 -0.06±0.17 III 56 -0.26±0.23 -0.26±0.23 IV 8 0.49±0.73 0.48±0.73 FVC Total patients 175 -0.66±0.34 -0.64±0.41 gOlD group 0.436 0.463 a 58 -0.68±0.28 -0.67±0.33 B 45 -0.15±0.33 0.08±0.39 C 15 -0.55±0.58 -0.57±0.66 D 57 -0.05±0.31 -0.18±0.36 symptom group 0.102 0.127 less 73 -0.65±0.26 -0.65±0.29 More 102 -0.08±0.23 -0.06±0.27 risk group 0.401 0.828 low 103 -0.46±0.22 -0.36±0.25 high 72 -0.16±0.28 -0.27±0.32 gOlD stage 0.213 0.215 I 13 -1.55±0.63 -1.54±0.62 II 98 -0.24±0.22 -0.24±0.22 III 56 -0.32±0.31 -0.32±0.31 IV 8 0.37±0.96 0.38±0.96
Notes: Data are the mean ± standard deviation (range). aadjusted by age, sex, height, weight, smoking status, and medication possession ratio of respiratory medications
(inhaled corticosteroid-long acting β-agonist and long-acting muscarinic antagonist).
Second, there is no evidence that more severe symptoms are associated with a faster decline in lung function. In a Hokkaido COPD study, the mMRC dyspnea scale score $2 did not predict rapid vs slow decline in lung function (P=0.60
[multivariate model excluding emphysema score]; P=0.75
[multivariate model excluding transfer factor coefficient of the
lung for carbon monoxide]).19 The ECLIPSE study found that
symptoms of chronic bronchitis did not predict a faster decline in lung function.12 These data suggest that there may not be any difference in the lung function decline between groups A and C (less symptoms) and groups B and D (more symptoms).
Potentially, a lower statistical power may be unable to detect any difference in the rates of lung function decline. In the UPLIFT trial, in which the primary end point was the
annual FEV1 decline rate, the sample size was estimated as
758 patients per group to detect a 15 mL/year difference between groups (5% significance, 90% power, and 4-year
standard deviation of 90 mL).20 The KOLD study included
fewer patients per group (15 to 58), which is a weakness of our study. However, the similar estimation of lung function decline rates between the groups (range from –34mL/year to –24mL/year) suggests that there may not be any significant
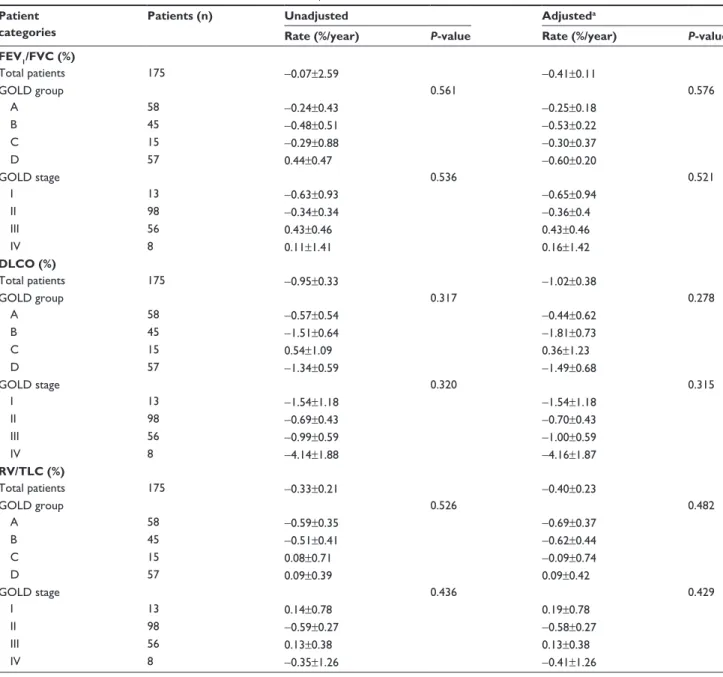
Table 4 annual rate of decline in postbronchodilator FeV1/FVC, DlCO, and rV/TlC (%/year)
Patient categories
Patients (n) Unadjusted Adjusteda
Rate (%/year) P-value Rate (%/year) P-value
FEV1/FVC (%) Total patients 175 -0.07±2.59 -0.41±0.11 gOlD group 0.561 0.576 a 58 -0.24±0.43 -0.25±0.18 B 45 -0.48±0.51 -0.53±0.22 C 15 -0.29±0.88 -0.30±0.37 D 57 0.44±0.47 -0.60±0.20 gOlD stage 0.536 0.521 I 13 -0.63±0.93 -0.65±0.94 II 98 -0.34±0.34 -0.36±0.4 III 56 0.43±0.46 0.43±0.46 IV 8 0.11±1.41 0.16±1.42 DLCO (%) Total patients 175 -0.95±0.33 -1.02±0.38 gOlD group 0.317 0.278 a 58 -0.57±0.54 -0.44±0.62 B 45 -1.51±0.64 -1.81±0.73 C 15 0.54±1.09 0.36±1.23 D 57 -1.34±0.59 -1.49±0.68 gOlD stage 0.320 0.315 I 13 -1.54±1.18 -1.54±1.18 II 98 -0.69±0.43 -0.70±0.43 III 56 -0.99±0.59 -1.00±0.59 IV 8 -4.14±1.88 -4.16±1.87 RV/TLC (%) Total patients 175 -0.33±0.21 -0.40±0.23 gOlD group 0.526 0.482 a 58 -0.59±0.35 -0.69±0.37 B 45 -0.51±0.41 -0.62±0.44 C 15 0.08±0.71 -0.09±0.74 D 57 0.09±0.39 0.09±0.42 gOlD stage 0.436 0.429 I 13 0.14±0.78 0.19±0.78 II 98 -0.59±0.27 -0.58±0.27 III 56 0.13±0.38 0.13±0.38 IV 8 -0.35±1.26 -0.41±1.26
Notes: Data are the mean ± standard deviation (range). aadjusted by age, sex, height, weight, smoking status, and medication possession ratio of respiratory medications
(ICs-laBa and laMa).
Abbreviations: DlCO, diffusing capacity for carbon monoxide; FeV1, forced expiratory volume in 1 second; FVC, forced vital capacity; gOlD, global Initiative for Chronic
differences among the groups. Furthermore, we still found no significant difference after adjustment of possible confound-ers, including ICS/LABA and LAMA. However, the initial GOLD stage was significantly related with the lung function decline rate. Compared with the model using GOLD groups, the statistical model using GOLD stages was the better one in the prediction of the annual lung function declines. Similarly, a study using the data in the UPLIFT trial reported that the GOLD stage showed a better model fitness, although the GOLD group was also significantly associated with lung function decline in the study.6 Interestingly, in our study, the better the initial FEV1% was, the faster annual FEV1 decline was observed (P,0.001), as reported in previous studies.17,18
The strength of our study is that a sufficient number of annual spirometry examinations were performed. The subjects underwent a mean 5.4 annual spirometry tests
dur-ing the study period, and ~90% of patients underwent more
than four annual PFTs. In addition, we adjusted for multiple covariates, including the medication possession ratio of ICS/
LABA and LAMA, which can affect lung function decline13,14
in the random-slope and random-intercept mixed linear regression models.
This study has several limitations. The most notable limitation is that the study may be statistically underpow-ered due to the relatively small number of participants, as mentioned earlier, although our sample size met the initial sample size estimation. All participants were Korean, and most were male, which may limit any generalization; however, Korean men have a higher prevalence and more severe disease than Korean women (25.8% [men] vs 9.6%
[women]).21 Third, we used the SGRQ score as a surrogate
for the CAT score, as suggested by the new GOLD clas-sification. However, the results of both questionnaires are
strongly correlated,22,23 and the SGRQ score was also used
to assess COPD classification in the COPDGene study.3 In
addition, the recent GOLD guidelines recommend that a symptom score equivalent to an SGRQ score $25 should be used as the cutoff for considering regular treatment of
symptoms.5
In conclusion, we found no significant differences in the rate of lung function decline according to the GOLD groups. Compared with the new classification model using GOLD 2014, the older classification model using solely FEV1 could predict the rate of decline in lung function better.
Acknowledgments
The authors thank Woo Jin Kim, Kwang Ha Yoo, Sei Won Lee, Jae Seung Lee, Chin Kook Rhee, and Hyun-Jeong Lee.
Disclosure
The authors report no conflicts of interest in this work.
References
1. Global Initiative for Chronic Obstructive Lung Disease (GOLD). Global
Strategy for the Diagnosis, Management, and Prevention of Chronic Obstructive Lung Disease. Revised 2011. Global Initiative for Chronic
Obstructive Lung Disease, Inc. Available from: http://www.goldcopd. org/uploads/users/files/GOLD_Report_2011_Feb21.pdf. Accessed July 12, 2015.
2. Agusti A, Edwards LD, Celli B, et al; ECLIPSE Investigators. Char-acteristics, stability and outcomes of the 2011 GOLD COPD groups in the ECLIPSE cohort. Eur Respir J. 2013;42(3):636–646.
3. Han MK, Muellerova H, Curran-Everett D, et al. GOLD 2011 disease severity classification in COPDGene: a prospective cohort study. Lancet
Respir Med. 2013;1(1):43–50.
4. Soriano JB, Alfageme I, Almagro P, et al. Distribution and prognostic validity of the new Global Initiative for Chronic Obstructive Lung Disease grading classification. Chest. 2013;143(3):694–702. 5. Global Initiative for Chronic Obstructive Lung Disease (GOLD). Global
Strategy for the Diagnosis, Management, and Prevention of Chronic Obstructive Lung Disease. Updated 2014. Global Initiative for Chronic
Obstructive Lung Disease, Inc. Available from: http://www.goldcopd. org/uploads/users/files/GOLD_Report2014_Feb07.pdf. Accessed July 12, 2015.
6. Goossens LM, Leimer I, Metzdorf N, Becker K, Rutten-van Mölken MP. Does the 2013 GOLD classification improve the ability to predict lung function decline, exacerbations and mortality: a post-hoc analysis of the 4-year UPLIFT trial. BMC Pulm Med. 2014;14:163.
7. Park TS, Lee JS, Seo JB, et al. Study design and outcomes of Korean Obstructive Lung Disease (KOLD) cohort study. Tuberc Respir Dis
(Seoul). 2014;76(4):169–174.
8. Miller MR, Hankinson J, Brusasco V, et al; ATS/ERS Task Force. Standardisation of spirometry. Eur Respir J. 2005;26(2):319–338. 9. Choi JK, Paek D, Lee JO. Normal predictive values of spirometry in
Korean population. Tuberc Respir Dis. 2005;58(3):230–242. 10. Wanger J, Clausen JL, Coates A, et al. Standardisation of the
measure-ment of lung volumes. Eur Respir J. 2005;26(3):511–522.
11. Macintyre N, Crapo RO, Viegi G, et al. Standardisation of the single-breath determination of carbon monoxide uptake in the lung. Eur Respir J. 2005;26(4):720–735.
12. Vestbo J, Edwards LD, Scanlon PD, et al; ECLIPSE Investigators. Changes in forced expiratory volume in 1 second over time in COPD.
N Engl J Med. 2011;365(13):1184–1192.
13. Celli BR, Thomas NE, Anderson JA, et al. Effect of pharmacotherapy on rate of decline of lung function in chronic obstructive pulmonary dis-ease: results from the TORCH study. Am J Respir Crit Care Med. 2008; 178(4):332–338.
14. Decramer M, Celli B, Kesten S, Lystig T, Mehra S, Tashkin DP; UPLIFT investigators. Effect of tiotropium on outcomes in patients with moderate chronic obstructive pulmonary disease (UPLIFT): a prespecified subgroup analysis of a randomised controlled trial. Lancet. 2009;374(9696):1171–1178.
15. Lange P, Marott JL, Vestbo J, et al. Prediction of the clinical course of chronic obstructive pulmonary disease, using the new GOLD classifica-tion: a study of the general population. Am J Respir Crit Care Med.2012; 186(10):975–981.
16. Leivseth L, Brumpton BM, Nilsen TI, Mai XM, Johnsen R, Langhammer A. GOLD classifications and mortality in chronic obstructive pulmo-nary disease: the HUNT Study, Norway. Thorax. 2013;68(10): 914–921.
17. Casanova C, de Torres JP, Aguirre-Jaíme A, et al. The progression of chronic obstructive pulmonary disease is heterogeneous: the experi-ence of the BODE cohort. Am J Respir Crit Care Med. 2011;184(9): 1015–1021.
18. Tantucci C, Modina D. Lung function decline in COPD. Int J Chron
International Journal of COPD
Publish your work in this journal
Submit your manuscript here: http://www.dovepress.com/international-journal-of-chronic-obstructive-pulmonary-disease-journal The International Journal of COPD is an international, peer-reviewed
journal of therapeutics and pharmacology focusing on concise rapid reporting of clinical studies and reviews in COPD. Special focus is given to the pathophysiological processes underlying the disease, intervention programs, patient focused education, and self management protocols.
This journal is indexed on PubMed Central, MedLine and CAS. The manuscript management system is completely online and includes a very quick and fair peer-review system, which is all easy to use. Visit http://www.dovepress.com/testimonials.php to read real quotes from published authors.
Dove
press
19. Nishimura M, Makita H, Nagai K, et al; Hokkaido COPD Cohort Study Investigators. Annual change in pulmonary function and clinical phenotype in chronic obstructive pulmonary disease. Am J Respir Crit
Care Med. 2012;185(1):44–52.
20. Decramer M, Celli B, Tashkin DP, et al. Clinical trial design consider-ations in assessing long-term functional impacts of tiotropium in COPD: the UPLIFT trial. COPD. 2004;1(2):303–312.
21. Kim DS, Kim YS, Jung KS, et al; Korean Academy of Tuberculosis and Respiratory Diseases. Prevalence of chronic obstructive pulmonary disease in Korea. Am J Respir Crit Care Med. 2005;172(7):842–847.
22. Ringbaek T, Martinez G, Lange P. A comparison of the assessment of quality of life with CAT, CCQ, and SGRQ in COPD patients participat-ing in pulmonary rehabilitation. COPD. 2012;9(1):12–15.
23. Jones PW, Brusselle G, Dal Negro RW, et al. Properties of the COPD assessment test in a cross-sectional European study. Eur Respir J. 2011; 38(1):29–35.