저작자표시-비영리-변경금지 2.0 대한민국 이용자는 아래의 조건을 따르는 경우에 한하여 자유롭게 l 이 저작물을 복제, 배포, 전송, 전시, 공연 및 방송할 수 있습니다. 다음과 같은 조건을 따라야 합니다: l 귀하는, 이 저작물의 재이용이나 배포의 경우, 이 저작물에 적용된 이용허락조건 을 명확하게 나타내어야 합니다. l 저작권자로부터 별도의 허가를 받으면 이러한 조건들은 적용되지 않습니다. 저작권법에 따른 이용자의 권리는 위의 내용에 의하여 영향을 받지 않습니다. 이것은 이용허락규약(Legal Code)을 이해하기 쉽게 요약한 것입니다. Disclaimer 저작자표시. 귀하는 원저작자를 표시하여야 합니다. 비영리. 귀하는 이 저작물을 영리 목적으로 이용할 수 없습니다. 변경금지. 귀하는 이 저작물을 개작, 변형 또는 가공할 수 없습니다.
공학박사학위논문
SYNTHESIS AND APPLICATION OF
ANTIMICROBIAL POLY(VINYL ALCOHOL)
ELECTROSPUN NANOFIBERS FOR
WATER FILTRATION
항미생물 폴리비닐 알코올계 전기방사
나노파이버 제조 및 수처리 여과 적용
2015 년 8 월
서울대학교 대학원
생태조경∙지역시스템공학부
지역시스템공학전공
박 정 안
SYNTHESIS AND APPLICATION OF
ANTIMICROBIAL POLY(VINYL ALCOHOL)
ELECTROSPUN NANOFIBERS FOR
WATER FILTRATION
A DISSERTATION
SUBMITTED TO THE DEPARTMENT OF LANDSCAPE
ARCHITECTURE AND RURAL SYSTEMS ENGINEERING
AND THE COMMITTEE ON GRADUATE STUDIES OF
SEOUL NATIONAL UNIVERSITY
IN PARTIAL FULFILLMENT OF THE REQUIREMENTS
FOR THE DEGREE OF
DOCTOR OF PHILOSOPHY
By
JEONG-ANN PARK
AUGUST, 2015
i
ABSTRACT
This thesis deals with the fabrication, characterization, and evaluation antimicrobial and anti-biofouling activity of electrospun poly (vinyl alcohol) (PVA) nanofibers with quaternary ammonium compound (QAC) and PVA/poly acrylic acid (PAA) nanofibers with protease for applying in water filtration. BTEAC-PVA electrospun nanofibers was fabricated via co-electrospinning, and PVA/PAA-Cu(II) containing α-chymotrypsin was synthesized with soaking treatment after electrospinning. The synthesized nanofibers were characterized by various analytical techniques such as SEM, EDS, DSC, TGA, FTIR, and CFP.
BTEAC-PVA nanofibers containing 2.6% BTEAC were fabricated to test the antibacterial and antiviral activities. For the BTEAC-PVA nanofibers, the bacterial reduction ratio increased with increasing contact time, demonstrating that BTEAC-PVA nanofibers successfully inhibited the growth of bacteria. In addition, the antiviral tests against viruses (bacteriophages MS2 and PhiX174) showed that the BTEAC-PVA nanofibers inactivated both MS2 and PhiX174. BTEAC-PVA deposited on GF membrane (BTEAC-PVA/GF ENMs) for increasing mechanical strength. BTEAC-PVA/GF ENMs were also examined water stability, flux, pore size, leaching, and D.magna toxicity that they are good candidate for environmental friendly micro-filter as water filter. After 10 ml filtration, 4.88 LRV (E. coli) and 5.75 LRV (S. aureus) was achieved using
ii
BTEAC-PVA/GF ENMs. Finally, 2.26 LRV (E. coli) and 3.29 LRV (S. aureus) was obtained after 500 ml filtrate volume with BTEAC-PVA/GF ENMs. The antibacterial water filtration test for river water were also performed that 67 CFU/mL (Total coliforms) in river water was removed all by BTEAC-PVA/GF ENMs during the filtration test. For anti-biofouling activity, deposited BTEAC-PVA on PC membrane (BTEAC-BTEAC-PVA/PC ENMs) could enhance the flux due to protect from biofouling of PC membrane with microorganism (K. pneumonia) solutions. Anti-biofouling effect was due to contact-dependent killing of sessile cells rather than reduction in the number of planktonic cells through biofouling resistance test. Antimicrobial mechanism of BTEAC-PVA nanofibers is damaging bacterial membrane observed by fluorescence microscopy and field emission scanning electron microscopy (FESEM) images. BTEAC-PVA/PC ENMs generally showed retaining antimicrobial activity over 6 cycles in regeneration study with bacteria, and mixed bacteria strain solution.
PVA/PAA nanofibers were successfully coordinated/chelated with Cu(II), then immobilization of α-chymotrypsin. The α-chymotrypsin is a proteas that could inhibit 53.50% of P. aeruginosa and 35.53% of S. aureus biofilm formation and reduce 58.2 % of P. aeruginosa biofilm and 43.5% of S. aureus biofilm with a microtiter assay. The Cu(II) adsorption capacity of PVA/PAA nanofibers is 44.85 mg/g (initial Cu(II) concentration = 500 mg/L, reaction time = 24 h) then immobilized amount of α-chymotrypsin on PVA/PAA-Cu(II)
iii
nanofibers is 25.56 ± 2.72 mg/g. PVA/PAA-Cu(II) nanofibers containing α-chymotrypsin have a good performance of anti-biofouling by reducing sessile cells via degrade EPS, especially protein.
The functionalized PVA nanofibers were applied as a water filter, and showed antibacterial and anti-biofouling performance with various tests including contact test, dynamic test, dead-end filtration test, and incubation test. In addition, this dissertation provides the possibility of eco-friendly approaches for the preparation of PVA based nanofibers containing QAC and protease, and their potential applications in water filtration.
Keywords: Electrospun nanofiber, Poly (vinyl alcohol),
Antimicrobial, Quaternary ammonium compound, Protease, Water
filtration
iv
CONTENTS
ABSTRACT ... i
CONTENTS ... iv
LIST OF TABLES ... ix
LIST OF FIGURES ... xi
Chapter 1 Introduction ... 1
1.1 Background ... 2
1.1.1 Electrospun nanofibers for water filtration ... 2
1.1.2 Anti-biofouling activity using antimicrobial ENMs ... 4
1.1.3 Quaternary ammonium compound as antimicrobial agent
... 5
1.1.4 Enzymes as anti-biofouling agent ... 6
1.1.5 Poly (vinyl alcohol) (PVA) polymer ... 8
1.2 Objective ... 10
Chapter 2 Literature Review ... 18
2.1 Electrospun condition of PVA nanofiber ... 19
2.2 QAC functionalized electrospun nanofibers for
antimicrobial and anti-fouling activity in aqueous solution . 22
2.3 Enzyme immobilized on electrospun nanofibers for
anti-biofouling ... 23
v
2.4 Electrospun PVA nanofibers for water treatment ... 25
Chapter 3 Preparation and Characterization of
Antimicrobial Electrospun Poly(vinyl alcohol)
Nanofibers Containing Benzyl Triethylammonium
chloride ... 31
3.1 Materials and methods ... 32
3.1.1 Electrospinning of PVA nanofibers ... 32
3.1.2 Electrospinning of BTEAC-PVA nanofibers ... 33
3.1.3 Characterization of PVA and BTEAC-PVA nanofibers .. 34
3.1.4 Antibacterial tests ... 35
3.1.5 Antiviral tests ... 37
3.2 Results and discussion ... 39
3.2.1 Electrospun PVA nanofibers ... 39
3.2.2 Electrospun BTEAC-PVA nanofibers ... 44
3.2.3 FT-IR, TGA and EDS analyses ... 50
3.2.4 Antibacterial tests ... 53
3.2.5 Antiviral tests ... 60
Chapter 4 Functionalization of Poly(vinyl alcohol)
Electrospun Nanofibrous Membranes with Benzyl
Triethylammonium Chloride for Antimicrobial Water
Filtration ... 62
4.1 Materials and methods ... 63
vi
4.1.2 Characterization of ENMs ... 64
4.1.3 Immersion, leaching, and toxicity tests for BTEAC ... 66
4.1.4 Antimicrobial water filtration tests ... 67
4.2 Results and discussion ... 70
4.2.1 Characteristics of BTEAC-PVA ENMs ... 70
4.2.2 BTEAC leaching and toxicity ... 75
4.2.3 Antibacterial assessment with filtration test ... 82
4.2.4 Antiviral water filtration tests ... 90
Chapter 5 Anti-biofouling Activity of Poly(vinyl
alcohol) Electrospun Nanofibrous Membranes with
Benzyl Triethylammonium Chloride ... 93
5.1 Materials and methods ... 94
5.1.1 Electrospun BTEAC-PVA ENMs ... 94
5.1.2 Characterization of BTEAC-PVA ENMs ... 95
5.1.3 Anti-biofouling activity of BTEAC-PVA ENMs ... 96
5.1.3.1 Anti-fouling activity by contact killing ... 96
5.1.3.2 Anti-fouling activity by preventing biofilm formation .. 98
5.2 Results and discussion ... 100
5.2.1 Characteristics of BTEAC-PVA/PC ENMs ... 100
5.2.1.1 Morphology ... 100
5.2.1.2 Swelling property of BTEAC-PVA nanofibers ... 102
vii
5.2.1.4 Retaining BTEAC from BTEAC-PVA nanofibers .... 109
5.2.2 Evaluation of BTEAC-PVA ENMs anti-biofouling ... 111
5.2.2.1 The effect of contact time for contact killing ... 111
5.2.2.2 The effect of the number of bacteria for contact killing
... 115
5.2.2.3 Regeneration studies for contact killing ... 120
5.2.2.4 Preventing biofilm formation ... 122
Chapter 6 Immobilization of α-Chymotrypsin on
Electrospun Poly(vinyl alcohol) /Poly(acrylic acid)
Nanofibers for Anti-biofouling Activity ... 124
6.1 Materials and methods ... 125
6.1.1 Microtiter assay for biofilm removal and preventing
biofilm formation using enzymes ... 125
6.1.2 Electrospinning of PVA/PAA nanofibers ... 127
6.1.3 Preparation of PVA/PAA-Cu(II) nanofibers ... 128
6.1.4 Immobilization of protease on PVA/PAA-Cu(II)
nanofibers ... 129
6.1.5 Characterization of PVA-PAA nanofibers ... 129
6.1.6 Degradation of biofilm EPS using PVA/PAA-Cu (II)-α
nanofibers ... 130
6.1.7 Anti-biofouling activity of adhesion-inhibition ... 131
6.2 Results and discussion ... 133
6.2.1 Effect of enzyme treatment on formation and removal of
biofilms... 133
viii
6.2.2 Electrospun PVA/PAA nanofibers ... 137
6.2.3 Preparation of PVA/PAA-Cu(II)-α nanofibers ... 140
6.2.4 Degradation of EPS from PVA/PAA-Cu(II)-α nanofibers
... 146
6.2.5 Anti-biofouling activity of PVA/PAA-Cu(II)-α nanofibers
... 150
Chapter 7 General Conclusions and
Recommendations ... 152
7.1 General Conclusions ... 153
7.2 Recommendations ... 157
REFERENCES ... 159
ix
LIST OF TABLES
Table 1.1 Electrospinning timeline ... 13
Table 1.2 Processing parameters in eletrospinning ... 14
Table 2.1 Previous studies for QAC containing electrospun nanofibers
for antimicrobial activity in aqueous solution. ... 28
Table 2.2 Previous studies for immobilization enzymes on PVA based
electrospun nanofibers ... 29
Table 2.3 Previous studies for removal microbes from aqueous solution
using PVA electrospun nanofibers ... 30
Table 3.1 Results of MIC tests using various concentrations of BTEAC
... 47
Table 3.3 Results of agar diffusion method using PVA and BTEAC-PVA
nanofibers ... 57
Table 4.1 Characteristics of BTEAC-PVA ENMs and PVA ENMs
excluding the support layer (GF) ... 74
Table 4.2 Filter characteristics of the BTEAC-PVA/GF ENMs, PVA/GF
ENMs, GF, and PC used in the antimicrobial filtration tests ... 86
Table 4.3 Antibacterial water filtration test results for river water
collected from the Han River, Seoul, Korea ... 89
Table 5.1 Properties of PVA and BTEAC-PVA nanofibers after water
immersion ... 103
x
Table 5.3 The results of tests of various numbers of bacteria (contact time
= 30 min) ... 117
Table 5.4 Growth of P. aeruginosa and S. aureus biofilm (sessile cells)
and planktonic cells with BTEAC-PVA and PVA ENMs for 72 h. .... 123
Table 6.1 Growth of P. aeruginosa biofilm (sessile cells) and planktonic
cells with PVA/PAA, PVA/PAA-Cu(II), and PVA/PAA-Cu(II)-α
nanofibers. ... 151
xi
LIST OF FIGURES
Figure 1.1 Electrospinning set up ... 11
Figure 1.2 The number of published research papers about nanofiber and
electrospinning in each year ... 12
Figure 1.3 General structure of QAS ... 15
Figure 1.4 Antimicrobial mechanisms of QAC ... 16
Figure 1.5 Thermal cross-linking mechanism between PVA and PAA
through esterification reaction ... 17
Figure 3.1. FESEM images of PVA nanofibers prepared at various
electrospinning conditions (voltage and flow rate). ... 41
Figure 3.2 Diameter ranges of nanofibers prepared at a voltage of 15 kV
and flow rate of 1.0 mL h
-1(inset = FESEM image of nanofibers): (a)
PVA nanofibers; (b) 2.6 % BTEAC-PVA nanofibers. ... 42
Figure 3.3 Average diameters of PVA nanofibers prepared at various
electrospinning conditions (voltage and flow rate). ... 43
Figure 3.4 FESEM images: (a) branched nanofibers; (b) fused nanofibers.
... 49
Figure 3.5 Characteristics of nanofibers: (a) FT-IR spectra; (b) TGA
thermograms; (c) EDS pattern. ... 52
Figure 3.6 Antibacterial test results of 2.6 % BTEAC-PVA nanofibers
(intimate contact method): (a) S. aureus; (b) K. pneumonia. ... 58
Figure 3.7 Antibacterial test results of 2.6 % BTEAC-PVA nanofibers
(dynamic contact method): (a) S. aureus; (b) K. pneumonia; (C) PhiX174;
(d) MS2 ... 59
xii
Figure 4.1 Characteristics of electrospun nanofiber membranes (ENMs)
that were prepared with the heat-methanol treatment: (a) SEM image of
BTEAC-PVA ENMs (bar = 1 um); (b) diameter range of BTEAC-PVA
ENMs; (c) SEM image of PVA ENMs (bar = 1 um); (d) diameter range
of PVA ENMs. ... 73
Figure 4.2 Nitrogen contents of BTEAC-PVA ENMs under various
immersion times (inset = FESEM images of immersed BTEAC-PVA
ENMs). ... 79
Figure 4.3 BTEAC leached from BTEAC-PVA ENMs during water
filtration. ... 80
Figure 4.4 Immobilization of D. magna as a function of BTEAC
concentrations (inset = 24-h and 48-h EC50 values along with 95%
confidence intervals). ... 81
Figure 4.5 Bacteria log removal (LRV) by BTEAC-PVA/GF ENMs,
PVA/GF ENMs, and GF: (a) E. coli; (b) S. aureus. Inset = FESEM image
of bacteria-deposited BTEAC-PVA ENMs (cross-sectional view). ... 87
Figure 4.6 Pore size distribution of the BTEAC-PVA/GF ENMs,
PVA/GF ENMs, GF, and PC used in the antimicrobial filtration tests. 88
Figure 4.7 Bacteriophage log removal (LRV) by BTEAC-PVA/GF
ENMs, PVA/GF ENMs, PC, and GF: (a) MS2; (b) PhiX174. ... 92
Figure 5.1 SEM image of BTEAC-PVA/PC ENMs. ... 101
Figure 5.2 SEM images of BTEAC-PVA nanofibers: (a) no water
immersion; (b) after water immersion for 48 h. ... 104
Figure 5.3 The normalized flux of BTEAC-PVA/PC ENMs, PVA/PC
ENMs, and PC membrane with distilled water (DW), and DW with K.
pneumonia. ... 108
xiii
Figure 5.4 The remaining content of BTEAC on BTEAC-PVA
nanofibers after immersion testing. ... 110
Figure 5.5 Log reduction of bacteria with BTEAC-PVA/PC ENMs,
PVA/PC ENMs, and the PC membrane according to various contact
times (0-60 min): (a) S. aureus; (b) K. pneumonia; (c) E. coli. ... 114
Figure 5.6 Fluorescent microscopy images showing the antibacterial
activity of BTEAC-PVA ENMs and PVA ENMs with contact: (a) S.
aureus – PVA ENMs; (b) S. aureus – BTEAC-PVA ENMs; (c) K.
pneumonia – PVA ENMs; (d) K. pneumonia – BTEAC-PVA ENMs; (e)
E. coli – PVA ENMs; (f) E. coli – BTEAC-PVA ENMs. ... 118
Figure 5.7 SEM images of bacterial contact on PVA and BTEAC-PVA
ENMs (a) S. aureus – PVA ENMs; (b) S. aureus–BTEAC-PVA ENMs;
(c) K. pneumonia– PVA ENMs; (d) K. pneumonia– BTEAC-PVA ENMs;
(e) E. coli– PVA ENMs; (f) E. coli – BTEAC-PVA ENMs. ... 119
Figure 5.8 The results of regeneration testing over 6 cycles: (a) Bacteria
(S. aureus, K. pneumonia, E. coli); (b) Mixed bacteria species ... 121
Figure. 6.1 Biofilm inhibition rate with enzyme treatment ... 135
Figure. 6.2 Biofilm degradation ratio with enzyme treatment ... 136
Figure. 6.3 FESEM images for PVA-PAA nanofibers prepared at various
voltage conditions during electrospinning (flow rate (0.5 ml/h, TCD =
15cm) (a) 12.5 kV; (b) 13.5 kV; (c) 15 kV; (d) 16 kV; (e) 17 kV; (f) 18
kV. ... 138
Figure. 6.4 The diameter distribution of PVA/PAA nanofibers (voltage =
17 kV, flow rate = 0.5 ml/h) ... 139
Figure 6.5 Schematic showing the immobilization of α-chymotrypsin on
PVA/PAA-Cu(II) nanofibers. ... 143
xiv
Figure 6.6 PVA/PAA-Cu(II)-α nanofibers: (a) FESEM image; (b) FT-IR
spectra. ... 144
Figure. 6.7 FESEM and EDS analysis (a, b) PVA/PAA nanofibers; (c, d)
PVA/PAA-Cu(II) nanofibers; (d, e) PVA/PAA-Cu(II)- α nanofibers. 145
Figure. 6.8 Concentration of protein and carbohydrates from EPS
produced by P. aeruginosa with PVA/PAA-Cu(II), free α-chymotrypsin,
and PVA/PAA-Cu(II)-α nanofibers... 148
Figure. 6.9 The result of regeneration test of PVA/PAA-Cu(II)- α
nanofibers. ... 149
1
2
1.1 Background
1.1.1 Electrospun nanofibers for water filtration
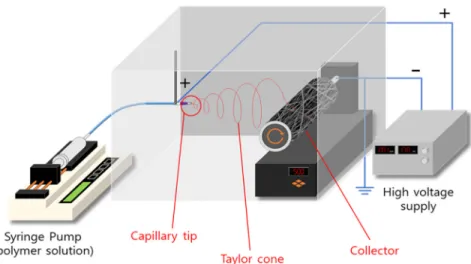
Electrospinning is one of famous methods for preparation nanofibers with dissolved polymers. It was firstly patterned by Anton Formhals in 1934 for fabrication yarn (Table 1.1) (Huang et al., 2003). In mid-1990s, nanofibers were formed using electrospinning (Ranakrishna et al., 2010; Bhattarai et al., 2014). Electrospinning is simple, inexpensive and effective method to produce non-woven nanofibers with nanometer range diameter (Qin et al., 2012). Many parameters of electrospinning procedures affect to morphology of nanofibers (Table 1.2). In the electrospinning process, straight jet ejected from taylor cone could overcome the surface tension when the applied electric field strength (Figure 1.1). The jet remains straight for some distance and then it flies to collector following looping path. Finally, the jet solidified and deposits on the collector as a nonwoven fiber (Liu et al., 2012a).
Nanofibers are defined as fibers with diameter generally between 50~1000 nm and aspect ratio above 1000. Although, there is no regular diameter range of nanofibers in water filter application, however, it is good for filter media with diameter under 500 nm, and, recently, ultrafine nanofibers (diameter below 200 nm) have been paid attention due to their promising applications. The nanofibers have a quite large surface area, flexibility, multiple surface
3
functionalities, and high permeability with many small pores (Qin et al., 2012). Owing to the small fiber diameter and pore size, nanofibers have high filtration efficiency even easily trapping particles (< 0.5 μm) without reducing flow resistantce (Du Plessis, 2011). There has been an increase in publication of research papers in the field of nanofibers (Figure 1.2) because of these interesting properties. Briefly, nanofibers have a great attention for various application mainly in biomedical materials (48.64 %) and water/air filtration (25.82 %) followed by electrode or battery (12.28 %), liquid crystal device (6.53 %), clothing (2.00 %), and so on (4.72 %). The ratio of water filtration in water/air filtration field is about 17.27 %, however, application of electrospun nanofiber in water filtration is rising issues due to great potential of leading new direction of water technology since 2006 (Figure 1.2). The published research papers about water filtration has been grown steadily so far. Numerous articles have defined electrospun nanofibers for water treatment as “Electrospun nanofibrous membranes (ENMs)” (Nasreen et al., 2013). The use of ENMs for water filtration is classified majorly removal of microbes (42.56 %), and removal of heavy metals (22.06 %). About a half of researches have been studied antimicrobial electrospun nanofibers due to problem in membrane filtration of water, biofouling. Antimicrobial ENMs could enhance anti-biofouling activity during water filtration. Antimicrobial electrospun nanofibers appeared to be an attractive anti-biofouling method because of
4
immobilizing antimicrobial agent by embedding or achieving covalent bond in nanofibers that antimicrobial agents have advantages of chemically stable, environmentally safe, and prolonging lifetime without leaching.
1.1.2 Anti-biofouling activity using antimicrobial ENMs
Membrane biofouling is a major problem encountered in membrane filtration processes that biofouling is one of significant obstacle for ENMs, either. Many conventional physical (mechanical cleaning) and chemical (biocides and disinfectant) methods have been performed to control biofilm through killing bacteria and remove biofilms from surface, however, both still have some problems such as increasing retaining cost and producing toxic by-product (Stewart et al., 2000).
The two major strategies for anti-biofouling on ENMs are based on adhesion inhibition and killing bacteria (Banerjee et al., 2011). One way to enhance the adhesion inhibition is weakening hydrophobic interaction between biofoulant (microorganism, extracellular polymeric substances and proteins) and ENMs surface through increasing hydrophilicity of surface (Nisola et al., 2012; Mei et al., 2012). Many of hydrophobic ENMs have been used due to their superior mechanical, chemical and thermal stability, however, it is necessary to improve surface hydrophilicity for application in water filtration/purification and
5
biofouling resistance (Wang et al., 2006; Sun et al., 2010; Botes & Cloete, 2010). Therefore, many attempts to improve the surface hydrophillicity have been performed through surface grafting (Hu et al., 2005, Zuwei et al., 2006; Ramakrishana et al., 2005), adding inorganic particles (Pant et al., 2011), blending polymers (Li et al., 2010), adding materials for quorum sensing inhibiting (Gule et al., 2013), and depositing hydrophilic layers (Na et al., 2000; Wang et al., 2012). Adhesion inhibition strategy have a great effect to hinder the biofilm growth, however, microorganisms are not be killed. The more active approach of anti-biofouling ENMs is killing bacteria with antimicrobial agent such as guanidine compound, metal or metal oxide nanoparticles (Ag, TiO2,
CuO, ZnO), phosphonium salts, carboneous nanomaterials (CNTs, Graphene), and quaternary ammonium compound (QAC). Recently, the studies of metal or metal oxide nanoparticles, and carbonaceous nanomaterials as an antimicrobial agent have been performed, however, potential eco-toxicity and environmental health effects are still concerning issues.
1.1.3 Quaternary ammonium compound as antimicrobial
agent
QAC are known as having a broad spectrum of antimicrobial activity. General structure of QAC is as followed that four of the substituents (R1-R4)
6
(Bshena, 2012) (Figure 1.3). Quaternary ammonium salt containing at least one alkyl substitute are good candidates for killing microorganisms including bacteria, algae, and fungi (Nurdin et al., 1993). Quaternary ammonium compounds are polycationic non-oxidising biocide and widely used in many fields, such as filters, paints, and packaging materials, as an antimicrobial agent to hinder bacterial growth on the surfaces. The antimicrobial mechanism was summarized that electrostatic interaction and adsorption occurred between positively charged ammonium ion on QAC and negatively charged bacteria at the beginning (Figure 1.4). Then, the log lipophilic chain diffuses through the cell wall and leads to disrupt cytoplasmic membrane that K+ ion and other
cytoplasmic constituents are released. In the end, cells are dead followed by precipitation of cell contents (Kawabata & Nishiguchi, 1988; Nurdin et al., 1993). In the case of virus, electrostatic and hydrophobic ineteraction is dominated that inactivation is caused by the disruption of the viral envelope and release nucleocapsid (Tsao et al., 1989).
1.1.4 Enzymes as anti-biofouling agent
Many antimicrobial agent have a difficulties to effectively kill the bacterial cells because they are encased in a matrix of extracellular polymeric substances (EPS) in biofilm, protecting cells within (Donlan & Costerton, 2002; Molobela
7
et al., 2010). Therefore, there is an urgent needs for alternative anti-biofouling
strategy with destroying biofilm such as using hydrolytic enzymes. The use of enzyme is good biofilm control agents because of rapid
degradability, commercially availability and nontoxic to environment (Olsen et al., 2007; Leroy et al., 2008). The most popular targets for biofilm control using enzymes are degrading proteins and polysaccharides because of major components of biofilm (Kristensen et al., 2008). Enzymes remove biofilms by destroying physical integrity of the EPS through weakening the structure of proteins, carbohydrate and lipid through degradation process (Xavier et al., 2005). Especially, protease is important not only degrading protein structure but also preventing attachment of cells to the surface. Also, regulating quorum sensing (QS) enzymes have been used for reducing EPS because QS rules gene expression when reaching the cell density threshold (Kim et al., 2013). Signal molecules such as acyl homoserine lactones (AHLs) are produced and contributed to the microbial attachment on the surface during QS system. Therefore, the studies for protease and QS signal molecule hydrolases have been needed for biofilm reduction. Enzyme immobilization on electrospun nanofibers have great potential to overcome the limitation because nanofibers have a large surface to volume ratio to high enzymes loading, and easily functionalized with chemical/physical treatment to benefit enzyme activity (Wang et al., 2009).
8
1.1.5 Poly (vinyl alcohol) (PVA) polymer
Two types of polymers have been used for the synthesis of antimicrobial nanofibers. The first is related to solvent-soluble polymers such as polyamide (Daels et al., 2011; De Vriez et al., 2011), polyacrylonitrile (Mahapatra et al., 2012; Zhang et al., 2011, Rujitanaroj et al., 2010; Ren et al., 2009; Du Plessis, 2011), polyurethane (Yousef et al., 2012), poly(methyl methacrylate) (Kong et al., 2008), poly(vinylidene) fluoride (Peng et al., 2007), polycarbonate (Kim et al., 2007), poly(vinyl phenol) (Kenawy & Abdel-Fattah, 2002), and cellulose acetate (Anitha et al., 2012). The second includes water-soluble polymers such as polyethylene oxide (An et al., 2009; El-Newehy et al., 2012), poly(acrylic acid) (Li & Hsieh, 2005; Kim et al., 2005), poly(vinylpyrrolidone) (Peng et al., 2007; Srisitthiratkul et al., 2011) and poly(vinyl alcohol) (PVA) (Nirmala et al., 2011; Su et al., 2012; Alipour et al., 2009; Ignatova et al., 2006; Supaphol et al., 2008).
Recently, without toxic organic solvent for environmental friendships, water soluble polymers were useful for electrospinning. PVA is one of the most promising hydrophilic polymer with excellent chemical and thermal stability (Huang et al., 2009; Gule et al., 2012). PVA is soluble in water without solvent (highly hydrophilic), nontoxic (environmentally friendly), biocompatible material, good resistance (chemical, thermal, ultra-violet, oil, organic solvent and infra-red) (Gule et al., 2012), and inexpensiveness. Also, PVA nanofibers
9
have a quite large surface area to mass which means a higher sorption capacity of contaminants in water, possibility for surface functionalization with many hydroxyl group (Liu et al., 2012), and relatively low cell (or protein) adhesion property due to hydrophilic property (Burczak et al., 1996; Wei et al., 2012; Qi et al., 2013). For this reason, PVA nanofibers have been widely used and excellent candidates for water filtration (Gule et al., 2013).
However, it is essential to crosslink the polymer chains in PVA nanofibers for application due to easily soluble in water. Chemical crosslinking is common method to improve the water resistance using glutaraldehyde, acetaldehyde, or formaldehyde. However, it could be toxic to use nanofibers as water filter. Hence, heat and methanol treatment is an alternative environmental friendly method for increasing stability of PVA nanofibers. In addition, hybrid with other non-toxic hydrophilic polymers could be another way to crosslink PVA such as poly(acrylic acid) (PAA) and poly(vinyl pyrrolidone). PAA used as crosslinking reagent that strong crosslinking by ester linkage is formed between the hydroxyl group of PVA and the carboxyl group of PAA with simple heat treatment (Figure 1.5) (Kumeta et al., 2003; Li & Hsieh, 2005).
10
1.2 Objective
This thesis concerned with the synthesis antimicrobial PVA based
electrospun nanofibers through electrospinning and their application in water filtration. The specific objectives of the dissertation are:
1. To manufacture non-woven nanofibers with PVA using electrospinning method and optimize the electrospinning conditions.
2. To improve water stability of PVA nanofibers using environmental friendly crosslinking methods.
3. To synthesize antimicrobial PVA nanofibers containing QAC and characterize them.
4. To evaluate antimicrobial activity of nanofibers containing QAC against different gram-positive and gram-negative bacteria using various methods including contact test, batch experiments, and filtration test.
5. To examine anti-biofouling activity of nanofibers containing QAC by contact killing through filtration test and preventing biofouling through incubation test. 6. To synthesize anti-biofouling PVA/PAA hybrid nanofibers immobilized hydrolytic enzymes and characterize them.
7. To examine the potential of water filtration application without biofouling with QAC and hydrolytic enzyme.
11
12
Figure 1.2 The number of published research papers about nanofiber
and electrospinning in each year
13
Table 1.1 Electrospinning timeline
Year History
1934 Anton Formhals: first patent filed on yarn fabrication using
Electrospinning. (1934-1944)
1936 Norton: patent filed for melt electrospinning.
1952 Vonnegut & Newbauer: invented simple apparatus for
electrical atomization and produced streams of highly electrified uniform roplets of about 0.1 mm in diameter.
1955 Drozin: investigated dispersion of series of liquids into
aerosols under high electric potential.
1966 Simon: patent filed of an apparatus for the production of
non-woven fabrics that were ultrathin and very light in weight with different patterns using electrical spinning.
1971 Baumgarten: made an apparatus to electrospin acrylic fibers
with diameter in the range of 0.05 – 1 μm.
1976 - 1987 • Dispersal of fine particles on electrospinning het • Electrospun fibers as tissue scaffold
• Tubular scaffolds for vascular grafts
• Mass production of electrospun fibers for filtration 1990 - 2000 • Parameters studies of electrospinning to form nanofibers
• Electrospun fibers as composite reinforcement • Electrospun fibers as template
• Electrospinning modelling
14
Table 1.2 Processing parameters in eletrospinning
Solution properties
Viscosity
Polymer
concentration
Molecular weight of polymer
Electrical
conductivity
Elasticity
Surface
tension
Processing condition
Applied voltage
Distance from needle to collector
Volume feed rate
Needle
diameter
Ambient conditions
Temperature
Humidity
Atmospheric
pressure
15
Figure 1.3 General structure of QAS
16
Figure 1.4 Antimicrobial mechanisms of QAC
17
Figure 1.5 Thermal cross-linking mechanism between PVA and PAA
through esterification reaction
18
19
2.1 Electrospun condition of PVA nanofiber
Many researchers have investigated various parameters of electrospinning condition such as PVA concentration (Supaphol & Chuangchote, 2008), applied voltage (Supaphol & Chuangchote, 2008; Zhang et al., 2005; affandi et al., 2010), solution viscosity (Liu et al., 2012), solution conductivity (Arumugam et al., 2009), solution pH (Son et al., 2005), degree of hydrolysis (Park et al., 2010), surface tension (Jia & Qin, 2013), tip-to-distance (TCD) (Zhang et al., 2005; Supaphol & Chuangchote, 2008), and molecular weight (Koski et al., 2004) affecting to produce electrospun fibers for past a few years.
Supaphol & Chuangchote (2008) conducted experiments to understand the effect of solution properties (concentration, viscosity) and process condition (applied voltage, TCD). The viscosity of solution depends on PVA concentration that critical solution viscosity is needed to be formation of stable charged jet (higher than molecular entanglements and lower than discrete droplets). The diameters of PVA fibers were generally increased from 85 nm to 647 nm with increasing PVA concentration (6 - 14 wt%). The average diameters of PVA fibers were slightly decreased with the initially increase applied electrical potential (12.5 – 17.5 kv), and increased with further higher applied voltage (17.5 – 25 kv). This trends would be significant only in the higher PVA concentration (12, 14 wt%). The PVA fibers (6 - 10 wt%) were not statistically significant. Zhang et al (2005) found that there was a slightly increase in
20
average fiber diameter with increasing applied electric field (5-13 kv), however, above 10 kv, ultrafine fibers (Dia <150 nm) were observed because of obtaining broad distribution in the fiber diameter. TCD (8-15 cm) had no significant effect on electrospun fibers with full hydrolyzed PVA. In the case of concentration of PVA (6 - 8 wt%) molphology of fiber was changed from beaded fiber to uniform fiber with increasing diameter gradually. Above 8.3 wt%, PVA solutions could not form fibers but big droplets. Affandi et al. (2010) also insisted that slightly increasing diameter between 15 and 20 kv increasing voltage, however, did not significantly affect PVA-fiber diameter. The increased applied electrical potential induced increasing both coulombic repulsion and electrostatic forces with carrying many number of charges in a jet segment. The increased coulombic repulsion force could cause thinner fiber (with smaller elongated beads), due to increasing stretching forces, while the increased electrostatic forces could lead to increase fiber diameter due to occur bending instability of the jet with increasing speed of the jet segment and mass flow rate. For TCD, the increasing TCD would trigger to decrease the diameter of PVA fiber, however, below 15 cm was suggested that the jet was too dry and strong to stretch further above 15 cm. Jia & Qin (2013) showed that adding surfactant(less than 1%) could reduce the surface tension and fiber diameter of PVA was remarkably deceased from 405 to 100 nm. Park et al. (2010) examined the effects of PVA with various degree of hydrolysis (DH= 88, 96, and 99.9 %)
21
to produce electrospun fibers. The results indicated that the average diameter of the electrospun PVA fibers (conc. ~ 8 wt%) increased with increasing DH. Son et al. (2005) investigated the effect of pH (2.0 – 12.9) with 7 wt% PVA solutions that PVA fibers became straighter and finer with increasing pH (basic condition), while PVA fibers with beads-on-stiring structures were manufactured under acidic condition because of the protonation of PVA. Liu et al (2012) fabricated uniform ultrafine PVA fiber (< 200nm) by adding hydrazine monochloride (HMC), reducing 60 % of viscosity. On the other hand, a beaded morphology was found when the viscosity was too low. Arumugam et al. (2009) compared the effect of adding small amount of three different types salts HMIMCl (room temperature ionic liquid), BTEAC (a quaternary ammonium salt), KCl (inorganic chloride salt) in PVA solution to understand the impact of conductivity on electrospun fibers. Adding salts could cause not only increasing conductivity but also variating surface tension that PVA fibers with electrospinning salted solution were greater than pristine PVA without two exeptions. This phenomenon was explained by collision mechanism that fibers would be combined with aggregation and fusion (self-bundling). Koski et al (2004) studied the effect of average molecular weight of PVA polymer (Mw) that the fiber diameter generally increases with Mw.
22
2.2 QAC functionalized electrospun nanofibers for
antimicrobial and anti-fouling activity in aqueous
solution
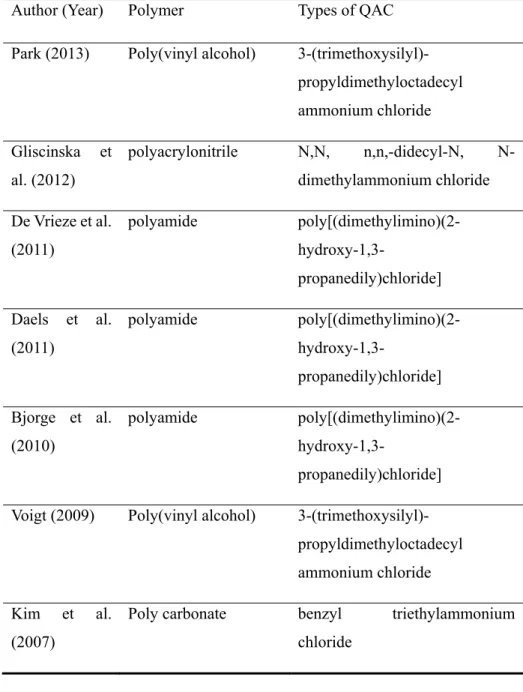
Many kinds of QAC were used as an antimicrobial agent in electrospun nanofibers (Table 2.1), and the most famous QAC is 3-(trimethoxysilyl)-propyldimethyloctadecyl ammonium chloride (Voigt, 2009; Park et al., 2013). Another QAC, such as benzyl triethylammonium chloride (BTEAC), poly[(dimethylimino)(2-hydroxy-1,3-propanedily)chloride] (WSCP), N,N, n,n,-didecyl-N, N-dimethylammonium chloride (DDAC), have been studies for antimicrobial activity on electrospun nanofibers (Kim et al., 2007; Bjorge et al., 2010; Daels et al., 2011; De Vrieze et al., 2011; Gliscinska et al., 2012). Kim et al (2007) found that BTEAC was efficient antimicrobial agent for the first time and electrospun well with Polyamide (PA) polymer. Bjorge et al. (2010), Daels et al. (2011) and De Vrieze et al. (2011) synthesized PA nanofibers containing WSCP and evaluated antimicrobial activity in hospital waste water. Gliscinska et al. (2012) fabricated polyacrylonitrile (PAN) nanofibers modified with DDAC.
QAC is simply incorporated by adding QAC into PVA solution during electrospinning and have great effect to antimicrobial activity. Voight (2009) successfully synthesized antimicrobial functionalisation PVA nanofibers with 3-(trimethoxysilyl)-propyl-dimethyloctadecyl ammonium chloride that mostly
23
inhibited the B. subtilis, while nearly no effect on E. coli with contact and shaking method. Park (2013) fabricated PVA electrospun nanofibers containing 3-(trimethoxysilyl)-propyl-dimethyloctadecyl ammonium chloride. They were performed antibacterial property to both gram-negative bacteria (E. coli) and Gram-positive bacteria (S. aureus) by charge-charge interaction. Also, the mat killed bacteria more than 99 % of its population during 5 times recycling.
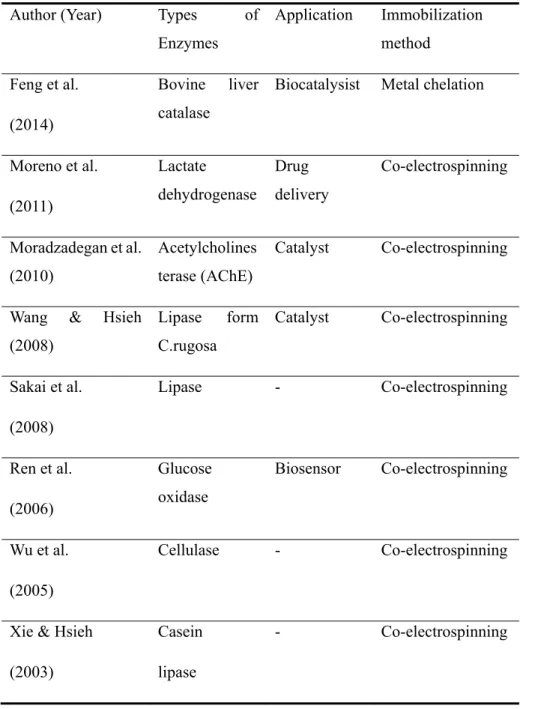
2.3 Enzyme immobilized on electrospun nanofibers
for anti-biofouling
Some researchers have been studied anti-biofouling effect on using enzymes (Leroy et al., 2008; Molobela et al., 2010; Kim et al., 2013). Leroy et al. (2008) evaluated antifouling potential of commercial proteases, glucosidases and lipase that Savinase was the most effective enzyme in both the prevention of bacterial adhesion and the removal of adhered bacteria. Molobela et al. (2010) determined the effect of commercial proteases (savinase, everlase, and polarzyme) and amylases (amyloglucosidase and bacterial amylase novo) on biofilms and extracted EPS formed by p. fluorescens that proteases, especially, savinase and everlase were the most effective enzyme on removing biofilms and degrading the EPS. Kim et al. (2013) investigated the reduction of biofouling on RO membrane with enzyme (acylase I and proteinase K) caused by incubation P. aeruginosa for 4 days. Acylase I (5 μg/ml), proteinase K (100
24
μg/ml), and combination both enzymes removed 9.0, 56.6 and 33.7 % of bacteria on RO membrane, respectively. Proteinase K removed EPS concentration, while, acylase I reduced bacteria numbers not EPS concentration. However, applications of enzymes are limited due to instability, difficulty of recovery and non-reusability in aqueous solutions (Brady & Jordaan, 2009; Wang et al., 2009).
Enzyme immobilization on electrospun nanofibers have great potential to overcome the limitation because nanofibers have a large surface to volume ratio to high enzymes loading, and easily functionalized with chemical/physical treatment to benefit enzyme activity (Wang et al., 2009). Du Plessis et al. (2012) observed anti-biofilm activity in water filtration system with immobilized Savinase, Alcalase, and BAN on PAN electrospun nanofibers. Park et al (2013) electrospun chitosan/PVA nanofibers then aggregate lysozyme on the surface with glutaraldehyde for antibacterial.
PVA nanofibers have been studied for enzyme immobilization electrospun nanofibers (Xia & Hsieh, 2003; Wu et al., 2005; Ren et al., 2006; Sakai et al., 2008; Wang & Hsieh, 2008; Moradzadegan et al., 2010, Feng et al.,2014) (Table 2.2). Mostly, enzymes were mixed with PVA solutions then electrospun for immobilization enzyme on PVA nanofibers, however, Feng et al. (2014) successfully developed electrospun PVA/PA6-Cu(II) nanofibrous membrane for immobilization of catalase.
25
2.4 Electrospun PVA nanofibers for water treatment
Although many conventional methods are widely used for water purification, the new generation of nanofiltration system is the rising issue (Mahanta & Valiyaveettilm, 2013). Application of electrospun nanofibers in water treatment are mainly divided in the two aspects, one is heavy metal removal and another is microbial removal. However, a few studies have been performed related in water treatment.
Removal of heavy metals using PVA electrospun nanofibers was mostly conducted via batch experiment. Wu et al (2010a, b) synthesized thiol-functionalized mesoporous PVA/SiO2 composite nanofibers (Dia 300- 500 nm)
by electrospinning and examined heavy metal ions (Cu2+) adsorption capacity
in aqueous solution using batch test. The largest adsorption capacity was 489.12 mg/g at 303 K and maintained through six recycling processes. PVA/SiO2
composite was also studied as an adsorbent for indigo carmine dye (Teng et al., 2011). Mahanta & Valiyaveettilm (2013) investigated functionalized poly (vinyl alcohol) based nanofibers for the removal of arsenic from water. PVA nanofibers adding Fe3+ ions were prepared and arsenic removal capacity was
found to be 67 mg/g (As(III)), and 36 mg/g (As(V)), each from bath experiments. Arsenic ions were adsorbed on the sorbent surface according to FTIR and XPS results. Wang & Ge (2013) prepared chitosan/poly (vinyl alcohol) fiber mat containing Cerium (III) to remove chromium (VI) from
26
aqueous solution with batch test. Based on the best fit Langmuir model, maximum adsorption capacity is 52.88 mg/g. The removal mechanisms of Cr(VI) by fibrous mat can be explained by two aspects that the electrostatic force attraction and chemisorptions. Abbasizadeh et al. (2013) manufactured
PVA/TiO2 nanofiber adsorbent modified with mercapto groups to remove
radioactive waste, such as uranium (VI) and thorium (IV), from aqueous solution. The influence of TiO2 (and mercapto) contents, adsorbent dose, pH,
contact time, temperature, initial concentration of uranium (VI) and thorium (IV) were examined in batch experiments. The maximum sorption capacities of uranium (VI) and thorium (IV) by langmuir isotherm model were calculated to be 196.1 and 238.1 mg/g at 45 ℃ with pH 4.5 and 5.0, respectively.
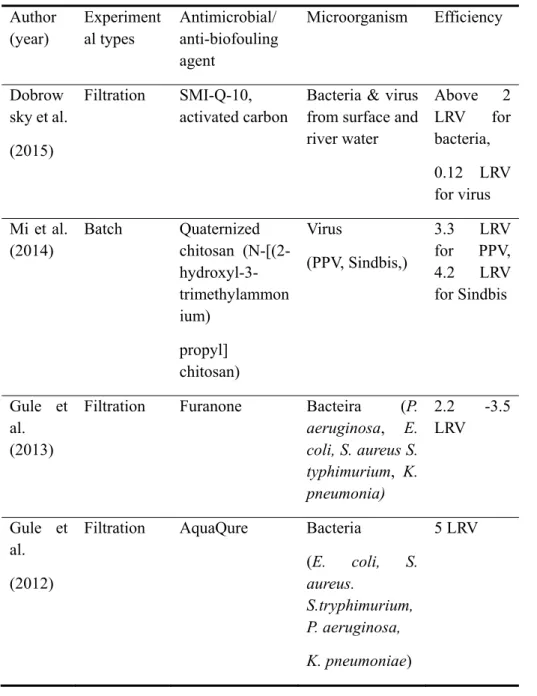
For removal of microbes, several studies have been started to evaluate PVA electrospun nanofibers application in water treatment (Gule et al., 2012; Gule et al., 2013; Mi et al., 2014; Dobrowsky et al., 2015) (Table 2.3). Gule et al (2012) fabricated PVA nanofibers containing biocide Aquaqure that antimicrobial tests show nanofibers achieved up to 5 LRV of various bacteria. Gule et al (2013) produces furanone-containing PVA (PVA/DMHF) nanofibers supported on 0.22 μm sized filter that antimicrobial activity was determined using dead-end filtration system with desired contact time. PVA/DMHF nanofibers reduced 3.5 log in population of P. aeruginosa Xen 5, E. coli Xen 14, and about 2.2 log in population of S. aureus Xen 36, S. typhimurium Xen
27
26, K. pneumonia Xen 39 after 30 min contact followed by filtration. Mi et al (2014) synthesized quaternized chitosan in to PVA electrospun nanofibers for virus removal that 3.3 LRV for PPV and 4.2 LRV for sindbis. Dobrowsky et al (2015) used PVA nanofiber membrane/activated carbon column for treatment harvested rain water for removal of bacteria and virus.
28
Table 2.1 Previous studies for QAC containing electrospun nanofibers
for antimicrobial activity in aqueous solution.
Author (Year) Polymer Types of QAC
Park (2013) Poly(vinyl alcohol)
3-(trimethoxysilyl)-propyldimethyloctadecyl ammonium chloride Gliscinska et al. (2012) polyacrylonitrile N,N, n,n,-didecyl-N, N-dimethylammonium chloride De Vrieze et al. (2011) polyamide poly[(dimethylimino)(2- hydroxy-1,3-propanedily)chloride] Daels et al. (2011) polyamide poly[(dimethylimino)(2- hydroxy-1,3-propanedily)chloride] Bjorge et al. (2010) polyamide poly[(dimethylimino)(2- hydroxy-1,3-propanedily)chloride]
Voigt (2009) Poly(vinyl alcohol)
3-(trimethoxysilyl)-propyldimethyloctadecyl ammonium chloride Kim et al.
(2007)
Poly carbonate benzyl triethylammonium
29
Table 2.2 Previous studies for immobilization enzymes on PVA based
electrospun nanofibers
Author (Year) Types of
Enzymes Application Immobilization method Feng et al. (2014) Bovine liver catalase
Biocatalysist Metal chelation
Moreno et al. (2011) Lactate dehydrogenase Drug delivery Co-electrospinning Moradzadegan et al. (2010) Acetylcholines terase (AChE) Catalyst Co-electrospinning
Wang & Hsieh (2008) Lipase form C.rugosa Catalyst Co-electrospinning Sakai et al. (2008) Lipase - Co-electrospinning Ren et al. (2006) Glucose oxidase Biosensor Co-electrospinning Wu et al. (2005) Cellulase - Co-electrospinning
Xie & Hsieh (2003)
Casein lipase
30
Table 2.3 Previous studies for removal microbes from aqueous solution
using PVA electrospun nanofibers.
Author (year) Experiment al types Antimicrobial/ anti-biofouling agent Microorganism Efficiency Dobrow sky et al. (2015) Filtration SMI-Q-10, activated carbon
Bacteria & virus from surface and river water Above 2 LRV for bacteria, 0.12 LRV for virus Mi et al. (2014) Batch Quaternized chitosan (N-[(2- hydroxyl-3-trimethylammon ium) propyl] chitosan) Virus (PPV, Sindbis,) 3.3 LRV for PPV, 4.2 LRV for Sindbis Gule et al. (2013)
Filtration Furanone Bacteira (P.
aeruginosa, E. coli, S. aureus S. typhimurium, K. pneumonia) 2.2 -3.5 LRV Gule et al. (2012)
Filtration AquaQure Bacteria
(E. coli, S. aureus. S.tryphimurium, P. aeruginosa, K. pneumoniae) 5 LRV
31
Chapter 3
Preparation and Characterization of
Antimicrobial Electrospun Poly(vinyl
alcohol) Nanofibers Containing Benzyl
Triethylammonium chloride
Published. Park, JA; Kim, SB. 2015.
32
3.1 Materials and methods
3.1.1 Electrospinning of PVA nanofibers
PVA (M.W. = 85,000–124,000, 99 % hydrolyzed) were purchased from Sigma Aldrich. A PVA solution (8 wt%) was prepared by dissolving PVA powder in deionized water at 80 oC for 16 h and then cooling the solution at
room temperature. Electrospinning of the PVA nanofibers was performed at room temperature using an electrospinning system (ESP200/ESP100, NanoNC, Seoul, Korea). The as-prepared PVA solution was placed in a 25 mL syringe with a metal needle (inner diameter = 0.51 mm), which was connected to the positive terminal of a high-voltage power supply. The electrospun PVA nanofibers were collected on a rotating cylinder (diameter = 9 cm; speed = 1000 rpm) on a negative terminal wrapped with aluminum foil. The PVA nanofibers were then dried at 65 oC for 18 h.
In order to examine the effects of applied voltage and flow rate on the synthesis of PVA nanofibers, voltage was varied from 15 to 20 kV, whereas the flow rate of the spinning solution was changed from 0.5 to 2.0 mL h-1 using a
syringe pump (KDS 100, NanoNC, Seoul, Korea). Note that the tip-to-collector distance (TCD) was fixed at 15 cm during electrospinning. Prior to use in the antimicrobial tests, the PVA nanofibers were heat-treated for 20 min at 150 oC.
33
3.1.2 Electrospinning of BTEAC-PVA nanofibers
Prior to the electrospinning of the BTEAC-PVA nanofibers, minimum inhibitory concentration (MIC) tests were performed to determine the amount of BTEAC to be added to the PVA solutions (8 wt%). Three bacteria, S. aureus (ATCC 6538), K. pneumonia (ATCC 4352), and E. coli (ATCC 11105), were used in the MIC tests. In order to determine the suitable BTEAC concentration for bacterial growth inhibition, the BTEAC concentration was varied from 1.0 to 4.0 %. In the MIC tests, 5 mL of sterilized Luria-Bertani (LB) media solution containing BTEAC were inoculated with bacteria (0.1 mL) and then incubated for 24 h at 37 oC. Inhibition of bacterial growth was determined using a UV-vis
spectrophotometer (Thermo Scientific, Waltham, MA, USA) at a wavelength of 600 nm.
After determining the suitable BTEAC concentration, the BTEAC-PVA nanofibers were manufactured using the pre-functionalized method. Prior to the electrospinning of BTEAC-PVA nanofibers, BTEAC was added to the PVA solution in order to impregnate BTEAC into the PVA nanofibers during the electrospinning process. The electrospinning conditions for BTEAC-PVA nanofibers were as follows: applied voltage of 15 kV, flow rate of 1.0 mL h-1
and TCD of 15 cm. Prior to use in antimicrobial tests, the BTEAC-PVA nanofibers were heat-treated for 20 min at 150 oC.
34
3.1.3 Characterization of PVA and BTEAC-PVA nanofibers
The properties of the BTEAC-PVA solution were determined using various methods. The solution conductivity was measured by a conductivity meter (HC3010, Trans Instruments, Singapore). The viscosity was estimated using a Brookfield digital viscometer (Model DV-E, Brookfield Engineering Laboratories, Inc., Stoughton, MA, USA). The surface tension was determined by a Sigma Model 702 surface tension meter (KSV Instruments Ltd., Helsinki, Finland). The pH was measured with a pH probe (9107BN, Thermo Scientific, Waltham, MA, USA).
The characteristics of the electrospun nanofibers were determined by various techniques. The morphology of the nanofibers was examined by a field emission scanning electron microscope (FESEM, SUPRA 55VP, Carl Zeiss, Oberkochen, Germany). The average diameter of the nanofibers was determined by measuring fibers (n = 30) in each SEM image using ImageJ 1.43u software (National Institutes of Health, Bethesda, MD, USA). The energy dispersive X-ray spectrometry (EDS) analysis was also performed using the FESEM. Infrared spectra were obtained using a Nicolet 6700 (Thermo Scientific, Waltham, MA, USA) Fourier-transform infrared (FTIR) spectrometer at the range of 400–4000 cm-1. Thermogravimetric analysis (TGA)
was conducted on a TGA Q5000 IR (TA Instruments, New Castle, DE, USA) in a N2 atmosphere (flow rate = 100 mL min-1) under a heating rate of 10 oC
35
min-1 to measure the thermal stability of nanofibers. Weight loss (%) was
recorded over the temperature range of 0 to 600 oC.
3.1.4 Antibacterial tests
Antibacterial properties of electrospun nanofibers were evaluated by three established methods (agar diffusion method, intimate contact method, dynamic contact method) (Gao et al., 2014). In the first test (agar diffusion method), the circular PVA and BTEAC-PVA nanofibers (diameter = 5 mm) were arranged on the agar plates containing 1 mL (~107 colony forming unit (CFU)) of each
bacteria (E. coli, S. aureus, K. pneumonia) inoculums. The plates were incubated at 37 oC for 24 h.
Antibacterial properties of the BTEAC-PVA nanofibers were also examined against S. aureus and K. pneumonia using other two test methods. In the second test (intimate contact method), a modified version of the American Association of Textile Chemists and Colorists (AATCC) test method 100-2012 (AATCC, 2012) was used for the antibacterial test for PVA and BTEAC-PVA nanofibers. Aluminum foil was used as a control. The circular foil sample and nanofibers (diameter = 2.5 cm) were placed on a petri dish and sterilized under an ultraviolet radiation lamp for 30 min. A 0.25 mL volume of the test organisms (~ 105 CFU mL-1) was dropped onto the surface of the foil or nanofibers. The
36
contact times were varied from 0, 30, 60, and 120 min in order to assess the effect of contact time on antibacterial activity. After inoculation, the foil and nanofibers were placed into 25 mL neutralizing water in a conical tube. The mixture was vigorously shaken on a vortex (Vortex–2 Genie, Scientific Industries, New York, USA) for 1 min, and then 100 μL of the bacterial suspension was removed from the conical tube and diluted 101-, 102-, or 103
-fold. Finally, 100 μL each of the bacterial suspension and the diluted solutions were placed on a nutrient agar plate and incubated at 37 oC for 24 h. The
following equation was used to calculate the bacterial reduction rate (R) and log reduction:
% / 100; Log reduction log 1 (1)
where A is the number of bacteria recovered from the foil or nanofibers after incubation at the desired contact time, and B is the number of bacteria recovered at contact time zero.
In the third test (dynamic contact method), the foil, PVA nanofibers, and BTEAC-PVA nanofibers (diameter = 2.5 cm) were added to conical tubes containing 25 mL of bacteria (~105 CFU mL-1). The mixture was shaken at 100
rpm with a shaking incubator (IS-971R, Jeio Tech., Gimpo, Korea) for a contact time of 60, 120, and 300 min. Then, the number of bacteria present in the solution in the conical tube after the desired contact time (D) was determined
37
using the same procedures (serial dilution and spread plate method) used in the first test. In addition, the foil and nanofibers were removed from the conical tube after the desired contact time and immersed into another conical tube containing a phosphate buffer solution in order to detach bacteria on the surfaces of the foil and nanofibers. The mixture was vigorously vortexed for 1 min, and the number of bacteria detached from the foil and nanofibers (E) was determined following the same procedures described in the first test. The following equation was used to calculate the bacterial reduction rate (R):
% / 100 (2)
where C is the number of bacteria initially present in the conical tube before addition of the foil, PVA nanofibers, and BTEAC-PVA nanofibers.
3.1.5 Antiviral tests
Bacteriophages MS2 (ATCC 15597-B1) and PhiX174 (ATCC 13706-B1), obtained from the American Type Culture Collection, were used as an indicator of the human enteric virus (Leclerc et al., 2000). MS2 is an F-specific and unenveloped single-stranded RNA phage, whereas PhiX174 is a somatic and single-stranded DNA phage (Adams, 1959). MS2 and PhiX174 were grown on
Escherichia coli (ATCC 15597) and Escherichia coli C (ATCC 13706),
38
The antiviral properties of the BTEAC-PVA nanofibers were examined against MS2 and PhiX174 by following the same procedures as used in dynamic contact method of the antibacterial test. In the test, the foil, PVA nanofibers, and BTEAC-PVA nanofibers (diameter = 2.5 cm) were added to conical tubes containing 25 mL of bacteriophages (~105 plaque forming unit
(PFU) mL-1) in a 10 mM NaCl solution. The bacteriophages were enumerated
using the plaque assay method with the aforementioned hosts. The host culture (0.2 mL) and 0.1 mL of the diluted virus sample with 5 mL of soft agar were added to the tubes, and then the mixture was poured onto trypticase soy agar (TSA) plates to solidify. After solidifying, the plates were incubated at 37°C for 18 h. The reduction rate (R) of the bacteriophage was calculated using Equation (2).
39
3.2 Results and discussion
3.2.1 Electrospun PVA nanofibers
FESEM images of PVA nanofibers prepared at various electrospinning conditions (voltage and flow rate) are shown in Fig. 3.1. The optimal voltage and flow rate for electrospinning were 15 kV and 1.0 mL h-1, respectively. At a
voltage of 15 kV, beaded nanofibers appeared at flow rates of 0.5 (Fig. 3.1a) and 1.5 mL h-1 (Fig. 3.1c), whereas beaded nanofibers were rarely observed at
1.0 mL h-1 (Fig. 3.1b). At higher voltages of 17.5 and 20 kV (Figs. 3.1d-3.1j),
many beaded nanofibers appeared, regardless of the applied flow rate. At a low flow rate, beaded nanofibers occurred because the polymer solution could not overcome the surface tension. At a high flow rate, beaded nanofibers appeared because the polymer solution exceeded the fixed electric field. The diameter ranges of the PVA nanofiber prepared at a voltage of 15 kV and flow rate of 1.0 mL h-1 are shown in Fig. 3.2a. At this optimal electrospinning condition, the
average diameter of the PVA nanofibers was 181.0 ± 48.8 nm. The PVA nanofibers had diameters ranging from 100 to 350 nm, with the highest percent (50 %) having a diameter of 150–200 nm. Approximately 77 % of the PVA nanofibers had diameters less than 200 nm (Fig. 3.2a).
The average diameters of PVA nanofibers prepared at various electrospinning conditions (voltage and flow rate) are presented in Fig. 3.3. Our
40
results show that the average diameters of the nanofibers generally decreased with increasing applied voltage. The applied voltage is an important factor in electrospinning for controlling the surface charge on electrospinning solution (Sajeev et al., 2008). Some researchers reported that a high-voltage application increased electrostatic repulsion at the solution jet, resulting in formation of thinner nanofibers (Sajeev et al., 2008). Atabey et al. (2012) reported that the average diameter of PVA nanofibers decreased from 284 nm to 164 nm with increasing voltage from 20 to 25 kV. Lee et al. (2004) also observed that PVA nanofibers became thinner with increasing voltage from 10 to 25 kV. However, Supaphol & Chuangchote (2008) reported that the average diameter of PVA fibers decreased slightly with increasing applied voltage from 12.5 to 17.5 kV but increased at higher applied voltages of 17.5–25 kV.
41
Flow rate = 0.5 mL h
-11.0
mL
h
-11.5
mL
h
-12.0
mL
h
-1V
oltage = 15 kV
17.5 kV
20 kV
Figure 3.1. FESEM images of PVA nanofibers prepared at various electrospinning conditions (voltage and flow
rate).
42
Figure 3.2 Diameter ranges of nanofibers prepared at a voltage of 15
kV and flow rate of 1.0 mL h
-1(inset = FESEM image of nanofibers):
43
Figure 3.3 Average diameters of PVA nanofibers prepared at various
electrospinning conditions (voltage and flow rate).
0 50 100 150 200 15 17.5 20 Average diameter (nm) Applied voltage (kV) 0.5 ml/h 1 ml/h 1.5 ml/h 2 ml/h
44
3.2.2 Electrospun BTEAC-PVA nanofibers
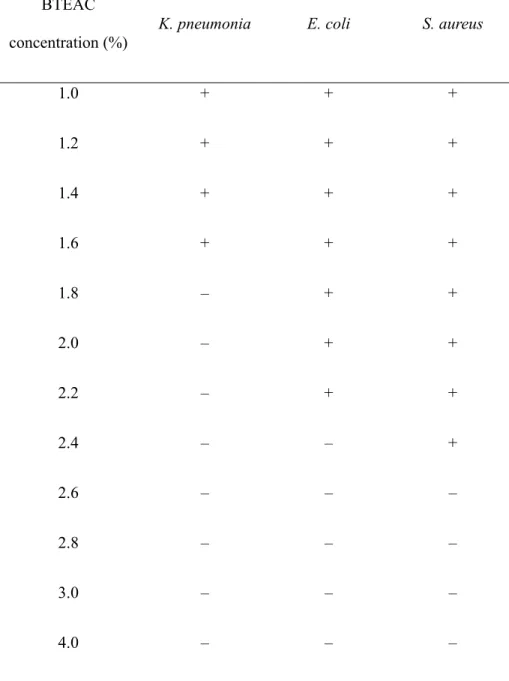
The results of the MIC tests under various concentrations of BTEAC are presented in Table 3.1. The growth of K. pneumonia was completely inhibited at the 1.8 % BTEAC concentration. In addition, the growth of E. coli was completely inhibited at 2.4 %, whereas the growth of S. aureus was inhibited at 2.6 %. Even though S. aureus was more resistant to BTEAC than K. pneumonia and E. coli, all bacteria were completely inhibited at 2.6 % of BTEAC. Therefore, antimicrobial BTEAC-PVA nanofibers were fabricated by adding 2.6 % BTEAC to the PVA solution. The diameter ranges of the 2.6 % BTEAC-PVA nanofibers are shown in Fig. 3.2b, along with the FESEM image of the BTEAC-PVA nanofibers. The average diameter of the BTEAC-PVA nanofibers was 464.7 ± 122.0 nm. The BTEAC-PVA nanofibers had diameters ranging from 200 to 700 nm, with the highest percentage (37 %) at 400–500 nm (Fig. 3.2b).
The electrospinning of nanofibers is closely related to the electrical conductivity, viscosity and surface tension of electrospinning solutions (Tan et al., 2005). In order to understand the effect of BTEAC-PVA solution characteristics on the diameter of the BTEAC-PVA nanofibers, the measured values of electrical conductivity, viscosity, surface tension, and pH of the BTEAC-added solutions, along with the diameter of the BTEAC-PVA
45
nanofibers, are compared in Table 3.2. The electrical conductivity of the BTEAC-added solutions increased from 1355 to 7270 µS cm-1 with increasing
BTEAC concentration from 0 to 2.6 %. The surface tension remained relatively constant between 65.8 and 69.0 mN m-1, whereas the viscosity fluctuated
between 524 and 680 cp. The pH of the BTEAC-added solutions decreased slightly from 5.9 to 5.6 with increasing BTEAC concentration from 0 to 2.6 %. The average diameter of the BTEAC-PVA nanofibers increased from 181.0 to 464.7 nm with increasing BTEAC concentration from 0 to 2.6 %. Our results showed that the average diameter of the BTEAC-PVA nanofibers was closely related to the electrical conductivity; the diameter of the BTEAC-PVA nanofibers increased with increasing electrical conductivity of the BTEAC-PVA solution.
Researchers reported that the electrical conductivity is an important factor affecting the diameter of electrospun nanofibers (Wang et al., 2008; Arumugam et al., 2009). In highly conductive solutions, a fiber collision phenomenon can occur, resulting in the formation of aggregated and fused fibers. The collision phenomenon also occurred in our electrospinning process for the BTEAC-PVA nanofibers (Fig. 3.4). A single fiber intersected four other fibers (Fig. 3.4a), and two or three single fibers agglomerated into a single thicker fiber (Fig. 3.4b). Arumugam et al. (2009) prepared BTEAC-PVA fibers, reporting that the addition of BTEAC to the PVA solution caused an increase in solution
46
conductivity. The diameter of the BTEAC-PVA fibers was greater than that of the PVA fibers due to fiber aggregation and fusion. Wang et al. (2008) also reported that the degree of fiber aggregation (self-bundling) was enhanced with increasing conductivity of the polymer solutions. Lundin et al. (2014) prepared antimicrobial Nylon and polycarbonate electrospun fibers using QACs (CTAB and C16EO1) as antimicrobial agents, reporting that the diameter of QAC-Nylon fibers was larger than that of the QAC-Nylon fibers, whereas the diameter of QAC-polycarbonate fibers was smaller than that of the polycarbonate fibers. They stated that the diameter of the electrospun fibers was dependent on polymer type and QAC concentration.
47
Table 3.1 Results of MIC tests using various concentrations of BTEAC
BTEAC concentration (%)
K. pneumonia E. coli S. aureus
1.0 + + + 1.2 + + + 1.4 + + + 1.6 + + + 1.8 – + + 2.0 – + + 2.2 – + + 2.4 – – + 2.6 – – – 2.8 – – – 3.0 – – – 4.0 – – –
48
Table 3.2 Properties of BTEAC-PVA solutions and average diameters of
the BTEAC-PVA nanofibers
BTEAC concentration in PVA solution (%) Electrical conductivity (μs cm-1) Viscosity (cp) Surface tension (mN m-1) pH Average diameter of nanofibers (nm) 0 1355 654 69.0 5.9 181.0 ± 48.8 0.2 2050 524 66.2 5.9 196.6 ± 31.7 0.3 2170 535 67.1 5.9 299.7 ± 90.8 0.4 2420 678 67.1 5.8 173.7 ± 31.4 0.5 2730 680 66.4 5.8 187.9 ± 35.4 1.0 3840 671 67.1 5.8 281.7 ± 103.8 1.2 4670 666 65.8 5.7 440.1 ± 82.2 2.6 7270 676 66.3 5.6 464.7 ± 122.0
49
Figure 3.4 FESEM images: (a) branched nanofibers; (b) fused
nanofibers.
50
3.2.3 FT-IR, TGA and EDS analyses
The FT-IR spectra and TGA thermograms of PVA and BTEAC-PVA nanofibers are compared in Fig. 3.6. In the FT-IR spectra of PVA nanofibers (Fig. 3.6a), the broad band at 3315 cm-1 corresponded to the stretching vibration
of the O-H groups. The peaks at 1654 cm-1 and 917 cm-1 also corresponded to
the O-H vibration. The peak at 2940 cm-1 was attributed to C-H stretching,
whereas the bands at 1420 cm-1 and 1329 cm-1 corresponded to C-H bending
(Gule et al., 2012; Linh et al., 2010). In addition, the peaks at 849, 1095 and 1143 cm-1 were assigned to C-C-O, C-O and C-C-C stretching, respectively.
The peak at 1236 cm-1 was attributed to C-C stretching (Sui et al., 2005; Li et
al., 2013; Siriwatcharapiboon et al., 2013). The FT-IR spectra of BTEAC-PVA nanofibers (Fig. 3.5a) showed the same major bands observed in PVA nanofibers. In addition, peaks at 756 and 707 cm-1 corresponding to the C-H
bond in the aromatic mono-substituted benzene ring of BTEAC were observed (Larkin et al., 2011), indicating that BTEAC was successfully trapped in the PVA polymer.
The TGA thermograms of PVA and BTEAC-PVA nanofibers (Fig. 3.5b) showed that the thermal decomposition of PVA and BTEAC-PVA nanofibers occurred in two similar steps. In the first step (30–100 oC), a small weight loss
51
In the second step (220–360 oC), a major weight loss occurred due to thermal
degradation of PVA. The TGA thermograms indicate that the thermal stability of PVA nanofibers does not change greatly in the presence of BTEAC.
The EDS pattern of BTEAC-PVA nanofibers (Fig. 3.5c) indicated that nitrogen (N) and chlorine (Cl) were appeared due to incorporation of BTEAC into PVA nanofibers, with the weight percents of N and Cl being 3.20 and 3.74%, respectively. In the EDS pattern, N was evident at the peak position of 0.392 keV as the K alpha X-ray signal, whereas Cl was evident at the peak positions of 2.622 and 2.815 keV as the K alpha and K beta X-ray signals, respectively.