R E S E A R C H
Open Access
Self-reported campus alcohol policy and
college alcohol consumption: a multilevel
analysis of 4592 Korean students from 82
colleges
Sarah Soyeon Oh
1,2, Yeong Jun Ju
1,3, Sung-in Jang
1,4and Eun-Cheol Park
1,4*Abstract
Background: Campus alcohol policy has been associated with student alcohol consumption in numerous studies. However, more information is required to assess the extent to which school policy affects student drinking behavior; especially when both individual-level sociodemographic characteristics of students and area-level characteristics of college campuses are controlled for. Thus, this paper explores the association between campus alcohol policy and student alcohol consumption among a nationally representative sample of college students in South Korea, while controlling for both individual and area-level characteristics.
Methods: We surveyed and analyzed the data of 4592 students from 82 colleges. Multilevel (hierarchical) linear modeling was used to identify the association between campus alcohol policy and alcohol consumption levels, measured via the AUDIT-C (Alcohol Use Disorders Identification Test– Consumption). Controlled individual-level characteristics included sex, year level, major, GPA (grade point average), pocket money, smoking status, stress level, depressive thoughts, suicidal thoughts, and number of clubs/organizations. Controlled area-level characteristics included college type, number of students, number of faculty members, number of workers/administrators, and region.
Results: Compared to students unaware of their school’s campus alcohol policy, students who self-reported that their campuses allow drinking in outdoor spaces (β = 0.755 p = 0.010) or in all areas (β = 0.820, p = 0.044) had higher AUDIT-C scores. Students attending schools with a large number of students, males, freshmen, students with low GPA, students with high amounts of pocket money, and smokers also had higher alcohol consumption scores relative to their peers. Alcohol education experience in the form of lectures, mail, and/or campaigns were not associated with student alcohol consumption levels.
Conclusion: Our results suggest an association between self-reported campus alcohol policy and student alcohol consumption. College educators and administrators must be aware that relative to students unaware of their school’s campus alcohol policy, students at colleges that allow drinking in outdoor spaces or all areas consume higher amounts of alcohol than their peers; even when area-level factors are controlled for.
Trial registration: Yonsei IRB (IRB number: Y-2017-0084).https://irb.yonsei.ac.krDate of registration: 01/2017. Date of enrolment of first participant to trial: 03/01/2017.Y-2017-0084.
Keywords: College drinking, College alcohol policy, Audit-c, Campus policy, Alcohol education
© The Author(s). 2020 Open Access This article is distributed under the terms of the Creative Commons Attribution 4.0 International License (http://creativecommons.org/licenses/by/4.0/), which permits unrestricted use, distribution, and reproduction in any medium, provided you give appropriate credit to the original author(s) and the source, provide a link to the Creative Commons license, and indicate if changes were made. The Creative Commons Public Domain Dedication waiver (http://creativecommons.org/publicdomain/zero/1.0/) applies to the data made available in this article, unless otherwise stated. * Correspondence:[email protected]
1
Institute of Health Services Research, Yonsei University, Seoul, Republic of Korea
4Department of Preventive Medicine, Yonsei University College of Medicine,
50 Yonsei-ro, Seodaemun-gu, Seoul 120-752, South Korea Full list of author information is available at the end of the article
Background
Alcohol use among college students is problematic globally, but little is known about the extent to which various measures, such as campus alcohol policy and education, deter excessive student drinking. In the context of South Korea, transition to college is often associated with an escalation in binge drinking; one investigation reported that approximately 71.2% of stu-dents consume at least four to five standard drinks per drinking session [1]. In the United States, although binge drinking rates have decreased over time, 30–40% of adults consume four to five standard drinks per drinking session [2], while in Europe, around 60% of men and 41% of women between the ages of 18 to 23 binge drink regularly [3]. Considering that there are numerous nega-tive consequences of college binge drinking including violence, date rape, accidents, and academic problems [4], more research on prevention efforts is necessary.
Rates of student alcohol use have been shown to vary be-tween schools; even when individual-level characteristics such as gender, race, and ethnicity [5] have been adjusted for. There are also multiple area-level characteristics such as peer drinking norms [6], wealth and entertainment of the neighborhood surrounding the campus [7], and alcohol outlet density [8, 9] that previous studies have associated with student drinking.
The National Institute on Alcohol Abuse and Alcohol-ism (NIAAA) has identified the following environmental-focused strategies for decreasing college binge drinking: 1) retaining the minimum legal drinking age (MLDA) of 21, 2) enforcing the MLDA, 3) increasing taxes on alcohol, 4) retaining a ban on Sunday alcohol sales, and 5) enacting bans on happy hours and other price promotions. Al-though such policies are enacted at the state or local level, when colleges partner with other organizations or coali-tions to implement or retain such policies, reduccoali-tions in risky alcohol use and related problems among students are possible [10].
Previous studies in the international literature have also shown that certain policy interventions influence student alcohol consumption. Whilst policies vary among institu-tions, emerging evidence indicates that policy-makers should target both individual and environmental strategies to reduce excessive alcohol consumption and binge drink-ing among students. Typical environmental policies in-clude campus alcohol bans, bans for minors, no alcohol use at college events, prohibition of beer kegs and alcohol displays on campus [11], and limitations on maximum number of drinks purchasable per student [12].
In one study, students attending schools with a ban on alcohol use were up to 30% less likely to engage in binge drinking [13]. Attending colleges that restrict high vol-ume sales or target underage drinking has been associ-ated with lower rates of alcohol-involved driving while
substance-free residence halls have been associated with reduced alcohol-related problems [14]. Regulating exces-sive alcohol use, through distance and access-based interventions that reduce the average distance between a college and outlet or the number of outlets in a county have also been effective in decreasing excessive alcohol consumption [15].
Banning alcohol advertisements and kegs on campus, and enforcing deterrence policies more strictly have been associated with decreased alcohol consumption [16]. Recent studies have also found that while campaigns to drink responsibly are ineffective for heavy drinkers, stra-tegic campaigns that promote responsible drinking may be effective among mild and moderate drinkers [17]. However, in 2008, Nelson and colleagues found that 23% of colleges in the United States were not employing any recommended strategies to reduce alcohol-related harm, while 45% were only employing a single recommended strategy such as 1) interventions challenging alcohol expect-ancies, 2) restrictions on alcohol retail outlet density, 3) enforcement of laws to prevent alcohol-impaired driving, and/or 4) responsible beverage service policies in social and commercial settings [18]. Overall, limited research has been done to assess the association between self-reported cam-pus alcohol policy and education experience on alcohol consumption among college students.
On the individual level, alcohol education programs, especially those directed towards individuals that typic-ally use alcohol at higher rates (e.g. members of Greek organizations and participants of athletic events) have shown to be effective in some studies [19]. Ultimately, according to a study of 734 college administrators, most institutions in the United States continue to offer some type of alcohol education program, despite their limited success, in combination with restrictive envir-onmental policies that reduce student access to alco-hol (e.g. limits on alcoalco-hol deliveries, and/or alcoalco-hol advertisements on campus) [11].
Although alcohol policies have been enacted to pre-vent and reduce harmful drinking of college students, limited research has been done to assess the association between type of campus alcohol policy and student alco-hol consumption from a multilevel model approach. Therefore, the present study focuses on examining the association between perceived college alcohol policy and student drinking, while controlling for both individual-level and college-individual-level characteristics.
Methods
Study sample and data
In the 2017 national statistics published by the Korean Educational Development Institute on college students, we found that 1,951,940 students (4-year: 1,506,745; lib-eral arts: 445,195) are enrolled in 356 colleges (4-year:
195, liberal arts: 161) in South Korea. Thus, we stratified a proportionately representative sample of undergraduate students from 54 4-year colleges and 28 liberal arts col-leges (Table 1). Students in these colleges were further stratified according to sex, year level, major, GPA, pocket money, smoking status, stress level, depressive thoughts, suicidal thoughts, and number of clubs/organizations.
In total, 5000 students completed the survey instru-ment. The response rate was 68.7%, with the total num-ber of approached participants being 7278. A financial incentive of 10,000 Korean Won (equivalent to around 9 U.S. Dollars) was given to each participant upon com-pletion of the 14-page survey instrument. Of these stu-dents, we excluded 10 students who had missing data for their major and GPA, and 211 students who had missing data for questions related to the AUDIT-C, for a final study sample of 4592 college students. More information regarding the survey have been published in previous studies [20,21].
Data was collected via face-to-face surveys with stu-dents. Questions were mainly about student drinking behavior, health, sociodemographic characteristics, and thoughts on campus-alcohol policy. Whenever possible, the instrument included alcohol-related questions that had been previously used in other international, national or large-scale epidemiological studies including the Har-vard College Alcohol Study [14], the Korea National Health and Nutrition Examination Survey (KNHANES) [22], and the Korea Youth Risk Behavior Web-Based Survey (KYRBS) [23]. College-level information such as number of students, faculty, and staff were found on the Korean Educational Development Institute website, which provides basic information about all registered colleges in the country.
A standard drink was defined as the amount of alcohol contained in one glass of alcohol drink (approximately 8 g of pure alcohol), equivalent to:1 shot of soju, 1 glass of bottled beer, 2/3 of a canned beer, 1/2 glass of draft beer, 1/2 bowl of makgeolli (rice wine), 1/2 glass of wine, 1 glass of whiskey, 1 shot of cheongju (refined rice wine),
1 shot of herbal liquor, 1 shot of fruit wine, or a 3/5 glass of mixed liquor (soju+beer), in accordance with the standards of the Korea Centers for Disease Control & Prevention.
Our survey instrument followed the guidelines of the In-stitutional Review Board of Yonsei University’s College of Medicine (Number: Y-2017-0084). All procedures were performed in accordance with the ethical standards of the Declaration of Helsinki. Informed consent was obtained from all individual participants included in the survey in written form. Data collectors were trained about the sur-vey’s ethical standards regarding privacy, anonymity, and confidentiality by our research team and collaborators from Gallup Korea. Each question of the questionnaire was required to be administered privately to students in a face-to-face manner at a quiet, enclosed space on campus such as a café or lecture room. The survey contained no identifying values that could link the information to the participant; making it completely impossible for re-searchers to identify specific participants.
Measures Outcome variable
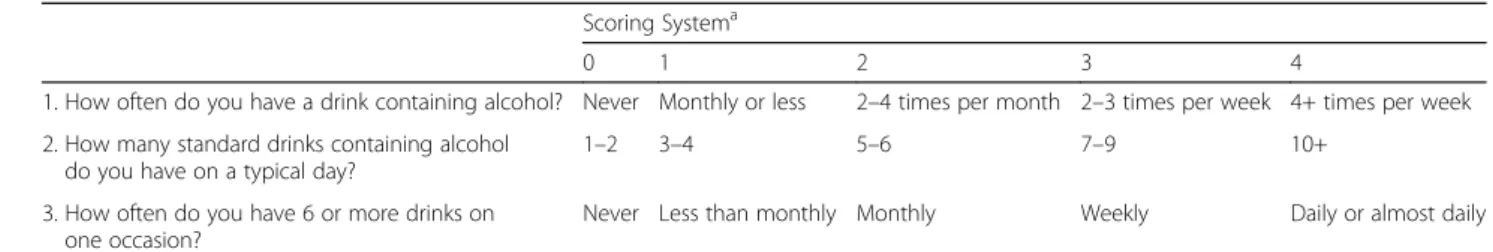
Alcohol intake, measured through the Alcohol Use Disor-ders Identification Test-Consumption (AUDIT-C), was selected as the outcome variable. The AUDIT-C is an abbreviated 3-item measure consisting of the first three questions from the full-length AUDIT questionnaire (Table 2). The AUDIT-C assesses alcohol consumption over the past year, and can help identify persons who are hazardous drinkers or have active alcohol use disorders (including alcohol abuse or dependence). Items are scaled (scale: 0–4) and summed to create a total score (scale: 0– 12). Higher AUDIT-C scores indicate greater alcohol con-sumption; generally, the higher the AUDIT score, the more likely the patient’s drinking is affecting his or her safety. Among Korean men, a score of 4 or more is con-sidered positive, optimal for identifying hazardous drink-ing or active alcohol use disorders, whilst a score of 3 or more is considered positive among Korean women [24]. Table 1 Stratification of a nationally representative sample of college students in South Korea
4-year Colleges 2-year Colleges Total
Population ratio (%) Students(colleges) Population ratio (%) Students(colleges) Students(colleges)
Seoul 12.6 630 (10) 4.2 210 (3) 840 (13) Incheon/Gyeonggi 9.4 471 (8) 8.1 403 (7) 874 (15) Gangwon 5.6 280 (5) 2.5 124 (2) 404 (7) Daejeon/Chungjeong 11 552 (9) 4.7 233 (4) 785 (13) Gwangju/Jeolla 8.5 426 (7) 4.9 245 (4) 671 (11) Daegu/Gyeongbuk 8.3 417 (7) 5.4 270 (4) 687 (11) Busan/Ulsan/Gyeongnam 9.8 488 (8) 5 251 (4) 739 (12) Total 65.3 3264 (54) 34.7 1736 (28) 5000 (82)
Perceived type of campus alcohol policy
Perceived type of campus alcohol policy was measured via individual answers to the question, “What is your university’s campus alcohol policy?” Response options were as follows: “Unaware of campus alcohol policy,” “bans all drinking on campus,” “bans minors (under 19) from drinking on campus,” “occasionally allows drinking on campus at certain locations/during events,” “allows drinking in outdoor spaces,” and “allows drinking in all areas.” Students could only select one answer, based on their knowledge of their school’s campus alcohol policy. Multiple choice options were unavailable.
Alcohol education experience (lecture/mail/campaign) Alcohol education experience was measured via individual answers to the question,“In the past 12 months, how many times have you encountered or taken part in the following alcohol prevention activities at you university?” Response options were as follows:“attended alcohol prevention pro-grams, lectures, or training,” “received a mail or brochure on alcohol prevention,” “saw posters or promotion mate-rials on alcohol prevention,” and “participated in a moder-ation campaign on campus.” Individuals were able to select their response on the following frequency scale: “never,” “once,” “twice,” “3 times,” “4 or more times.” The sum of these responses was re-categorized into a new variable: ‘al-cohol education experience’ and individuals were classified into the following categories: “none,” “1–2 times,” “3–4 times,” “more than 5 times.”
Statistical analysis
In order to examine the study participants’ general char-acteristics, chi-square tests were performed to compare differences between groups. To examine the association between perceived type of campus alcohol policy and al-cohol education experience with alal-cohol consumption, multilevel linear regression analysis was employed. Both area-level characteristics with respect to each college campus (college type, number of students, number of faculty members, number of workers/administrators, re-gion) and individual-level characteristics (sex, year level, major, GPA, pocket money, smoking status, stress level, depressive thoughts, suicidal thoughts, number of clubs/ organizations) were controlled for in the mixed model.
The beta values used in this model indicate the non-standardized regression coefficient, which signifies how much the mean of the dependent variable (AUDIT-C) changes given a one-unit shift in the independent variable (perceived type of campus alcohol policy / frequency of al-cohol education experience). Kendall’s tau-b correlation coefficient was used to measure the relationship between our variables of interest (perceived policy type, alcohol education experience frequency) and AUDIT-C.
The simultaneous relationship between type of campus alcohol policy and alcohol education experience fre-quency on AUDIT-C was determined through subgroup analyses, by running the linear regression analysis on the sample, when stratified by sex. The calculated p-values in this study were considered significant if lower than 0.05. All analyses were performed using SAS software, version 9.4 (SAS Institute, Cary, North Carolina, USA).
Results
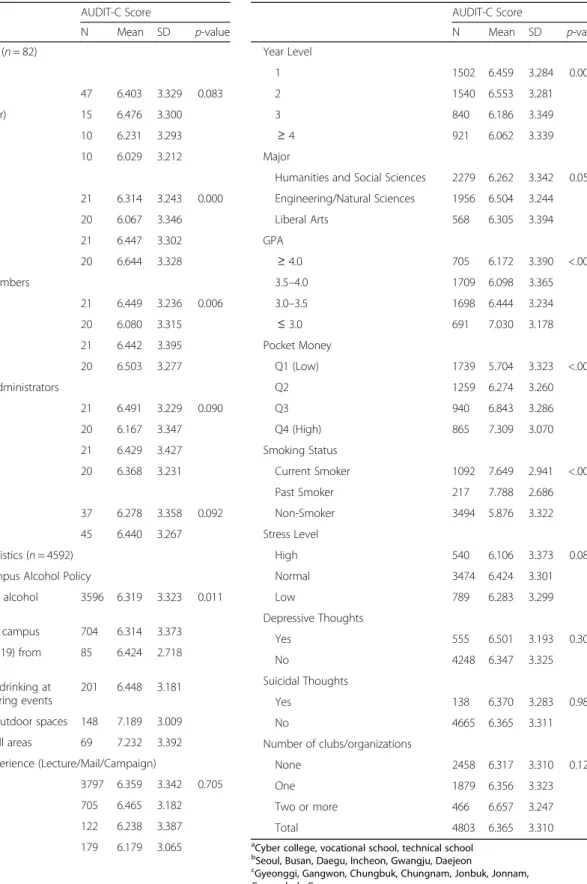
Table 3 shows the general characteristics of the study sample. Three thousand five hundred ninety-six stu-dents reported to being “unaware of campus alcohol policy,” followed by 704 students reporting to college “bans all drinking on campus,” 85 students reporting to college “bans minors from drinking on campus, 201 students reporting to college“occasionally allows drink-ing on campus at certain locations/durdrink-ing events, 148 students reporting to college “allows drinking in out-door spaces,” and 69 students reporting to college “allows drinking in all areas.” Students who perceived that their campuses allow drinking in outdoor spaces (7.189 ± 3.009) or all areas (7.232 ± 3.392) had the highest AUDIT-C scores.
Kendall’s correlations showed that AUDIT-C was posi-tively correlated with both perceived policy type (Ken-dall’s tau-b = 0.24, p < .0001) and education experience (Kendall’s tau-b = 0.02, p = 0.04). Kendall’s correlations also showed that AUDIT-C was positively correlated with both perceived policy type and education experi-ence. Considering that small correlation coefficients can be highly significant in large sample sizes and a Kendall correlation is equal to 2/π times the inverse sine of the Pearson correlation [25], these correlation coefficient values may represent significant associations.
Table 2 AUDIT-C Questionnaire
Scoring Systema
0 1 2 3 4
1. How often do you have a drink containing alcohol? Never Monthly or less 2–4 times per month 2–3 times per week 4+ times per week 2. How many standard drinks containing alcohol
do you have on a typical day?
1–2 3–4 5–6 7–9 10+
3. How often do you have 6 or more drinks on one occasion?
Never Less than monthly Monthly Weekly Daily or almost daily
a
Table 3 General characteristics of campus alcohol policy and alcohol consumption AUDIT-C Score N Mean SD p-value Area-level Characteristics (n = 82) College type College (four-year) 47 6.403 3.329 0.083 Technical (three-year) 15 6.476 3.300 Technical (two-year) 10 6.231 3.293 Othera 10 6.029 3.212 Number of Students Q1 (Low) 21 6.314 3.243 0.000 Q2 20 6.067 3.346 Q3 21 6.447 3.302 Q4 (High) 20 6.644 3.328
Number of Faculty Members
Q1 (Low) 21 6.449 3.236 0.006 Q2 20 6.080 3.315 Q3 21 6.442 3.395 Q4 (High) 20 6.503 3.277 Number of Workers/Administrators Q1 (Low) 21 6.491 3.229 0.090 Q2 20 6.167 3.347 Q3 21 6.429 3.427 Q4 (High) 20 6.368 3.231 Region Metropolisb 37 6.278 3.358 0.092 Town/Countryc 45 6.440 3.267 Individual-level Characteristics (n = 4592) Perceived Type of Campus Alcohol Policy
Unaware of campus alcohol policy
3596 6.319 3.323 0.011 Bans all drinking on campus 704 6.314 3.373 Bans minors (under 19) from
drinking on campus
85 6.424 2.718 Occasionally allows drinking at
certain locations/during events
201 6.448 3.181 Allows drinking in outdoor spaces 148 7.189 3.009 Allows drinking in all areas 69 7.232 3.392 Alcohol Education Experience (Lecture/Mail/Campaign)
None 3797 6.359 3.342 0.705
1–2 times 705 6.465 3.182
3–4 times 122 6.238 3.387
More than 5 times 179 6.179 3.065 Sex
Male 2356 6.764 3.222 <.0001
Female 2447 5.982 3.349
Table 3 General characteristics of campus alcohol policy and alcohol consumption (Continued)
AUDIT-C Score N Mean SD p-value Year Level 1 1502 6.459 3.284 0.001 2 1540 6.553 3.281 3 840 6.186 3.349 ≥ 4 921 6.062 3.339 Major
Humanities and Social Sciences 2279 6.262 3.342 0.054 Engineering/Natural Sciences 1956 6.504 3.244 Liberal Arts 568 6.305 3.394 GPA ≥ 4.0 705 6.172 3.390 <.0001 3.5–4.0 1709 6.098 3.365 3.0–3.5 1698 6.444 3.234 ≤ 3.0 691 7.030 3.178 Pocket Money Q1 (Low) 1739 5.704 3.323 <.0001 Q2 1259 6.274 3.260 Q3 940 6.843 3.286 Q4 (High) 865 7.309 3.070 Smoking Status Current Smoker 1092 7.649 2.941 <.0001 Past Smoker 217 7.788 2.686 Non-Smoker 3494 5.876 3.322 Stress Level High 540 6.106 3.373 0.085 Normal 3474 6.424 3.301 Low 789 6.283 3.299 Depressive Thoughts Yes 555 6.501 3.193 0.304 No 4248 6.347 3.325 Suicidal Thoughts Yes 138 6.370 3.283 0.987 No 4665 6.365 3.311 Number of clubs/organizations None 2458 6.317 3.310 0.126 One 1879 6.356 3.323 Two or more 466 6.657 3.247 Total 4803 6.365 3.310 a
Cyber college, vocational school, technical school
b
Seoul, Busan, Daegu, Incheon, Gwangju, Daejeon
c
Gyeonggi, Gangwon, Chungbuk, Chungnam, Jonbuk, Jonnam, Gyeongbuk, Gyeongnam
Table 4 shows the results of the multilevel regression analysis performed to investigate the association between various factors and AUDIT-C score among our study sample. Compared to students“unaware of campus alco-hol policy,” students whose campuses “allow drinking in outdoor spaces” (β = 0.755, p = 0.290) or “allow drinking in all areas” (β = 0.820, p = 0.044) on campus had higher AUDIT-C scores, even when area-level characteristics including college type, number of students, number of faculty members, number of workers/administrators, and college region were controlled for.
Alcohol education experience was not a predictor of reduced alcohol consumption. Females (β = − 0.269 p = 0.021) scored lower on the AUDIT-C than males as did seniors (β = − 0.614, p = 0.003 = 0) relative to freshmen. Students in the lowest GPA bracket (≤3.0) scored higher on the AUDIT-C than students in the highest GPA bracket (≥4.0). Past smokers (β = 1.543, p < .0001) and students who reported to currently smoking (β = 1.456 p < .0001) had higher AUDIT-C scores compared to those reporting to not smoking, as did students partici-pating in two or more clubs/organizations (β = 0.337, p = 0.055) relative to no clubs/organizations.
For males, allowing alcohol consumption in outdoor spaces (β = 1.1690, p = 0.0009) or in all areas (β = 1.0777, p = 0.0479) resulted in more alcohol consumption (Fig.1). For females, allowing alcohol consumption in all areas (β = 0.9834, p = 0.0486) resulted in more alcohol con-sumption. Receiving alcohol education 1–2 times, or 3–4 times were not associated with higher AUDIT-C, which was in alignment with the existing body of literature.
Discussion
Our results suggest an association between self-reported campus alcohol policy and student alcohol consumption. Relative to students unaware of campus alcohol policy, students who believe that their college allows drinking in outdoor spaces or all areas may consume higher amounts of alcohol than their peers. Such findings are in alignment with previous studies that have found that students drink more on school grounds when they per-ceive lax policy enforcement by college officials [26].
Interestingly, alcohol education experience, pertaining to alcohol prevention programs through lectures, mail, brochures, posters, promotion materials, or moderation campaigns, was not a significant predictor of decreased alcohol consumption among students in our investiga-tion, and only affected female students who had received alcohol education more than five times in their college years. Alcohol education programs have had mixed re-sults when it comes to college interventions: online and/ or offline alcohol education courses for college students have been both successful [27] and unsuccessful [16,28,
29] in mitigating alcohol-related high-risk behaviors
among student populations. What is clear is that while educational experiences may have no effect among all college students, among students who violate campus al-cohol policies and/or engage in high-risk drinking be-haviors, alcohol education or counseling is an effective measure in preventing alcohol misuse [30]. Furthermore, as emphasized by Kelly-Weeder and colleagues, integrat-ing educational interventions with environmental ap-proaches can increase program effectiveness [17].
Our findings also show specific socio-demographic groups that should be particularly targeted when estab-lishing campus alcohol policies: males, freshmen, students with low GPA, students receiving high amounts of pocket money, current and past smokers, and students in two or more clubs/organizations. Findings from major college alcohol investigations including the Harvard College Alco-hol Study have already noted these vulnerable populations; as seen in the 1993, 1997, 1999, and 2001 Harvard College Alcohol Study, males, students under the age of 21, stu-dents with academic problems related to alcohol such as missing class and/or getting behind in school work [13], and smokers have all been associated with consuming more amounts of alcohol than other subpopulations [4]. Likewise, previous studies have found that students who are more active in school activities such as clubs/organiza-tions [31] or university athletics drink more, and find alco-hol problematic on campus [15].
A difference between previous studies and our study is that in the context of year level, students in South Korea have the highest AUDIT-C scores in their freshman year, whereas students in international studies mostly consume high amounts of alcohol during their sophomore and jun-ior years [3,13,32,33]. This phenomenon may be particu-lar to South Korea; students in South Korea have been noted to consume the most amount of alcohol in their freshman year (often, unwillingly) at various orientation, and/or freshmen events where juniors and seniors pres-sure incoming students to drink [1]. Similar trends were also found among some Asian countries like China [32] and Taiwan [34], where alcohol use was greatest among 1st year students. However, in most European countries like France [33], Belgium, Colombia, Ireland, and Poland [3, 4] age and/or year of study were not associated with binge drinking and associated drinking behaviors.
Our study has a number of limitations. First, our study is cross-sectional in design and therefore, it is difficult to make causal inferences about the effect of campus alco-hol policy type or education experience on alcoalco-hol con-sumption. The data is based on self-reported answers, and the question about campus alcohol policy may be ambiguous as only single choice answers were possible. Furthermore, the group size is too small to meaningfully interpret trends, especially because being ‘unaware’ of campus alcohol policy does not mean full prohibition or
liberalization. Future investigations should attempt to overcome these limitations through the survey instru-ment and design.
Table 4 Results of the multilevel regression analysis analyzing campus policy and alcohol consumption
AUDIT-C Score
β S.E p-value
Intercept 5.020 0.307 <.0001
Area-level Characteristics (n = 82) College type
College (four-year) Ref.
Technical (three-year) −0.127 0.400 0.876 Technical (two-year) −0.294 0.440 0.137 Othera −0.466 0.400 0.088 Number of Students Q1 (Low) Ref. Q2 −0.009 0.347 0.516 Q3 0.506 0.439 0.011 Q4 (High) 0.955 0.552 0.003
Number of Faculty Members
Q1 (Low) Ref. Q2 −0.185 0.502 0.118 Q3 −0.007 0.703 0.761 Q4 (High) −0.031 0.874 0.593 Number of Workers/Administrators Q1 (Low) Ref. Q2 −0.489 0.471 0.036 Q3 −0.281 0.608 0.385 Q4 (High) −0.920 0.669 0.008 Region Metropolisb Ref. Town/Countryc 0.331 0.216 0.048 Individual-level Characteristics (n = 4592) Perceived Type of Campus Alcohol Policy
Unaware of campus alcohol policy Ref.
Bans all drinking on campus 0.123 0.174 0.481 Bans minors (under 19) from
drinking on campus
0.237 0.361 0.512 Occasionally allows drinking at
certain locations/during events
0.150 0.260 0.565 Allows drinking in outdoor spaces 0.755 0.290 0.010 Allows drinking in all areas 0.820 0.405 0.044 Alcohol Education Experience (Lecture/Mail/Campaign)
None Ref.
1–2 times 0.003 0.147 0.986
3–4 times −0.113 0.300 0.708
More than 5 times −0.286 0.255 0.265
Sex
Male Ref.
Female −0.269 0.114 0.021
Table 4 Results of the multilevel regression analysis analyzing campus policy and alcohol consumption (Continued)
AUDIT-C Score β S.E p-value Year Level 1 Ref. 2 −0.068 0.130 0.603 3 −0.512 0.156 0.001 ≥ 4 −0.614 0.158 0.000 Major
Humanities and Social Sciences Ref.
Engineering/Natural Sciences 0.068 0.125 0.587 Liberal Arts −0.097 0.173 0.573 GPA ≥ 4.0 Ref. 3.5–4.0 −0.032 0.149 0.831 3.0–3.5 0.242 0.151 0.109 ≤ 3.0 0.468 0.178 0.009 Pocket Money Q1 (Low) Ref. Q2 0.677 0.126 <.0001 Q3 1.174 0.140 <.0001 Q4 (High) 1.534 0.144 <.0001 Smoking Status Current Smoker 1.456 0.131 <.0001 Past Smoker 1.543 0.226 <.0001 Non-Smoker Ref. Stress Level High Ref. Normal 0.296 0.155 0.058 Low 0.176 0.189 0.353 Depressive Thoughts Yes 0.197 0.166 0.239 No Ref. Suicidal Thoughts Yes −0.216 0.296 0.470 No Ref. Number of clubs/organizations None Ref. One 0.073 0.112 0.515 Two or more 0.337 0.175 0.055 a
Cyber college, vocational school, technical school
b
Seoul, Busan, Daegu, Incheon, Gwangju, Daejeon
c
Gyeonggi, Gangwon, Chungbuk, Chungnam, Jonbuk, Jonnam, Gyeongbuk, Gyeongnam
Second, there are not enough previous studies with regard to a nationally representative sample of Ko-reans when it comes to measuring type of campus alcohol policy/education experience and its effect on drinking behavior of college students. It is difficult to see whether the values we calculated are similar to that of the statistics found in previous studies, es-pecially for the college students’ age group. Similarly, all alcohol education experiences ranging from lec-tures, to campaigns were given equal weights in our analysis because our survey instrument measured these experiences together. However, certain activ-ities may have a greater impact on drinking behavior than others. Future studies should take this factor into account and attempt to give weights to these experiences or measure them separately as individual effects.
Furthermore, various sampling biases may have emerged from our surveying methods; because college students in South Korea drink large amounts of alco-hol relative to adults, different patterns are likely to emerge in adult populations. Likewise, a small num-ber of Christian colleges that were originally in our sample declined our request for participation because of their teetotalism principles and thus, had to be re-placed with non-Christian colleges. Because of the face-to-face method that we employed for accuracy of obtaining responses to complicated questions, there may have been response biases, relative to social de-sirability. The majority of questions in our survey in-strument required students to think about their drinking behaviors in the last 12 months or so, which likely resulted in recall bias.
Finally, although we included numerous lifestyle co-variates as potential confounders, the limited nature and number of questions in our instrument, as well as information publicly available regarding each col-lege campus, made it difficult for other confounding variables, relative to health, socio-demographics, gene-environment, gene-environment, and lifestyle, to be mea-sured and controlled for.
Despite these limitations, our study also has several strengths. Few studies have measured the effect of en-vironmental and educational campus alcohol policies on drinking behavior for a nationally representative sample of college students in South Korea, especially with a multi-level statistical model which controls for macro-related characteristics. Our findings not only show which sub-groups are at higher risk of consum-ing dangerous amounts of alcohol, but show that al-cohol education experience is effective only when done frequently, and in combination with environ-mental deterrence policies among certain subgroups (females).
Conclusion
In conclusion, this study emphasizes the importance of prohibiting alcohol consumption in open, public college spaces, if only to prevent high-risk students from per-ceiving that college alcohol policies are lax. While alco-hol policies and educational programs may be limited in impacting the drinking behaviors of all college students, it is undeniable that college alcohol policy is associated with student drinking behavior. It is especially important for schools to have non-judgmental and supportive mechanisms that help students with alcohol-related Fig. 1 Subgroup analysis of the association between perceived alcohol policy and education experience by sex
problems and/or AUDs (Alcohol Use Disorders) [35]. According to Blanco and colleagues, roughly 20% of col-lege students meet the criteria for an AUD [6]. Thus, college educators and administrators should be aware that relative to students unaware of their school’s cam-pus alcohol policy, students who believe that their col-lege allows drinking in outdoor spaces or all areas may consume higher amounts of alcohol than their peers. Abbreviations
AUD:Alcohol Use Disorder; AUDIT-C: Alcohol Use Disorders Identification Test– Consumption; GPA: Grade Point Average; KNHANES: Korea National Health and Nutrition Examination Survey; KYRBS: Korea Youth Risk Behavior Web-based Survey; NIAAA: National Institute on Alcohol Abuse and Alcoholism
Acknowledgements
We would like to acknowledge the Korea Centers for Disease Control & Prevention for providing funding for this investigation.
Authors’ contributions
SSO and YJJ made substantial contributions to analysis and interpretation of the data. SSO was involved in drafting the manuscript and revising it critically for important intellectual content. SIJ was in charge of revising the manuscript and giving final approval of the version to be published. EC Park conceived, designed, and directed this study. All authors participated sufficiently in the work and take public responsibility for appropriate portions of the content. All authors read and approved the final manuscript. Funding
This research was funded by the Korea Centers for Disease Control & Prevention; grant number 11180165.
Availability of data and materials Data will be made available upon request. Ethics approval and consent to participate
Our survey instrument followed the guidelines of the Institutional Review Board of Yonsei University’s College of Medicine (Yonsei IRB No. Y-2017-0084), registered on January 3rd, 2017. The trial registry can be accessed at
https://irb.yonsei.ac.kr/upon request. All procedures were performed in ac-cordance with the ethical standards of the Declaration of Helsinki. Informed consent was obtained from all individual participants included in the survey in written form.
Consent for publication
All authors give consent for publication. Competing interests
The authors declare that they have no competing interests. Author details
1Institute of Health Services Research, Yonsei University, Seoul, Republic of
Korea.2Department of Public Health, Graduate School, Yonsei University,
Seoul, Republic of Korea.3Department of Preventive Medicine, Ajou University College of Medicine, Gyeonggi, Suwon, Republic of Korea.
4Department of Preventive Medicine, Yonsei University College of Medicine,
50 Yonsei-ro, Seodaemun-gu, Seoul 120-752, South Korea.
Received: 8 July 2019 Accepted: 20 January 2020
References
1. Jegal J. College Students' Binge Drinking.The Korea Public Health Association. 2011;2011:42–42.
2. Krieger H, Young CM, Anthenien AM, Neighbors C. The epidemiology of binge drinking among college-age individuals in the United States. Alcohol Res. 2018;39(1):23–30.
3. Van Hal G, Tavolacci MP, Stock C, Vriesacker B, Orosova O, Kalina O, et al. European University Students’ experiences and attitudes toward campus alcohol policy: a qualitative study. Subst Use Misuse. 2018;53(9):1539–48. 4. Plant MA, Plant ML, Miller P, Gmel G, Kuntsche S. The social consequences
of binge drinking: a comparison of Young adults in six European countries. J Addict Dis. 2009;28(4):294–308.
5. Bedendo A, Andrade ALM, Noto AR. Gender Differences and Effectiveness of an Online Intervention for Alcohol Use among College Drinkers: Four-Arm Pragmatic Randomized Controlled Trial. Alcohol Clin Exp Res. 2017;41:174a -a.
6. Blanco C, Okuda M, Wright C, Hasin DS, Grant BF, Liu S-M, et al. Mental health of college students and their non-college-attending peers: results from the National Epidemiologic Study on alcohol and related conditions. Arch Gen Psychiatry. 2008;65(12):1429–37.
7. Cronce JM, Toomey TL, Lenk K, Nelson TF, Kilmer JR, Larimer ME. NIAAA’s college alcohol intervention matrix. Alcohol Res. 2018;39(1):43–7. 8. Sacks JJ, Brewer RD, Mesnick J, Holt JB, Zhang X, Kanny D, et al. Measuring
alcohol outlet density: an overview of strategies for public health practitioners. J Public Health Manag Pract: JPHMP. 2019;10.1097. 9. Bellis AL. Alcohol outlet density, heavy episodic drinking, and sexual
violence perpetration: a multilevel mediation model; 2017.
10. Arria AM, Jernigan DH. Addressing college drinking as a statewide public health problem: key findings from the Maryland collaborative. Health Promot Pract. 2018;19(2):303–13.
11. Kessler TA, Kurtz CP. Influencing the binge-drinking culture on a college campus. Nurse Educ. 2019;44(2):106–11.
12. Yang B, Zhao X. TV, social media, and college students’ binge drinking intentions: moderated mediation models. J Health Commun. 2018;23(1):61–71. 13. Wechsler H, Lee JE, Kuo M, Seibring M, Nelson TF, Lee H. Trends in college
binge drinking during a period of increased prevention efforts: Findings from 4 Harvard School of Public Health College Alcohol Study Surveys: 1993–2001. (vol 50, pg 203, 2002). J Am Coll Health. 2002;51(1):37. 14. Wechsler H, Nelson TF. What we have learned from the Harvard School of
Public Health College alcohol study: focusing attention on college student alcohol consumption and the environmental conditions that promote it. J Stud Alcohol Drugs. 2008;69(4):481–90.
15. Wells S, Graham K, Speechley M, Koval JJ. Drinking patterns, drinking contexts and alcohol-related aggression among late adolescent and young adult drinkers. Addiction. 2005;100(7):933–44.
16. Geshi M, Hirokawe K, Taniguchi T, Fujii Y, Kawakami N. Effects of alcohol-related health education on alcohol and drinking behavior awareness among Japanese junior college students: a randomized controlled trial. Acta Med Okayama. 2007;61(6):345–54.
17. Kelly-Weeder S, Phillips K, Rounseville S. Effectiveness of public health programs for decreasing alcohol consumption. Patient Intell. 2011;2011(3):29–38. 18. Nelson TF, Toomey TL, Lenk KM, Erickson DJ, Winters KC. Implementation of
NIAAA college drinking task force recommendations: how are colleges doing 6 years later? Alcohol Clin Exp Res. 2010;34(10):1687–93. 19. McCabe SE, Veliz P, Schulenberg JE. How collegiate fraternity and sorority
involvement relates to substance use during Young adulthood and substance use disorders in early midlife: a National Longitudinal Study. J Adolesc Health. 2018;62(3):S35–43.
20. Oh SS, Ju YJ, Lee S, Park E-C. Primary reason for drinking among current, former, and never Flushing college students. Int J Environ Res Public Health. 2019;16(2):211.
21. Oh SS, Ju YJ, Park E-C, Jang S-I. Alcohol mixed with energy drinks (AmED) and negative alcohol-related consequences among south Korean college students. Int J Environ Res Public Health. 2019;16(7):1127.
22. Kweon S, Kim Y. Jang M-j, Kim Y, Kim K, Choi S, et al. data resource profile: the Korea national health and nutrition examination survey (KNHANES). Int J Epidemiol. 2014;43(1):69–77.
23. Kim Y, Choi S, Chun C, Park S, Khang Y-H, Oh K. Data resource profile: the Korea youth risk behavior web-based survey (KYRBS). Int J Epidemiol. 2016; 45(4):1076-e.
24. Lee KW, Choi YH, Lee JH. Cut-off points for screening at-risk drinking by AUDIT-C Korean version at emergency department. Turk J Emerg Med. 2018;18(2):57–61. 25. Aggarwal R, Ranganathan P. Common pitfalls in statistical analysis: the use
of correlation techniques. Perspect Clin Res. 2016;7(4):187–90. 26. Toomey TL, Miazga MJ, Lenk KM, Erickson DJ, Winters KC, Nelson TF.
Enforcing alcohol policies on college campuses: reports from college enforcement officials. J Drug Educ. 2011;41(3):327–44.
27. Paschall MJ, Ringwalt C, Wyatt T, DeJong W. Effects of an online alcohol education course among college freshmen: an investigation of potential mediators. J Health Commun. 2014;19(4):392–412.
28. Croom K, Lewis D, Marchell T, Lesser ML, Reyna VF, Kubicki-Bedford L, et al. Impact of an online alcohol education course on behavior and harm for incoming first-year college students: short-term evaluation of a randomized trial. J Am Coll Heal. 2009;57(4):445–54.
29. Sharmer L. Evaluation of alcohol education programs on attitude, knowledge, and self-reported behavior of college students. Eval Health Prof. 2001;24(3):336–57.
30. Carey KB, Scott-Sheldon LA, Garey L, Elliott JC, Carey MP. Alcohol interventions for mandated college students: a meta-analytic review. J Consult Clin Psychol. 2016;84(7):619.
31. Dantzer C, Wardle J, Fuller R, Pampalone SZ, Steptoe A. International study of heavy drinking: attitudes and sociodemographic factors in university students. J Am Coll Heal. 2006;55(2):83–90.
32. Sun L, Windle M, Thompson NJ. Perceived peer norms and alcohol use among college students in China. Addict Behav. 2018;87:144–50. 33. Tavolacci M-P, Boerg E, Richard L, Meyrignac G, Dechelotte P, Ladner J.
Prevalence of binge drinking and associated behaviours among 3286 college students in France. BMC Public Health. 2016;16(1):178. 34. Fu A-T, Ko H-C, Wu JY-W, Cherng B-L, Cheng C-P. Impulsivity and
expectancy in risk for alcohol use: comparing male and female college students in Taiwan. Addict Behav. 2007;32(9):1887–96.
35. Wu L-T, Pilowsky DJ, Schlenger WE, Hasin D. Alcohol use disorders and the use of treatment services among college-age young adults. Psychiatr Serv. 2007;58(2):192–200.
Publisher’s Note
Springer Nature remains neutral with regard to jurisdictional claims in published maps and institutional affiliations.