ICCAS2005 June 2-5, KINTEX, Gyeonggi-Do, Korea
MATHEMATICAL PHASE NOISE MODEL
FOR A PHASE-LOCKED-LOOP
Sethapong Limkumnerd*, and Duangrat Eungdamrong**
*Sirindhorn International Institute of Technology, Thammasat University, Pathumthani, 12121, Thailand (Tel: +66(0)2-501-3505 20(Ext.1813); Fax: +66(0)2-501-3504; Email:[email protected]) **Sirindhorn International Institute of Technology, Thammasat University, Pathumthani, 12121, Thailand
(Tel: +66(0)2-501-3505 20(Ext.1804); Fax: +66(0)2-501-3504; Email:[email protected])
Abstract: Phase noise in a phase-locked-loop (PLL) is unwanted and unavoidable. It is a main concern in oscillation system
especially PLL. The phase noise is derived in term of power spectrum density by using a reliable phase noise model. There are four noise sources being considered in this paper, which are generated by reference oscillator, voltage controlled oscillator, filter, and main divider. The major concern for this paper is the noise from the filter. Two types of second order low pass filter are used in the PLL system. Applying the mathematical phase noise model, the output noises are compared. The total noise from the passive filter is lower than the active filter at the offset frequency range between 1 Hz to 33 kHz.
Keywords: Phase-locked-loop, Phase noise, voltage control oscillator, phase detector, loop filter, main divider.
1. INTRODUCTION
Nowadays, the exponential growth in wireless communication has increased the demand for more available channels in mobile communication application. This demand imposes more stringent requirements on mobile communication equipment. A better receiving terminal of wireless communication system can be improved by reducing phase noise in the phase-locked-loop (PLL).
Phase-locked-loop (PLL) is a closed loop control system that uses negative feedback to maintain constant (locked) output frequency and phase to the frequency and phase of input. The main elements of this PLL, are voltage control oscillator (VCO), phase detector (PD), loop filter and main divider. The PLL has achieved “lock” when the difference between the output of VCO and the reference signal is zero [1].
The purpose of this paper is to reduce the total noise of the PLL which is generated from four main parts, reference oscillator, loop filter, voltage control oscillator and main divider.
Fig. 1 Phase-locked-loop bock diagram
Section II presents the noise models in the mathematical form for each component. The models are based on Drucker [2]. In section III, we will discuss the result of MATLAB simulation. Finally, the conclusion is described in the last section.
2. NOISE MODEL
The prototype of phase noise spectrum density is described in frequency domain as a decaying nonlinear graph, which can be classified into several regions depending on its slope. The slope deviates from 0 to -40 dB/dec or less. The graph is depicted in Fig. 2.
Fig. 2 Prototype of phase noise spectrum density This prototype allows us to construct an equation to represent the phase noise model. According to Eq. (1), the first term (ko) represents thermal noise which acquires 0 dB/dec
slope region. The second term (k1/f) is flicker noise which
represents –10 dB/dec slope region and so on [2].
( )
1 2 3 4 0 2 3 4 k k k k S f k f f f f φ = + + + + (1)Each model of noise source may contain different regions of slope; therefore, its characteristic is different.
VCO noise model:
( )
2 _ 3 _ _ 0 _ 2 3 VCO VCO VCO VCO k k S f k f f φ = + + (2)Divider noise model:
( )
1_ _ 0 _ md md md k S f k f φ = + (3)Reference oscillator noise model:
( )
1_ 2 _ 3 __ 0 _ 2 3
ref ref ref
ref ref k k k S f k f f f φ = + + + (4)
233
We can combine the divider noise and reference oscillator noise as:
( )
2( )
_( )
_ _ 2 ref mult md S f S f N S f R φ φ φ ⎡ ⎤ = ⎢ + ⎥ ⎣ ⎦ (5)2.1 Filter noise model
In this paper, two types of filter are considered, a second order active low pass filter and a second order passive low pass filter, as shown in Fig. 3 and 4 consequently. The low pass filter amplifies the signal while filters out the high frequency which exceeds the PLL’s bandwidth. Noise generated by the resistor and op-amp are considered.
A second order active low pass filter is created from resistor, capacitors and op-amp, as shown in Fig 3. Therefore, the noise sources of the active filter are op-amp and resistor.
Fig. 3 Circuit of second order active low pass filter [2] 2.1.1 Resistor noise
Resistor noise in resistor is due to random motion of electrons in the resistor. The noise model for a resistor is assumed to be white noise defined in Eq. (6). It shows power dissipated in the resistor. This kind of noise is called thermal noise which apparently should be taken into account since there are resistors presented in loop filter [3].
( ) 4 r P R = kTBR (6) where Pr = Thermal noise k = Boltzmann’s constant T = Absolute temperature (K) B = Bandwidth of the filter (Hz) R = Resistor (Ω)
Thus, noise model of the resistor is described as
_R( ) 0 _R 4
Sφ f =k = kTBR (7)
2.1.2 Operational amplifier noise
Op-amp noise is derived by the experimentally or given by the manufacturer. There are two types of noise in op-amp, flicker noise and thermal noise. Therefore, only k0 _op amp- and
1_op amp
-k are present in the op-amp noise. The constant k for op-amp can derive using the data sheet [4].
1_ -_ - ( ) 0 _ -op amp op amp op amp k S f k f φ = + (8)
The close-loop transfer function of second order active low pass filters stated as follows.
(
)
2 2 2 2 3 1 2 3 2 3 1 (1 ) out in V sR C sR C C V sR C C C C + = + + + (9)A second order passive low-pass filter is created from resistor and capacitors; therefore op-amp noise is not included in the noise model of the filter.
Second order passive low-pass filter noise model:
_ 2nd_passive fil_ ( ) _R( )
Sφ f =Sφ f (10)
Fig. 4 Circuit of second order passive low pass filter The close-loop transfer function of second order active low pass filters stated as follows.
(
)
2 2 2 2 3 2 3 2 3 1 (1 ) out in V sR C sR C C I s C C C C + = + + + (11)2.2 Phase noise model from the loop
Noise model for each source is derived by multiplying the input power spectrum density with magnitude square of closed-loop transfer function,θ( )jf , which is defined as (forward loop/1+open loop) in which the position of the input varies depending on investigating noise. It determines the ability of the system to terminate phase noise. By investigating phase noise in term of spectrum density, the output of phase noise is stated as follows [5].
2 _out( ) _source( ) ( )
Sφ f =Sφ f ×θ jf (12)
where
( )jf
θ = closed-loop transfer function of each noise source
_out( )
Sφ f = output phase spectrum density
_source( )
Sφ f = input phase spectrum density
From Fig. 1, the closed loop transfer function of each component can be determined as follows
The loop gain GH(s) is
1 ( ) ( ) KV KP F s GH s s N ⋅ ⋅ ⎡ ⎤ = ⎢⎣ ⎥⎦ (13)
where F(s) = filter transfer function
The closed loop transfer function for VCO is _ ( ) 1 1 ( ) CL VCO s GH s Θ = + (14)
The VCO noise modified by the loop
2 _
_ _ ( ) _ ( ) CL vco( )
S vco out f =S vco f ⋅ Θ jf (15)
The closed loop transfer function for multiplied main divider and reference oscillator noise is
_ ( ) ( ) 1 ( ) CL mult GH s s GH s Θ = + (16)
The multiplied main divider and reference oscillator noise modified by the loop
2 _
_ _ ( ) _ ( ) CL mult( )
S mul out f =S mul f ⋅ Θ jf (17)
2.2.1 Second order active low pass filter noise model
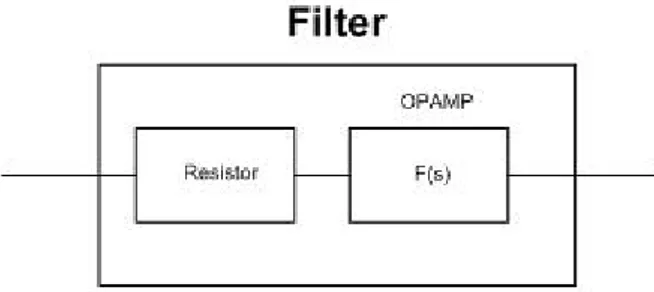
A second order active low pass filter is created from resistor, capacitors and op-amp, as shown in Fig. 3. Therefore, the main noise sources of the active filter are op-amp and resistor as shown in Fig. 5. The transfer function of resistor and op-amp are difference.
Fig. 5 Block diagram of active low pass filter noise model The closed loop transfer function for resistor is
_ _ / ( ) ( ) 1 ( ) CL fil R Kv S s F s GH s Θ = ⋅ + (18)
The closed loop transfer function for op-amp is
_ _ / ( ) 1 ( ) CL fil OP Kv S s GH s Θ = + (19)
The phase noise that is generated from resistor is
2 _ _
_ _ ( ) R( ) CL fil R( )
S R out f =Sφ f ⋅ Θ jf (20)
The phase noise that is generated from op-amp is
2
_ _ _
_ _ ( ) op amp( ) CL fil OP( )
S OP out f =Sφ − f ⋅ Θ jf (21)
The active low pass filter noise modified by the loop
_ _ ( ) _ _ ( ) _ _ ( )
S fil out f =S R out f +S OP out f (22)
2.2.2 Second order passive low pass filter noise model A second order passive low pass filter is created from resistor and capacitors, as shown in Fig.4. Therefore, the noise source of the passive filter is only resistor.
The closed loop transfer function for passive low pass filter is
_ / ( ) 1 ( ) CL fil Kv S s GH s Θ = + (23)
The passive low pass filter noise modified by the loop
2 _
_ _ ( ) _ ( ) CL fil( )
S fil out f =S fil f ⋅ Θ jf (24)
The total noise is calculated by
_ ( ) _ _ ( ) _ _ ( ) _ _ ( )
S total f =S mul out f +S fil out f +S vco out f
(25) Applying the phase noise model in MATLAB, the simulation results are obtained and compared in the next section.
3. DISCUSSION
The noise modified by closed-loop transfer function is simulated using MATLAB. Filter noises are plotted in Fig. 6 while the total noises of PLL are plotted in Fig. 7.
Fig. 6 Compared filter noise
(a) Filter noise using second order active low pass filter
(b) Filter noise using second order passive low pass filter
k0_VCO =10-15.5, k2_VCO =10-3, k3_VCO =100.7,
k0_md =10-15.5, k1_md =10-12.5, k0_ref =10-15.8,
k1_ref =10-12.7, k2_ref =10-9.86, k3_ref =10-7.82,Kv=107,
k0_R1 =10-12.64, k0_R2 =10-12.92, k0_op_amp =10-17.045,
k1_op_amp =10-16.02 Kp=0.5, N=1000
R1=5620, R2=2940, C2=47×10-9, C3=6.8×10⁻⁹
In Fig. 6, line (a) shows the noise that is generated from a second order active low pass filter while line (b) shows the noise that is generated from a second order passive low pass filter.
Phase noise of second order passive low pass filter is lower than second order active low pass filter at low offset frequency, between 1 Hz to 90 kHz. On the other hand, active low pass filter has a better phase noise performance at the
offset frequency above 90 kHz. At the offset frequency of 90 kHz, both filters have phase noise of -122 dBc.
Additionally, the filter noise from active low pass filter has slope approximately 0 dBc/dec from 0-400 Hz offset frequency and the cure will change slop to -40 dBc/dec in the other frequency range.
In the same way, the slope of passive low pass filter noise starts from 20 dBc/dec until it reach to peak value about -106 dBc at 330 kHz offset frequency. After that the slope decreases to -20 dBc/dec in the other frequency range.
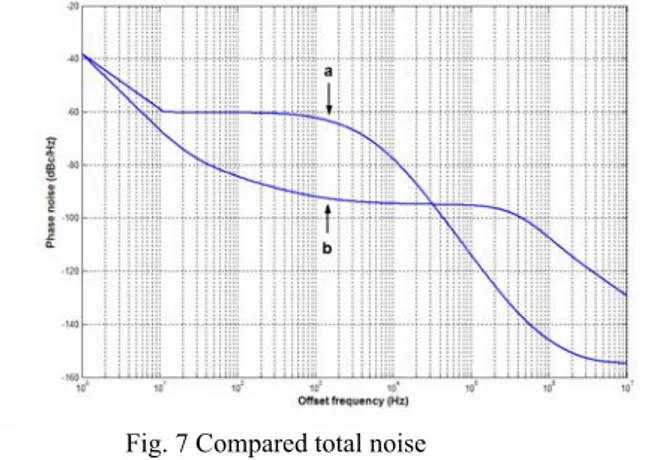
Fig. 7 Compared total noise
(a) Total noise using second order active low pass filter
(b) Total noise using second order passive low pass filter
In Fig. 7, line (a) and (b) show the total noise of PLL with second order active and passive low pass filter, respectively. The relationship between the two plots of total noise is nearly the same as the filter noise. Both plots have the same magnitude around -39 dBc at 1 Hz offset frequency. After that the total noise of the PLL with passive filter is lower than the one with active filter until both total noises reach to 33 kHz offset frequency. At 33 kHz offset frequency, both total noises are equal at -95 dBc. After that the total noise from active filter has a better performance than the passive one.
Additionally, the slope of the total noise from active low pass filter starts at -20 dBc/dec in the low offset frequency range about 1 to 10 Hz. Then its slope increase to 0 dBc/dec until it reaches to 1 kHz offset frequency. After that the slope changes to 40 dBc/dec before it slightly increases until go to -170 dBc noise floor at 10MHz.
In the same way, firstly the slope of the total noise from passive one starts at -30 dBc/dec in the range of 1 to 35 Hz. After that it slightly increases to 0 dBc/dec until it reaches to 300 kHz offset frequency. Then the slope changes to -20 dBc/dec in the other frequency range.
4. CONCLUSION
The total noise in most of PLL circuits is created by four main parts which are reference oscillator, loop filter, voltage control oscillator and main divider. In this paper, we use two types of filter in the PLL, active and passive low pass filter. The total noise models are analyzed using MATLAB and compared. The result shows that the total noise from the second order passive low pass filter is better than the second order active low pass filter in the low offset frequency range (1 Hz to 33 kHz). At the higher frequency range, more than 33 kHz, the second order active low pass filter produces less total noise than the second order passive low pass filter. In
conclusion, the second order passive low pass filter is more efficient filter for PLL circuit at low offset frequency.
REFERENCE
[1] Gary M. Miller, ‘Modern Electronic communication’, 6th Edition, New York: Prentice-Hall International, Inc., 1999
[2] Eric Drucker, ‘Model PLL Dynamics and Phase – Noise Performance’, Microwaves & RF, May 2000
[3] Devendra K. Misra, ‘Radio-Frequency and Microwave Communication circuits’, John Wiley & Sons, 2001 [4] http://www.analog.com/UploadFiles/Data_sheet/3145385
96OP27_c.pdf
[5] B.P. Lathi, ‘Modern Digital and Analog Communication System’, 3rd Edition, Oxford University Press, New York, 1998.
![Fig. 3 Circuit of second order active low pass filter [2] 2.1.1 Resistor noise](https://thumb-ap.123doks.com/thumbv2/123dokinfo/4891263.37036/2.892.467.804.296.529/fig-circuit-second-order-active-filter-resistor-noise.webp)