http://dx.doi.org/10.7236/IJASC.2021.10.1.105
Method for Estimating Intramuscular Fat Percentage of Hanwoo(Korean
Traditional Cattle) Using Convolutional Neural Networks in Ultrasound Images
Sang Hyun, Kim
Professor, Department of Cyber Security, Youngsan University, Yangsan Campus, 288 Junam-ro,
Yangsan, Gyeongnam, 50510, Korea
[email protected]
Abstract
In order to preserve the seeds of excellent Hanwoo(Korean traditional cattle) and secure quality competitiveness in the infinite competition with foreign imported beef, production of high-quality Hanwoo beef is absolutely necessary. %IMF (Intramuscular Fat Percentage) is one of the most important factors in evaluating the value of high-quality meat, although standards vary according to food culture and industrial conditions by country. Therefore, it is required to develop a %IMF estimation algorithm suitable for Hanwoo. In this study, we proposed a method of estimating %IMF of Hanwoo using CNN in ultrasound images. First, the proposed method classified the chemically measured %IMF into 10 classes using k-means clustering method to apply CNN. Next, ROI images were obtained at regular intervals from each ultrasound image and used for CNN training and estimation. The proposed CNN model is composed of three stages of convolution layer and fully connected layer. As a result of the experiment, it was confirmed that the %IMF of Hanwoo was estimated with an accuracy of 98.2%. The correlation coefficient between the estimated %IMF and the real %IMF by the proposed method is 0.97, which is about 10% better than the 0.88 of the previous method.
Keywords: Hanwoo, Ultrasound Images, CNN, %IMF(Intramuscular Fat Percentage), ROI
1. Introduction
Korea, which has an export-oriented industrial structure, is promoting FTAs(free trade agreements) with countries around the world. In the process of pursuing such FTAs, the opening of beef imports is one of the very important issues required by other countries. In order to preserve the seeds of excellent Hanwoo(Korean traditional cattle) and secure quality competitiveness in the infinite competition with foreign imported beef, production of high-quality Hanwoo beef is absolutely necessary.
The meat quality of Hanwoo beef is classified according to its tenderness, juiciness, flavor, etc. As a criterion for evaluating high-quality meat, marbling is the most important and additional factors include meat color, fat color, texture, and maturity. The marbling is the most important factor in carcass valuation, although standards vary according to food culture and industrial conditions by country [1-3]. It has been
IJASC 21-1-11
Manuscript Received: January. 27, 2021 / Revised: February. 2, 2021 / Accepted: February. 7, 2021 Corresponding Author: [email protected]
Tel: +82-55-380-9522, Fax: +82-55-380-9249
evaluated as an indicator of high quality beef [4, 5]. Here, the marbling is determined by %IMF (Intramuscular Fat Percentage) and the distribution status of the intramuscular fat [6-8].
As a method for evaluating the marbling of living Hanwoo, that is, living body, it is known that the method using ultrasound images is the most suitable. Methods of evaluating marbling from ultrasound images can be largely divided into sensory methods and texture analysis methods. The sensory method is a method of making judgments with the naked eye of a skilled person. Texture analysis is a method of judging marbling with an algorithm developed using computer programming.
Direct marbling evaluation using the aforementioned texture analysis method is highly variable and it is difficult to obtain an overall accurate result. Marbling and %IMF generally have a correlation of 0.73. Based on these characteristics, it is effective to combine texture analysis and %IMF analysis for marbling evaluation.
The most representative %IMF evaluation program used in Korea is a method developed by Iowa State University [9-11]. In this method, an expert sets a region of interest (ROI) with a size of 100×100 at a location where the image characteristics appear well in the ultrasound image. For this region, image features are extracted using various image processing techniques, and %IMF is estimated using a regression equation. Since this method was developed for foreign beef cattle, it is difficult to directly apply it to Hanwoo's %IMF analysis. In addition, it is known that the accuracy of the %IMF estimate is greatly influenced by the skill level of the user in setting the ROI.
Attempts have been made to solve these problems and develop a %IMF estimation algorithm suitable for Hanwoo's own characteristics [6, 7]. In this study, in order to prevent the %IMF from fluctuating according to the user's skill level when setting the ROI, the secondary ROI that can well include intramuscular fat was automatically set from the primary ROI set by the user. A method of extracting texture features that are not sensitive to changes in brightness caused by reflection and shading effects of ultrasound images was developed. In this method, texture features could be stably extracted using BDIP(block difference of inverse probabilities) and BVLC(block variation of local correlation coefficients). Based on these texture features, a regression equation for %IMF analysis was established. However, even in this method, the accuracy of the estimate was greatly influenced by the user's skill level in setting the ROI, and performance was not significantly improved due to the limitation of regression analysis. Therefore, it is necessary to develop a %IMF analysis algorithm suitable for Hanwoo.
Recently a CNN(convolutional neural network) is a class of deep neural networks, most commonly applied to analyzing visual imagery [12, 13]. They have applications in image and video recognition [14], image segmentation and classification [15]. In particular, in the field of ultrasound fat content estimation, a method of estimating %IMF using CNN was studied in ultrasound images of European pigs. [16]. For Hanwoo, a study was attempted to estimate carcass weight and marbling score using SVM (support vector machine) [17].
In this study, we propose a method for estimating %IMF of Hanwoo using CNN in ultrasound images. For the %IMF estimation experiment, 60 steers with %IMF in the range of 4% ~ 20.8% were used in this study. The proposed method first classifies the given real %IMF into 10 classes using k-means clustering method to apply CNN. About 80 ROI images with a size of 80×80 were obtained as samples from each ultrasound image of a steer, and a total of 4909 ROI images were used in the experiment. Of these, 75% (3681 images) were used as training data and 25% (1228 images) were used as data for the %IMF estimation test. Ultrasound images have strong local characteristics, so each of the 80×80 ROI images obtained from one image has different characteristics depending on the location. If the %IMF can be accurately estimated from ROI images with strong local characteristics, it can be determined that this method can estimate %IMF
regardless of the skill level of the user setting the ROI. The proposed CNN model is composed of three stages of convolution layer with the size of the convolution filter is 3×3 and fully connected layer. As a result of the experiment, it was confirmed that the %IMF of Hanwoo was estimated with an accuracy of 98.2%. The correlation coefficient between the estimated %IMF and the real %IMF by the proposed method is 0.97, which is about 10% better than the 0.88 of the previous method.
2. Previous Method
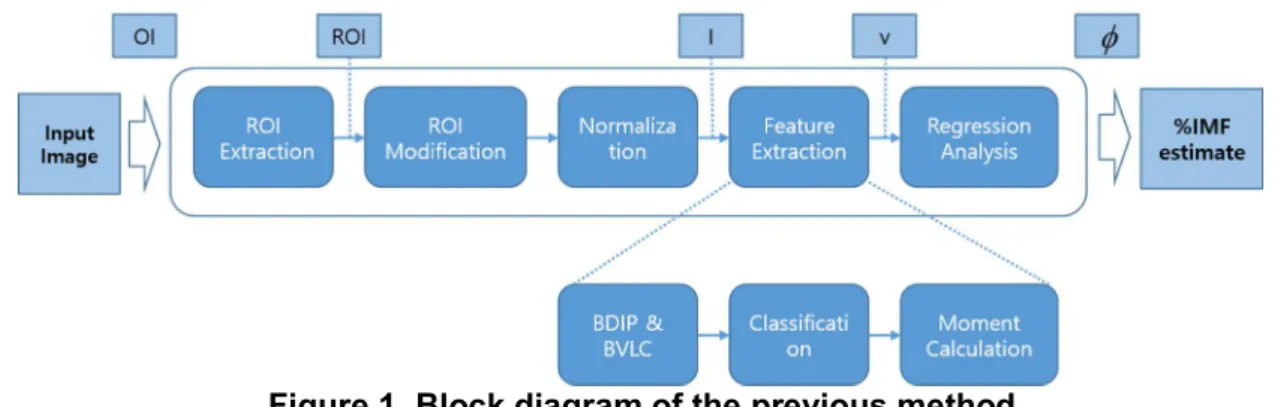
The previous method for estimating %IMF of Hanwoo is a method based on image feature extraction using BDIP and BVLC operators [6, 7, 18]. Figure 1 shows a block diagram of how %IMF is calculated with this method. In the figure, ROI extraction extracts the ROI area surrounded by the manually set ROI boundary displayed in the input image. In the ROI modification step, a rectangular area of a certain size centered on the center of mass of the passive ROI is extracted. In the normalization step, brightness values of pixels in the ROI region are adjusted to have a predetermined average and standard deviation. The feature extraction step consists of image feature extraction, pixel classification, and moment calculation. In the feature extraction step, BDIP and BVLC operators were used, in the pixel classification step, each pixel is classified into a class according to the extracted BDIP value, and moments are calculated for each class in the moment calculation step, and these are used as feature vectors. In the regression analysis step, the %IMF is calculated by applying the feature values to the regression equation.
Figure 1. Block diagram of the previous method
In the figure, “OI” is the input image, “ROI” is the ROI image extracted from the “OI”, and “I” is the normalized ROI image. Normalization is a process of changing the range of brightness values of pixels, and is defined as follows [19].
( , ) = ( , ) − + (1) Here, and represent images before and after normalization respectively. and
are the mean and standard deviation of the original image before normalization, and
represent the mean and standard deviation after normalization. By setting and to desired values, the range of ROI image brightness is adjusted.
In multiple regression analysis, the regression equation is as follows [19].
Here, φ is the dependent variable, indicating %IMF, (l = 1, 2, …, L) represents the features of the image as an independent variable. α (l = 0, 1, 2, …, L) is a regression coefficient. The regression coefficient is obtained by obtaining the features of ROI images and applying the least squares method.
2.1. ROI Modification
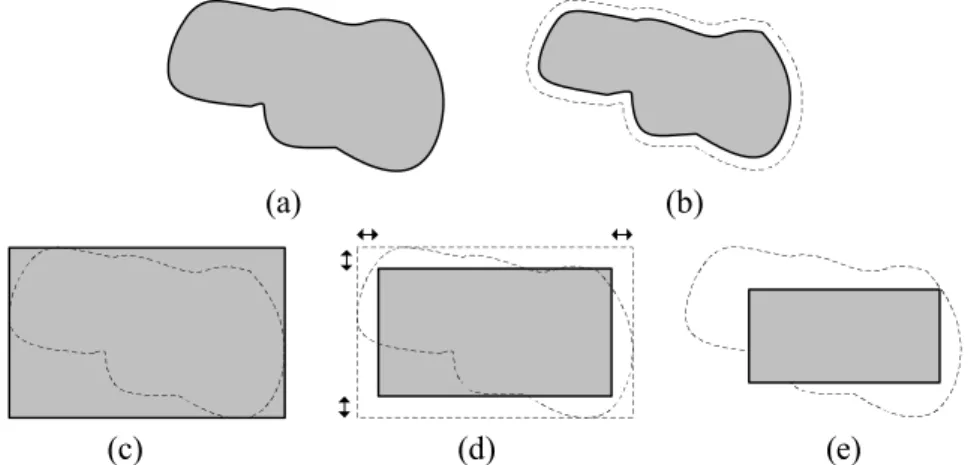
Figure 2 is an image in which the ROI was manually set in an actual ultrasound image. Figure 3
(a) is an example of separately marked ROI given manually, and (b) to (e) are modified ROIs. In (b)
to (e), the dotted line indicates the passive ROI, and the gray part is the modified ROI area. (b) is a
reduction in shape while maintaining the shape of the passive ROI, and (c) is a rectangle
circumscribed to the passive ROI. (d) is an inner rectangle with a portion of the horizontal and
vertical cut off from the circumscribed rectangle, and (e) is a rectangular area of a certain size
centered on the center of mass of the passive ROI.
Figure 2. An image of manually setting ROI from an actual ultrasound image (%IMF=13.47%)
(a) (b)
(c) (d) (e)
Figure 3. ROI correction (a) manual ROI; (b) reduced ROI; (c) circumscribed square ROI; (d) inner square ROI; (e) center square ROI
2.2 Classification and Moment Calculation
In the pixel classification step, pixels are classified according to the BDIP value of each pixel. First, based on the average of the BDIP, the classes are classified into pixels having a smaller value and pixels having a larger value. Next, the average of the BDIP for each class is calculated and classified into classes having a small value and a large value. After passing through this classification K times, pixels are classified into 2 classes.
v = [ , , , ] (3) Here, and are vectors of the mean and standard deviation by the BDIP operation,
and the BVLC operation. These moment vectors are composed of the corresponding moments of each class, and N represents the number of classes.
2.3 BDIP Operation
The BDIP operation is a feature extraction method that shows excellent performance in image retrieval in recent years. It extracts edges and valleys well, and recognizes changes in brightness in dark areas better than changes in brightness in bright areas. The BDIP operation takes the form of normalizing the average brightness change amount within each block to the maximum brightness value of the block as follows [6, 7].
( , ) = | |∑( , )∈ ( ( , ) ( , ))
( , ) (4)
Here, | | represents the number of pixels in the ROI area . ( , ) is the average of the ROI area. ( , ) is the coordinates of the center of the ROI area.
2.4. BVLC Operation
BVLC is a texture feature that measures the degree of smoothness and roughness in an image by calculating the amount of change in the local correlation coefficient with neighboring pixels in block units. Local correlation coefficients refer to local covariance normalized to local variance, and are expressed as follows [6, 7].
ρ ( ) =
∑( , )∈ ( , ) ∆ ( ), ∆ ( ) ∆( )
∆( ) (5) Here, = ( , ) represents the order of blocks according to raster scanning, and ( , ) represents the vertical and horizontal positions of blocks in the image. and represent the average and standard deviation of the brightness of block , respectively. ∆( ) = (∆ ( ), ∆ ( )) represents moving by in one of four directions (90°, 180°, 0°, -90°), ∆( )and ∆( )represent the brightness average and standard deviation of the block shifted by from block . Figure 4 shows the shape of the block moved in each of the four directions when = 1.
Figure 4. 2×2 blocks and the shape of the block moved in four directions: (a) 90, (b) 180, (c) 0, (d) -90
Therefore, when the pixel position is ( , ), BVLC is defined as the value obtained by subtracting the minimum value from the maximum value from the local correlation coefficient in the four directions in Figure 4, and is expressed as follows [6, 7].
( ) = max
∆( )∈ [ ( )] − min∆( )∈ [ ( )] , = {(− , 0), (0, − ), (0, ), ( , 0)} (6)
From this equation, it can be seen that the BVLC has a large value when the roughness is strong in the block and a small value when the smoothness is strong. In addition, the BVLC can obtain the texture characteristics of an image according to the maximum distance between pixels in the block in (6).
3. Proposed Method
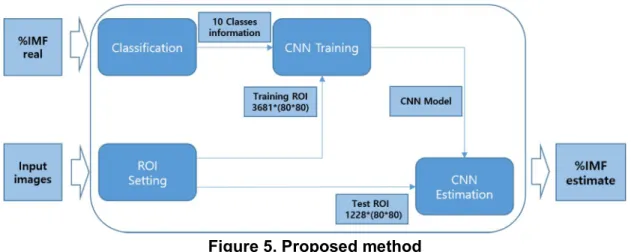
Figure 5 shows a block diagram of the process of calculating the %IMF by the proposed method. In the figure, classification is the process of classifying the real %IMF values chemically analyzed in the carcass into 10 classes in order to substitute them into CNN. ROI setting extracts 80×80 ROI images at regular intervals from ultrasound images. In CNN training & estimation, about 75% of the 80×80 ROI image samples are used as training samples to generate a CNN model, and the remaining 25% to evaluate the prediction accuracy of the previously created CNN model.
Figure 5. Proposed method 3.1. Classification of %IMF(Intramuscular Fat Percentage)
The real %IMF of Hanwoo(steer) used in this study is real values within the range of about 4% to 20.8%. Since it is not easy to apply these real values directly to the CNN model, it is necessary to classify, that is, quantize, into a class of a certain number. Classifying the real %IMF into a certain number of classes leads to data loss, or some sort of quantization error. In order to minimize such quantization errors, the k-means clustering, which is widely used in image processing, is applied and classified into classes.
In k-means clustering, for data, = { , , , … , } expressed in the form of a vector, data is allocated to classes S = { , , , … , } so that the difference between the centers of the class to which the data belongs and the distance between the data is minimized. The operation of k-means clustering can be expressed as the following optimization problem [20].
argmin
, ∑ ∑ ‖ − ‖ (7)
Here, is a binary variable with a value of 1 if the th data belongs to the kth value class , or 0 otherwise, means the center of the kth class. Executing k-means clustering is equivalent to setting and values for the given data X.
3.2. ROI Setting
As shown in Figure 2, the existing ROI setting is a method in which an expert in the field of livestock industry with a long experience sets an arbitrary shape of a closed curve. In this method, one ROI image can be obtained from an ultrasound image, and the result varies greatly depending on the expert's skill level. In addition, in order to derive excellent results from the CNN method, a lot of image data is required for training and testing. In this study, in order to increase the number of ROI images and reduce the change in the measurement result according to the ROI setting position, ROI images were obtained so as to overlap in a wide range while moving the ROI position at regular intervals based on the center of the ultrasound image. About 80 ROI images were acquired per ultrasound image.
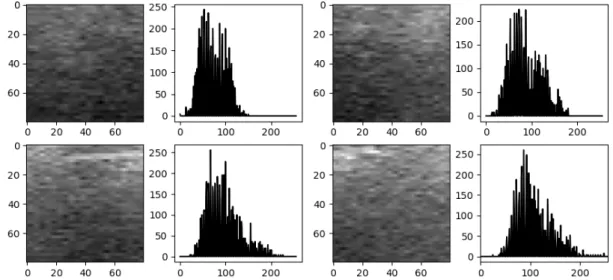
Figure 6 shows a sample and histogram of an ROI image obtained at an arbitrary location in the ultrasound image (%IMF = 13.47%) shown in Figure 2. In the figure, since the ultrasound image has strong local characteristics, it can be seen that the ROI images obtained from one image also have statistically different characteristics according to each position. Therefore, it is a very difficult problem to apply regression analysis based on ROI images obtained from multiple ultrasound images with various fat contents. In particular, it is important to decide which filter to use to extract image features to be used in regression analysis.
Figure 6. ROI (80×80) images and histograms obtained at arbitrary locations in the ultrasound image (%IMF = 13.47%)
CNN was first introduced to process images more effectively by applying various image processing filtering techniques to artificial neural networks. Later, a CNN in the form currently used in deep learning was proposed. The basic concept of CNN is that each element of the filter expressed as a matrix is automatically learned to be suitable for data processing. For example, when we develop a %IMF estimation algorithm, we can improve the accuracy by using various image processing filtering techniques. However, this method has no choice but to limit the filter to be used in the algorithm through the researcher's intuition or repeated experiments. Therefore, if a CNN that automatically finds a suitable filter by applying various filters to a given image is used, the prediction accuracy can be maximized.
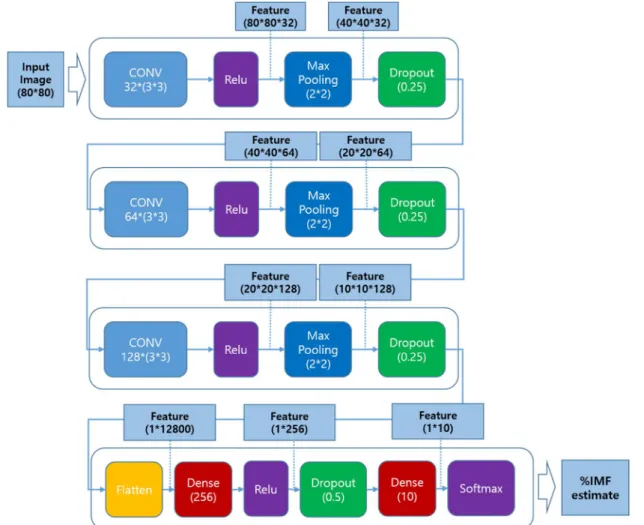
3.3. CNN Architecture Design
repeatedly combines the convolution filter, the activation function (ReLU), and the max-pooling layer and dropout. In addition, the number of convolution filters was increased by a multiple of 2, and the convolution layer was constructed in three stages. In the layer near the input terminal with a large image size, the number of filters was reduced. As the distance from the input end, that is, the smaller the image size, the number of filters is increased to keep the operation time and the amount of computation in each stage relatively constant to balance the system. In the fully connected layer, if features are extracted from the convolutional layer, the extracted feature values are input to the existing neural network for classification.
Figure 7. The proposed CNN architecture for Hanwoo %IMF estimation
In the proposed CNN structure, a dropout layer is placed in both the convolution layer and the fully connected layer to prevent over-fit. The role of the dropout layer prevents learning from biased toward learning data by randomly turning off neurons when the neural network is learning. In general, when learning data using CNN, when the number of features is large and the number of samples used for training is relatively small, over-fit can occur. In the case of %IMF estimation in this study, since the number of ROI image samples is small, the use of the dropout layer is absolutely necessary. At the end of the fully connected layer, we put the Softmax function. Softmax function is a kind of activation function such as sigmoid or ReLu. The Softmax function is a function that can have multiple classifications. In this study, the Softmax function was used in the last step to classify the %IMF into 10 classes.
4. Results and Discussion
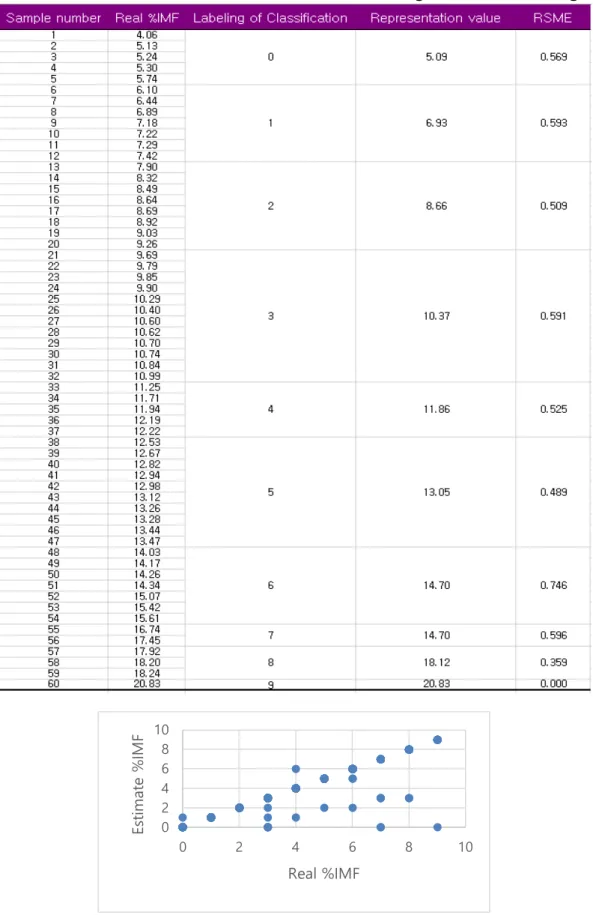
In this study, ultrasound images of the sirloin (ventral longest muscle) between the 13th thoracic and 1st lumbar spine on the left of Hanwoo (steer) were used for the experiment. There are a total of 60 steers used in the experiment, and the %IMF measured chemically after slaughter is in the range of 4% to 20.8%. Table 1 shows the results of classifying %IMF into 10 classes using k-means clustering to apply to CNN. In Table 1, the real %IMF is classified into 10 classes, and the representative values of each class and the root mean square error (RMSE) values that occur when classifying into classes are shown. In the class classification process for application to CNN, the proposed method shows a classification error of about 0.553 on average.
In addition, it can be seen that the real %IMF of the steers used in the experiment is concentrated in classes 2, 3, 5 and 6, and the number of image samples is relatively small in classes 7, 8 and 9. This non-uniform data distribution can be a factor that degrades prediction accuracy when CNN is applied. When predicting the %IMF of samples in a class with a small number of data, a large prediction error can occur.
In this study, about 80 ROI images with a size of 80×80 were obtained as samples from each ultrasound image of a steer, and a total of 4909 ROI images were used in the experiment. Of these, 75% (3681 images) were used as training data and 25% (1228 images) were used as data for the %IMF estimation test. Since ROI images were acquired at random locations at regular intervals without special prior knowledge, the proposed method can easily estimate %IMF even by non-experts not related to the livestock industry. The CNN model used in the experiment was implemented using Keras, a deep learning library provided by Python. The epoch, which is the number of times the backpropagation algorithm used in neural networks, is applied to the entire data set, was set to 20 times.
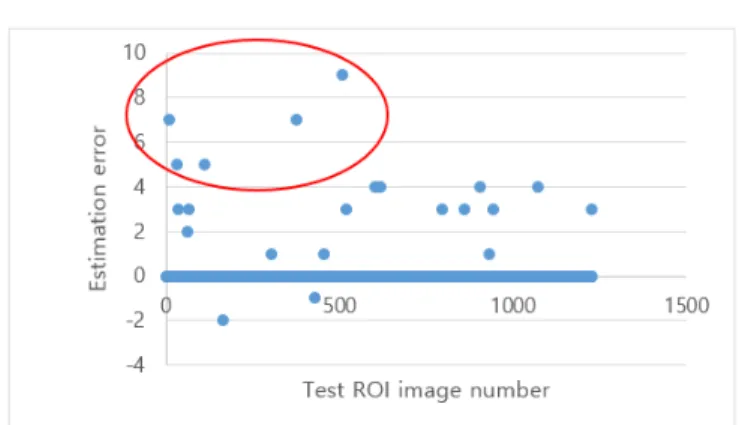
As a result of the experiment, the prediction accuracy of the proposed CNN model is about 98.2%. When analyzed in detail, out of the 1228 ROI images used for the accuracy test, 1206 accurately estimated and 22 incorrectly estimated. Figure 8 compares the real %IMF and estimated %IMF for 1228 ROI images used for the accuracy test, and Figure 9 shows the estimation error. In Figure 8, the points on the diagonal line are the result of accurately estimating %IMF, and the other points are the result of incorrect estimation. In the figure, it can be seen that the estimation error is large in class 7~9.
Figure 9 shows only the prediction error separately. In the figure, most of the estimation errors are 0, but it can be seen that there are estimation errors only for 22 ROI images. If the prediction error is 5 or more (the area indicated by the red circle), it is judged that it belongs to the 7th to 9th class, based on Figure 8. The reason for the large estimation error in class 7~9 is that the number of data belonging to the class is relatively too small, so that proper training has not been performed in the CNN model. Table 2 compares the estimation performance of the previous method and the proposed method. The table shows the correlation coefficient between the estimated %IMF and the real %IMF by each method. It can be seen that the correlation coefficient of the proposed method is 0.97, which is about 10% better than the existing 0.88.
Table 1. Results of real %IMF class classification using k-means clustering
Figure 8. Real %IMF vs. estimated %IMF for test ROI images (1228 images)
0 2 4 6 8 10 0 2 4 6 8 10 Es tim at e % IM F Real %IMF
Figure 9. Prediction error for test ROI images (1228 images)
Table 2. Comparison of correlation coefficients between %IMF and real %IMF estimated by the previous method and the proposed method
5. Conclusion
In this study, a method for estimating the %IMF (intramuscular fat content) of Hanwoo beef using CNN in ultrasound images was proposed. The proposed method first classifies the given %IMF into 10 classes by using the k-means clustering method to apply CNN. From each ultrasound image, 80 ROI images at random locations were sampled at regular intervals and used for CNN training and estimation. The CNN model is composed of three stages of convolution layer and fully connected layer.
As a result of the experiment of the proposed method, it was confirmed that the %IMF of Hanwoo beef was estimated with an accuracy of 98.2% for the ROI image at an arbitrary location set by the user. When comparing the estimation performance of the previous method and the proposed method, the correlation coefficient between the estimated %IMF and the real %IMF of the proposed method is 0.97, which shows that the performance is improved by about 10% compared to the previous 0.88. However, since the number of ultrasound images used in the experiment is small, samples are concentrated in some classes. This non-uniform data distribution is judged to be a factor that degrades the estimation accuracy when CNN is applied. Efforts are needed to improve these problems in the future.
Acknowledgements
This work was supported by Youngsan University Research Fund of 2020.
References
[1] Kim, C. J. and Lee, E. S. “Effects of quality grade on the chemical, physical and sensory characteristics of Hanwoo (Korean native cattle) beef,” Meat Sci. 63, 397-405, 2003. doi: 10.1016/S0309-1740(02)00099-2
[2] Moon, S. S., Yang, H. S., Park, G. B., and Joo, S. T, “The relationship of physiological maturity and marbling judged according to Korean grading system to meat quality traits of Hanwoo beef females,” Meat Sci. 74, 516-521, 2006. doi: 10.1016/j.meatsci.2006.04.027
[3] Moore, C. B., Bass, P. D., Green, M. D., Chapman, P. L., O’Connor, M. E., Yates, L. D., Scanga, J. A., Tatum, J. D., Smith, G. C., and Belk, K. E. “Establishing an appropriate mode of comparison for measuring the performance
of marbling score output from video image analysis beef carcass grading systems,” J. Anim. Sci. 88, 2464-2475. 2010. doi: 10.2527/jas.2009-2593
[4] Gotoh, T., Albrecht B. E., Teuscher, B. F., Kawabata, C. K., Sakashita, C. K., Iwamoto, A. H., and Wegner, J, “Differences in muscle and fat accretion in Japanese Black and European cattle,” Meat Sci. 82, 300-308, 2009. doi: 10.1016/j.meatsci.2009.01.026
[5] Irie, M., Kouda, M., and Matono, H, “Effect of ursodeoxycholic acid supplementation on growth, carcass characteristics, and meat quality of Wagyu heifers (Japanese Black cattle),” J. Anim. Sci. 89, 4221-4226, 2011. doi: 10.2527/jas.2011-4211
[6] Kim, N. C. Development of intramuscular fat percentage calculation program for ultrasound images. National Agricultural Cooperative Federation Livestock Improvement Office, Research report, 2007.
[7] Kim, N. C. Kim, S. H. So, H. J. and Jung. J. K. Method for calculating intramuscular fat content from ultrasound images. Korea Patent No. 10-0930883, 2009.
[8] Lee, J. M. Choe, J. H. Jin, H. J. Kim, T. I. Park, B. Y. Hwang, D. Y. Koh, K. C. Kim, C. J. and Hwang, K. S, “Effect of Marbling Score on Carcass Grade Factors, Physico-chemical and Sensory Traits of M. Longissimus Dorsi in Hanwoo,” Korean J. Food Sci. An. Vol. 32, No. 5, 659~668, 2012. doi: 10.5851/kosfa.2012.32.5.659 [9] Hassen, A. Wilson, D. E. Amin, V. R. Rouse, G. H. and Hays, C. L, “Predicting Percentage of Intramuscular Fat
Using Two Types of Real-Time Ultrasound Equipment,” J. Anim. Sci., vol. 79, 11-18, 2001. doi: 10.2527/2001.79111x
[10] Devitt, C. J. B. and Wilton, J. W, “Genetic correlation estimates between ultrasound measurements on yearling bulls and carcass measurements on finished steers,” J. Anim. Sci., vol. 79, 2790-2797, 2001. doi: 10.2527/2001.79112790x
[11] Greiner, S. P. Rouse, G. H. Wilson, D. E. Cundiff, L. V. and Wheeler, T. L, “The relationship between ultrasound measurements and carcass fat thickness, and longissimus muscle area in beef cattle,” J. Anim. Sci., vol. 81, 676– 682, 2003. doi: 10.2527/2003.813676x
[12] LeCun, Y. Convolutional Nets and CIFAR-10: An Interview with Yann LeCun. No Free Hunch. December 22, 2014.
[13] Elhassouny, A. and Smarandache, F, “Trends in deep convolutional neural Networks architectures: a review,” International Conference of Computer Science and Renewable Energies(ICCSRE), Agadir, Morocco, 2019, pp. 1-8, 2019. doi: 10.1109/ICCSRE.2019.8807741.
[14] Sarfaraz, M. Ahsan, U. Munawwar, F. Rizvi, D. and Ahmed, R. M, “Scene Recognition from Image Using Convolutional Neural Network,” International Conference on Computational Intelligence and Data Science, 2019. doi: 10.1016/j.procs.2020.03.400
[15] Sultana, F. Sufian, A. and Dutta, P, “Evolution of Image Segmentation using Deep Convolutional Neural Network: A Survey,” Knowledge-Based Systems 201–202 106062, 2020. doi: 10.1016/j.knosys.2020.106062
[16] Kvam, J. and Kongsro, J, “In vivo prediction of intramuscular fat using ultrasound and deep learning,” Computers and Electronics in Agriculture, 2017. doi: 10.1016/j.compag.2017.11.020.
[17] Shahinfar, S. Al-Mamun, H. Park, B. Kim, S. and Gondro, C, “Prediction of marbling score and carcass traits in Korean Hanwoo beef cattle using machine learning methods and synthetic minority oversampling technique,” Meat Science, vol. 161, March, 107997, 2020. doi :10.1016/j.meatsci.2019.107997
[18] Chun, Y. D. Seo, S. Y. and Kim, N. C, “Image Retrieval Using BDIP and BVLC Moments,” IEEE Trans. CSVT, vol. 13, no. 9, 951-957, 2003. doi: 10.1109/TCSVT.2003.816507
[19] R. C. Gonzales and R. E. Woods, Digital Image Processing 2ndEdition, Prentice Hall, Upper Saddle River, NJ,
2002.
[20] Lloyd., S. P, “Least squares quantization in PCM,” IEEE Trans. on Information Theory, 28 (2): 129–137, 1982. doi:10.1109/TIT.1982.1056489.