Development of a multidimensional analysis methodology for
a sodium-water reaction in a SFR steam generator
Seyun Kim*, Jae-Hyuk Eoh, Won-Dae Jeon, Seong-O Kim
Fluid Sys. Eng. Div., KAERI, 150 Deokjin-Dong, Yuseong-Gu, Deajeon, Korea, 305-353, [email protected]
1. Introduction
In a SFR (Sodium-cooled Fast Reactor), the possibility of a water-steam leak into the sodium is indispensable. The chemical and physical aspects of the
exothermic reaction of sodium-water (H2O) could be
followed by a pressure pulse and an overpressurization of the secondary system. And the more, the sodium-water reaction (SWR) phenomenon is a multiphase and multi-component from the view point of an analysis, accordingly, the perceptions of the phenomenon have been required for the safety of a reactor system. However, the multidimensional analysis of a SWR is deficient for the complexities. The simulation of a SWR is accounted to be possible using the commercial computational fluid dynamics (CFD) code. Since the multi-purpose commercial CFD codes have been experimentally and empirically validated in various engineering and industrial applications, the SWR in a SFR steam generator (SG) could be simulated with appropriate physical models. A numerical approach is tried in the present research.
2. Numerical analysis methodology
2.1 Multidimensional CFD code
The multi-purpose multidimensional CFD codes which have been applied extensively in various engineering problems and are possible to be deliberated on here are STAR-CD, FLUENT and CFX. For the three codes, the previous estimation of the applicability of a complex analysis model and a physical limit of the codes are studied. The chemical reaction, Eulerian multiphase flow and multiple immiscible flow can not be used in a combination with the free surface model fundamentally in the STAR-CD and FLUENT code. Consequently, the chemically reacting flow of a liquid sodium, gas sodium, gas hydrogen and water vapor scarcely can be simulated. In the CFX version 5.7.1 [1], the chemical reaction and the free surface flow can be simulated simultaneously. Namely, a multi-component and a multi-phase Eulerian-Eulerian reacting flow can be resolved by CFX. For that reason, CFX is selected as a solver to solve the multidimensional SWR problem.
2.2 Reaction model
The dominant reaction of a SWR is expressed as eq.
(1) [2]. Where, β is a reaction frequency constant.
2 2 2 2(1 ) 1 ) 1 ( ) 1 ( +β Na+H O→βNaO+ −β NaOH+ +β H
When the reaction is sufficiently fast compared to the flow transport time, an eddy dissipation model (EDM) can be used [3]. The reaction rate is determined with the time scale of a molecular mixing in the model. The time scale depends on the turbulent mixing time scale in the turbulent flow as follows.
ε τmixing =k, k rate∝ε , t t t O NaH k R 2 =4ρ ε
Through EDM, the source term for a reaction product, hydrogen, can be described as an equation as below. The reaction process depends on the mass fraction of
each reactant and the mass conversion coefficientCmass.
⎪⎭ ⎪ ⎬ ⎫ ⎪⎩ ⎪ ⎨ ⎧ ⎟⎟ ⎠ ⎞ ⎜⎜ ⎝ ⎛ + ⎟ ⎟ ⎠ ⎞ ⎜ ⎜ ⎝ ⎛ = massNal Nal O H massH massNag Nag O H massH O NaH H C mf mf C C mf mf C R S 2 2 2min 2 , 2min 2 ,
The generation of heat by the reaction can be simulated in a similar way by utilizing table data [4].
3. Multidimensional analysis of SWR
3.1 Analysis condition
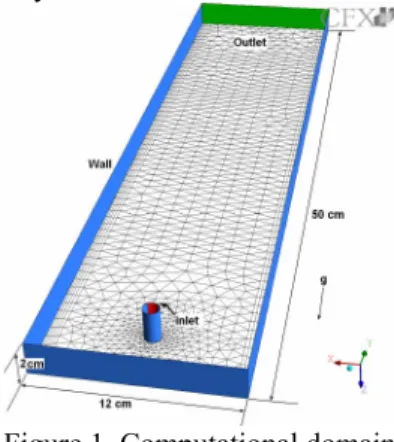
2-dimensional computational domain is depicted in Fig. 1. 7577 nodes of a tetrahedron and prism grid is used in the analysis.
Figure 1. Computational domain
Water vapor of 700 [K] extrudes at the inlet to the
steady sodium pool of 423 [°C] with a velocity of 50 [m/s]. A transient analysis to 0.05 [s] with the time step of 0.0001 [s] to 0.0005 [s] has been carried out.
3.2 Analysis result
The vapor mass flow rate and corresponding hydrogen production rate is shown in Fig. 2. There is a distinct relation between the two rates.
Transactions of the Korean Nuclear Society Autumn Meeting Busan, Korea, October 27-28, 2005
0.0E+00 2.0E-03 4.0E-03 6.0E-03 8.0E-03 1.0E-02 1.2E-02 0 0.01 0.02 0.03 0.04 0.05 Time [s] M as s fl ow ra te [k g/ s] Hydrogen Water vapor
Figure 2. Mass flow rate vs. time
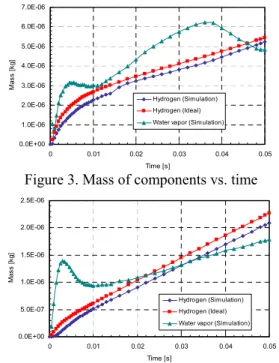
The steep decrease of the mass flow rate of early time is caused by a density variation in the inlet. As a result, the reaction rate also decreases. Using the hydrogen mass conversion coefficient presented in the previous 1-D research [2], the hydrogen mass is calculated and compared with the hydrogen mass of the present analysis result in Fig. 3. Compared to the ideal hydrogen production rate 0.0778, the present analysis results show a 17% smaller hydrogen production rate. This is mainly from the realistic incomplete mixing of the reactants. 0.0E+00 1.0E-06 2.0E-06 3.0E-06 4.0E-06 5.0E-06 6.0E-06 7.0E-06 0 0.01 0.02 0.03 0.04 0.05 Time [s] Ma ss [ kg ] Hydrogen (Simulation) Hydrogen (Ideal) Water vapor (Simulation)
Figure 3. Mass of components vs. time
0.0E+00 5.0E-07 1.0E-06 1.5E-06 2.0E-06 2.5E-06 0 0.01 0.02 0.03 0.04 0.05 Time [s] M ass [kg ] Hydrogen (Simulation) Hydrogen (Ideal) Water vapor (Simulation)
Figure 4. Mass of components vs. time in case of sodium gas- water vapor reaction
The mass of each component is presented in Fig. 4. There is no resistance between the liquid-gas interfaces movements, so it is observed that the production of hydrogen is more linear when compared to the case of Fig 3. An 8 % smaller production means that the effect of the liquid-gas reaction is not reflected. The fact that the shear stress in the inter-phase surface of the gas-gas reaction is smaller than that of the gas-liquid reaction results in a diminution of the dissipation rate of the turbulent kinetic energy and reaction rate of the SWR.
The temperature, velocity field and volume fraction of 0.02 [s] are depicted in Fig. 5. The high temperature region of the hydrogen product exists near the gas-liquid interface in the direction of the leakage. The
strong recirculation flow in the gas phase region is shown beside the leakage flow. But, in the interface the radial flow is formed by the expansion of the gas region through the reaction. The hydrogen exists between the liquid sodium and the water vapor region.
Figure 5. Velocity, temperature and volume fraction
4. Conclusion
A numerical analysis methodology of a SWR is developed using the CFX code. The present analysis results underestimate the hydrogen production rate when compared to the ideal one. The analysis presented detailed information of each phase and the components and it reflects the realistic phenomena of a SWR well. In the future, a refinement of the reaction model and a simulation of a leakage in a 3-D rod bundle geometry should be preformed.
Acknowledgment
This research has been performed under the national nuclear mid and long-term R&D program sponsored by the Ministry of Science and Technology of Korea.
REFERENCES
[1] CFX, “CFX-5.7.1 manual,” CFX, 2005
[2] J. H. Eoh, M. H. Wi and S. O. Kim, “A Study on Improvement of the Quasi-steady Reaction Model for Analysis Code of a SWR in LMR”, Proc. of KNS, 2003 Spring Meeting, Kyeong-ju, Korea, May 29-30, 2003 [3] Yaga, M., Endo, H., Yamamoto, T., Aoki, H., Miura, T., “Modeling of eddy characteristic time in LES for calculating turbulent diffusion flame,” International Journal of Heat and Mass Transfer, Vol. 45, pp. 2343-2349, 2002
[4] Tregonning, K., “Mathematical modeling techniques for large scale sodium/water reactions in heat exchangers,” The British Nuclear Energy Society, London, pp. 115-122, 1973