A NEW CPT-BASED METHOD FOR UNDRAINED SHEAR
STRENGTH ESTIMATION OF CLAYS
JUNHWAN LEEi)
ABSTRACT
The estimation of the undrained shear strength su for clays using CPT results has been mainly based on the cone
factor Nk. In this study, a new CPT-based method for the estimation of the undrained shear strength su is presented.
This aims at reducing uncertainties for the estimation of su and enhancing the application of CPT results in more
effective manner. For this purpose, a site located at a marine clay deposit is selected and test results from extensive experimental testing program are adopted. The new method defines a direct correlation between the undrained shear strength su and the cone resistance qt, excluding the procedure of the overburden pressure correction and therefore
undisturbed soil sampling process. In order to verify the new CPT-based method, additional test sites and example sites from literature, which consist of a variety of soil conditions, are selected and examined. It is observed that values of su obtained from the proposed method are in good agreements with measured values of su for all the
selected verification cases.
Key Words : Clays, Undrained shear strength, CPT, cone factor
1 INTRODUCTION
The cone penetration test (CPT) is particularly effective for clays as it allows estimation of both strength and consolidation characteristics. Estimation of the undrained shear strength su using CPT results has
been mainly based on the cone factor Nk that relates the
CPT cone resistance qt and the overburden total stress
σv0 to su (Yu and Mitchell 1998). According to the
bearing capacity theory, the cone factor Nk corresponds
to the bearing capacity factor Nc under the condition of
undrained deep penetration. For shallow foundations, the value of Nc for φ = 0 has been proposed as 5.7
(Terzaghi 1943), while Nc = 9 is commonly adopted for
deep foundations (Meyerhof 1951). Although the resemblance between the penetration processes of pile and cone may support the use of Nk = 9, investigations
on values of Nk are still underway.
In the present paper, the estimation of the undrained shear strength su for clays using CPT cone resistance is
investigated, and a new methodology, which can reduce uncertainty for the CPT-based estimation of su, is
presented. For this purpose, a site located at a marine clay deposit is selected and test results from extensive experimental testing programs are adopted. The method presented in this study does not involve the correction procedure of the overburden stress that requires the value of soil unit weight and thus undisturbed soil sampling process. For verifying the CPT-based method,
verification sites and several case examples are selected and used for comparison of measured and estimated undrained shear strengths.
2 CONE FACTOR METHOD
The undrained shear strength su of saturated clays
can be estimated using CPT cone resistance qt based on
the following relationship:
k v t u
N
q
s
=
−
σ
0 (1)where su = undrained shear strength; qt = CPT cone
resistance with the pore pressure correction using area ratio; σv0 = overburden total stress at cone tip level; and
Nk = cone factor. Nk differs numerically from the
bearing capacity factor Nc (Lunne et al. 1997), while
both represent the same dependence on the cohesive strength. Different approaches have been adopted for the evaluation of Nk values, including the bearing
capacity approach, cavity expansion analysis, steady state analysis, and numerical methods such as finite element and finite difference methods (Vesic 1972; Teh and Houlsby 1991; Yu and Mitchell 1998).
In the bearing capacity approach, Nk is obtained from
the bearing capacity factor Nc, combined with the shape
and depth factors assuming deep circular penetration under undrained condition. Values of Nk from most
bearing capacity solutions lie in the range of 9 – 11. The cavity expansion and steady state approaches are more rigorous than the bearing capacity approach, in the sense that these models take into account the actual cone penetration process with the consideration of both strength and compressibility of soils. According to Yu and Mitchell (1998) and Yu et al. (2000), the expressions of Nk for the cavity expansion and steady
state solutions can be given as a logarithmic function of the rigidity index G/su.
Table 1 shows measured Nk values obtained at
various locations from the literature. As shown in Table 1, wide range of Nk values from 5 to 30 has been
reported, while the average range of Nk values is found
to be in 13 – 15 range. From previous investigations on Nk values, it has been presented that there are several
empirical factors that control the values of Nk,
including test type and plasticity index. The stress correction procedure contained in the su-qt correlation
of Eq. (1) should also be addressed for the values of Nk.
As indicated in Eq. (1), the estimation of su using Nk
should be based on the knowledge of the overburden stress σv0 with depth, which could be largely misled
unless the collection of undisturbed soil samples with high quality are guaranteed.
Table 1. Values of Nk at different locations.
Location Nk Reference
Brazil 10-15 Rocha-Filho and Schnaid (1995) Italy 14 Pane et al. (1995)
Japan 8-16 Tanaka and Tanaka (2004) Malaysia 5-13 Chang (1995) Norway 5-9 Sandven et al. (2004) Singapore 12-14 Chang (1995)
UK 17-30 Marland (1974)
3 EXPERIMENTAL TEST RESULTS 3.1 Site Characterization
A site on a soft clayey deposit was selected, and test results obtained at this site were collected and adopted in this study. The test site was located at the new harbor construction area near Busan in Korea. The test site consists of two different layers; upper soft marine clayey soils and lower weathered rock layers. For the upper layer, sedimentary silty clayey soils exist down to depths of around 20 – 30 m. The soil surface was at a depth of 3 m below the sea level, and thus the fully saturated condition was maintained.
For the test site, extensive series of field and laboratory tests were conducted including the field vane test (FVT) and cone penetration test (CPT). As FVT and CPT in this study were performed at the same location, direct comparisons of test results obtained from FVT and CPT were readily available. Various
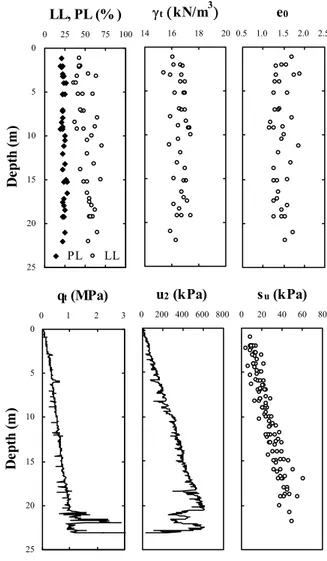
Figure 1. Depth profile of soil properties at test site.
Figure 2. Depth profile of cone factor Nk at test site.
0 5 10 15 20 25 0 25 50 75 100 LL, PL (% ) De pt h (m ) PL LL 14 16 18 20 γt (kN/m3) 0.5 1.0 1.5 2.0 2.5 e0 0 5 10 15 20 25 0 1 2 3 qt (MPa) De pt h (m ) 0 200 400 600 800 u2 (kPa) 0 20 40 60 80 su (kPa) 0 5 10 15 20 25 0 10 20 30 40
N
kD
ept
h (
m
)
Avg. Nk = 14.1laboratory tests, including fundamental property tests, triaxial tests (TX-UU), and unconfined compression tests (UCC), were also conducted.
Soils at the test site were classified into CH and CL according to the unified soil classification system (USCS). Figure 1 shows depth profiles of soil properties obtained from laboratory tests and CPT. As shown in the figure, soils were highly compressible with slight to moderate overconsolidated conditions down to the depth of around 7 - 8 m, below which the soils were essentially in the normally consolidated condition. Based on the test results, values of Nk were
evaluated using measured values of su and qt. Figure 2
shows the depth profile of measured Nk values using su
values from FVT. As show in the figure, majority of Nk
values are observed to lie in a range of 10 – 18. Average Nk value was 14.1.
3.2 Calculated Cone Factor
In order to compare measured and theoretical Nk
values for the test results, various analytical solutions were used in the comparison. Methods adopted herein include the cavity expansion solutions of Baligh (1975) and Yu (1993) and the steady state solutions of Teh and Houlsby (1991) and Yu et al. (2000). Key parameter that controls theoretical value of Nk is the rigidity index
G/su. In this study, values of the rigidity index G/su
were determined from the stress-strain curve and strength obtained from UCC results. Assuming the undrained condition in UCC, the shear modulus G can be given by:
3
)
1
(
2
50 50E
E
G
u=
+
⋅
=
ν
(2) where G = shear modulus; E50 = Young’s modulus at50% strength level; and νu = Poisson’s ratio in
undrained conditions = 0.5.
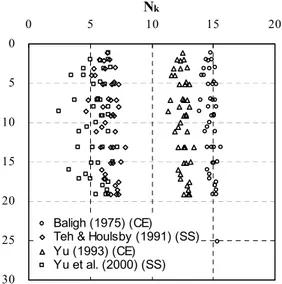
Figure 3 shows depth profiles of Nk with different
methods adopted. From the test results, it was found that most of G/su values obtained from UCC results are
less than 50. Values of Nk from the steady state
solutions (as denoted by SS in Figure 3) of Teh and Houlsby (1991) and Yu et al. (2000) are observed to be in around 3 – 8 range, which are lower than those in around 12 – 16 range from the cavity expansion solutions (as denoted by CE in Figure 3) of Baligh (1975) and Yu (1993). When compared to results given in Figure 2, the cavity expansion solutions appear to give the similar range of Nk values to those measured
from measured values of su and qt. 4 EFFECTIVE CONE FACTOR 4.1 Description
For the design of piles in clays, the shaft resistance qs
can be estimated as (Randolph and Murphy 1985):
Figure 3. Depth profile of calculated Nk.
u
s
s
q
=
α
⋅
(3) where α is the correlation parameter between the pile shaft resistance and su. Considering the similar loadingmechanisms between axially loaded pile and cone, the pile shaft resistance qs may be comparable to the CPT
sleeve friction fs. This suggests that Eq. (3) can be
rewritten in terms of fs as follows:
s s
u
f
s
=
λ
⋅
(4) where λs = correlation parameter between su and fs. Itshould be noted that λs in Eq. (4) is different from α in
Eq. (3), as qs mobilizes under the consolidated state
after the pile installation, whereas fs represents the
shear resistance during the undrained cone penetration process at remolded, unconsolidated states.
Similarly, the base resistance qb of an axially loaded
pile in clays can be regarded as comparable to the cone resistance qt. According to the common pile design in
clays, qb is given by the following simplified
relationship:
u p b
N
s
q
=
⋅
(5) qb = unit pile base load capacity and Np = correlationparameter equal to 9 according to Meyerhof (1951). The correlation factor Np corresponds to the bearing
capacity factor Nc, and thus is comparable to the cone
factor Nk for the cone penetration mechanism. Similarly
to Eq. (4), Eq. (5) can be rewritten in terms of the cone resistance qt as follows:
t b
u
q
s
=
λ
⋅
(6) where λb = correlation parameter between su and qt.According to Eq. (6), if λb is assumed as a material
constant, su can be estimated as a sole function of qt that
is governed by the total stress σv0. This violates the fact
0 5 10 15 20 25 30 0 5 10 15 20 Nk Baligh (1975) (CE) Teh & Houlsby (1991) (SS) Yu (1993) (CE)
that su varies only with the effective stress. In order to
define a unique correlation between qt and su in terms
of the effective stress, Eq. (6) is modified as follows:
(
t i)
bm
u
q
u
s
=
λ
⋅
−
(7) where λbm = modified correlation parameter; and ui =in-situ pore water pressure. If the conventional form of the cone factor equation is considered, Eq. (7) becomes:
e i t u
N
u
q
s
=
−
(8) where Ne = effective cone factor.4.2 Evaluation of Effective Cone Factor
Eqs. (4) and (8) indicate that su can be evaluated
from both fs and qt through correlations parameters λs
and Ne. In order to evaluate λs, correlations between λs
and various parameters, including qt, fs, and Ref
(effective friction ratio), were investigated. The effective friction ratio Ref was adopted for excluding
the in-situ pore pressure ui from qt, and is given by:
%
100
×
−
=
i t s efu
q
f
R
(9)From the correlations, it turned out that λs is best
correlated to Ref while lower degrees of correlations
were seen with qt and fs. The λs-Ref correlation is given
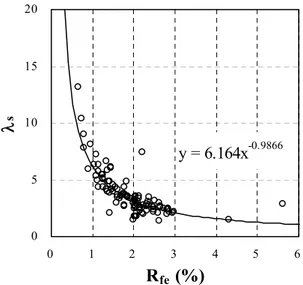
in Figure 4. From Figure 4, the relationship between λs
and Ref was found as:
0 . 1 9866 . 0
100
16
.
6
164
.
6
− −⎟⎟
⎠
⎞
⎜⎜
⎝
⎛
−
⋅
⋅
≈
⋅
=
i t s ef su
q
f
R
λ
(10)If Eqs. (4) and (10) are combined, the following equation is obtained:
16
i t uu
q
s
=
−
(11) It is noted that Eq. (11), derived from Eqs. (4) and (10) in terms of fs and λs, shows the same formulation as Eq.(8) in terms of qt and Ne with Ne equal to 16.
Validation of Ne can also be confirmed from the
relationship with Nk. From Eqs. (1) and (8), Ne can be
given in terms of Nk as follows:
0 0 e v e k v t i t k e
q
q
N
q
u
q
N
N
σ
σ
=
−
′
−
−
=
(12)where Ne and Nk = effective and conventional cone
factors; qe = effective cone resistance = qt - ui; and σv0
and σ′v0= total and effective overburden stresses,
respectively. From Eq. (8) and the well-known SHANSEP equation (Ladd et al. 1977), Eq. (12) can be
rewritten in terms of strength increase ratio as follows:
)
/(
1
s
OCR
0.8N
N
e=
k+
F⋅
(13) where OCR = overconsolidation ratio; and sF = strengthincrease rate = su/σ′v0. In Eq. (13), it was assumed that
the strength increase ratio is given proportional to OCR0.8. Eq. (13) implies that Ne and Nk are essentially
the same parameter, since sF can be regarded constant
for given clay. The difference is that the Ne approach
does not involve the correction procedure of the total overburden stress σv0 without a need of undisturbed soil
sampling.
Figure 4. Correlation between λs and Rfe.
5 VERIFICATION
Four verification sites (Hwajeon, Songdo, Kwangyang, and Pohang sites) in Korea were selected and examined for the validation of the Ne method.
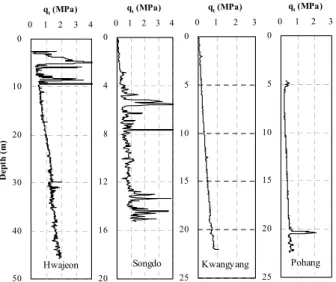
Groundwater tables were at depths of 0.75, 0.8, 0.0, and 1.8 m for Hwajeon, Songdo, Kwangyang, and Pohang sites, respectively. All the sites were located at different areas with different soil conditions. Hwajeon site was located relatively close to the original test site near Busan and consisted of thick deltaic marine clays. In this site, a sedimentary sand deposit with thickness of 5 – 10 m existed near the surface underlain by sedimentary silty clays (i.e., CL or CH) down to depths equal to around 20 – 45 m. Soils in Songdo site consisted of clayey silt (ML) and silty clay (CL) with local existence of sand seams. For Kwangyang site, highly compressible fat clays were observed, containing considerable amounts of Montmorillonite with the activity (A) greater than 1.2. Pohang site showed somewhat exceptional soil conditions. An alluvial clay deposit of highly swelling potential was found with LL and e0 greater than 100 and 3.0, respectively. Typical
y = 6.164x-0.9866 0 5 10 15 20 0 1 2 3 4 5 6
R
fe(%)
λ
sCPT results obtained from these sites are given in Figure 5.
For all the verification sites, measured and calculated undrained shear strengths su were obtained and
compared. Measured su values were obtained from FVT
while Ne = 16 presented in this study was adopted for
the calculation of su using qt values. Measured versus
calculated su values are shown in Figure 6. As shown in
Figure 6, reasonable match between measured and calculated su values is observed with differences of
around ±30%. For Kwangyang and Pohang sites, which showed exceptionally compressible and soft soil conditions, calculated su values with Ne = 16 were also
in good agreement with measure su values.
Figure 5. CPT profile at verification sites.
Figure 6. Measured and calculated su values.
In order to further verify the proposed method, several case examples were selected from the literature and used in the comparison. Table 2 shows selected examples from the literature. As can be seen in Table 2, test sites for selected examples were located worldwide and consisted of different types of clays. These examples were selected since all the necessary parameters including the cone resistance qt, the in-situ
pore pressure ui, and the undrained shear strength su
were available. The other reason for the selection is that the selected sites were located at entirely different areas from the original test site where the proposed method was developed.
Figure 7 shows values of su measured and calculated
for each case example. In Figure 7, calculated su values
were obtained using Ne = 16 as for others. As shown in
Figure 7, reasonable match with approximately ±30% difference is observed, validating the new CPT-based methodology.
Table 2. Location of example sites.
Location Soil type Literature Sweden Clay Ahnberg (1995) USA Clay Murray and Benoit (1995) Australia Soft silty clay Thom et al. (1995) Slovenia Soft clay Ajdic and Gaberc (1995) USA Varved clay DeJong et al. (2004) Australia Clay Chung and Randolph (2004) Italy Clay Fioravante (2004)
Poland Stiff silty clay Bednarczyk and Sandven (2004)
Figure 7. Measured and calculated su values at
additional example sites. 0 10 20 30 40 50 0 1 2 3 4 qt (MPa) De pt h ( m ) 0 4 8 12 16 20 0 1 2 3 4 qt (MPa) 0 5 10 15 20 25 0 1 2 3 qt (MPa) 0 5 10 15 20 25 0 1 2 3 qt (MPa)
Hwajeon Songdo Kwangyang Pohang
0 20 40 60 80 100 0 20 40 60 80 100
s
u(kPa) (measured)
s
u(k
P
a) (c
al
cu
la
te
d
)
+ 30% -30% 0 20 40 60 80 100 0 20 40 60 80 100s
u(kPa) (measured)
s
u(k
P
a) (c
al
cu
la
te
d
)
+30% -30%6 CONCLUSIONS
A new CPT-based approach for the estimation of su
was presented. This approach is based on the cone resistance qt and in-situ pore pressure with the effective
cone factor. A special attention was given to develop a method that requires no additional experimental process for the soil sampling and laboratory testing. For this purpose, a test site of the marine clay deposit was selected and test results obtained at this site were adopted for the investigation.
From the correlation analysis using various CPT measurements including qt, fs, and Rfe, it was found that
the undrained shear strength su is essentially governed
by the cone resistance qt. Based on this observation, a
new CPT-based method for the estimation of su in terms
of the cone resistance qt and in-situ pore pressure ui was
examined. The effective cone factor Ne that correlates
the undrained shear strength su to the cone resistance qt
and in-situ pore pressure ui was presented. From the
correlation analysis using the test results, it was found that Ne is equal to around 16.
In order to verify the new CPT-based method, additional verification sites in Korea and several case examples from the literature were selected and examined. For all the verification sites and case examples, it was found that values of su estimated from
the Ne method showed good agreement with measured
values of su. REFERENCES
1) Ajdic, I. and Gaberc, A. (1995). “National report on cone penetration testing in Slovenia.” Proc. Int. Sym. on Cone Penetration Testing CPT’95, Linkoping, Sweden, Vol. 1, 201-210.
2) Ahnberg, H. (1995). “Use of CPT tests in very soft soils” Proc. Int. Sym. on Cone Penetration Testing CPT’95, Linkoping, Sweden, Vol. 2, 619-624.
3) Baligh, M. M. (1975). “Theory of deep static cone penetration resistance.” Rep. No. R75-56, Dept. of Civ. and Envir. Eng., Massachusetts Institute of Technology, Cambridge, Mass. 4) Baligh, M. M. (1985). “Strain path method.” J. Soil Mech. and
Found. Div., ASCE, 111(9), 1108-1136.
5) Bednarczyk, Z. and Sandven, R. (2004). “Comparison of CPTU and laboratory tests interpretation for Polish and Norwegian clays.” Proc. 2nd Int. Conf. on Site
Characterization ISC’2, Porto, Portugal, Vol. 2, 1791-1798. 6) Chang, M. (1995). “Cone penetration testing in Singapore and
Malaysia.” Proc. Int. Sym. on Cone Penetration Testing CPT’95, Linkoping, Sweden, Vol. 1, 193-200.
7) Chung, S. F. and Randolph, M. F. (2004). “Penetration resistance in soft clay for different shaped penetrometer.” Proc. 2nd Int. Conf. on Site Characterization ISC’2, Porto, Portugal,
Vol. 1, 671-677.
8) DeJong, J. T., Yafrate, N. J., DeGroot, D. J., and Jakubowski, J. (2004). “Evaluation of the undrained shear strength profile in soft layered clay using full-flow probes.” Proc. 2nd Int. Conf.
on Site Characterization ISC’2, Porto, Portugal, Vol. 1, 679-686.
9) Fioravante, V. (2004). “Dynamic characterization of alluvial deposit in urban area.” Proc. 2nd Int. Conf. on Site
Characterization ISC’2, Porto, Portugal, Vol. 2, 1805-1812. 10) Lunne, T., Robertson, P. K., and Powell, J.J.M. (1997). Cone
Penetration Testing. E&FN SPON, London, UK.
11) Marsland, A. (1974). “Comparison of the results from static penetration tests and large in situ plate tests in London clay.” Proc. Eur. Sym. on Penetration Testing, Stockholm, Sweden, 245-252.
12) Meyerhof, G. (1951). “The ultimate bearing capacity of foundations.” Geotechnique, 2(4), 301-331.
13) Murray, R. F. and Benoit, J. (1995). “Evaluationof the Wissa piezocone in a marine clay deposit” Proc. Int. Sym. on Cone Penetration Testing CPT’95, Linkoping, Sweden, Vol. 2, 239-244.
14) Pane, V., Brignoli, E., Manassero, M., and Soccodato, G. (1995). “Cone penetration testing in Italy.” Proc. Int. Sym. on Cone Penetration Testing CPT’95, Linkoping, Sweden, Vol. 1, 101-114.
15) Randolph, M. and Murphy, B. (1985). “Shaft capacity of driven piles in clay.” Proc. Offshore Technology Conf., Vol. 1, Houston, US, 371-378.
16) Rocha-Filho, P. and Schnaid, F. (1995). “Cone penetration testing in Brazil – National report.” Proc. Int. Sym. on Cone Penetration Testing CPT’95, Linkoping, Sweden, Vol. 1, 29-42.
17) Sandven, R., Orbech, T., and Lunne, T. (2004). “Sample disturbance in highly sensitive clay.” Proc. 2nd Int. Conf. on
Site Characterization ISC’2, Porto, Portugal, Vol. 2, 1861-1868.
18) Tanaka, M. and Tanaka, H. (2004). “An examination of the engineering properties and the cone factor of soils from East Asia.” Proc. 2nd Int. Conf. on Site Characterization ISC’2,
Porto, Portugal, Vol. 1, 1019-1024.
19) Teh, C. I. and Houlsby, G. T. (1991). “An analytical study of the cone penetration test in clay.” Geotechnique, 41(1), 17-34. 20) Terzaghi, K. (1943). Theoretical soil mechanics. John Wiley
and Sons, Inc., New York, US.
21) Thom, M. J., Clarke, S., Nolan, D. K., Parkin, A., Jones, S. R. (1995). “Australian national report on cone penetration testing” Proc. Int. Sym. on Cone Penetration Testing CPT’95, Linkoping, Sweden, Vol. 1, 3-12.
22) Vesic, A. S. (1972). “Expansion of cavities in infinite soil mass.” J. Soil Mech. and Fond. Divi., ASCE, 98(3), 265-290. 23) Yu, H. S. (1993). “Discussion on: singular plastic fields in
steady penetration of a ridge cone.” J. Appl. Mech., 60, 1061-1062.
24) Yu, H. S. and Mitchell, J. K. (1998). “Analysis of cone resistance: Review of methods.” J. Geotech. and Geoenv. Eng., ASCE, 124(2), 140-149.
25) Yu, H. S., Herrmann, L. R., and Boulanger, R. W. (2000). “Analysis of steady cone penetration in clay.” J. Geotech. and Geoenv. Eng., ASCE, 126(7), 594-605.