The resonant interaction between
anions or vacancies in ZnON
semiconductors and their effects on
thin film device properties
Jozeph Park
1,5, Hyun-Jun Jeong
2, Hyun-Mo Lee
2, Ho-Hyun Nahm
3,4,6& Jin-Seong Park
2Zinc oxynitride (ZnON) semiconductors are suitable for high performance thin-film transistors (TFTs) with excellent device stability under negative bias illumination stress (NBIS). The present work provides a first approach on the optimization of electrical performance and stability of the TFTs via studying the resonant interaction between anions or vacancies in ZnON. It is found that the incorporation of nitrogen increases the concentration of nitrogen vacancies (VN+s), which generate larger concentrations of free electrons with increased mobility. However, a critical amount of nitrogen exists, above which electrically inactive divacancy (VN-VN)0 forms, thus reducing the number of carriers and their mobility. The presence of nitrogen anions also reduces the relative content of oxygen anions, therefore diminishing the probability of forming O-O dimers (peroxides). The latter is well known to accelerate device degradation under NBIS. Calculations indicate that a balance between device performance and NBIS stability may be achieved by optimizing the nitrogen to oxygen anion ratio. Experimental results confirm that the degradation of the TFTs with respect to NBIS becomes less severe as the nitrogen content in the film increases, while the device performance reaches an intermediate peak, with field effect mobility exceeding 50 cm2/Vs.
Amorphous oxide semiconductors (AOSs) such as In-Ga-Zn-O (IGZO) with high carrier mobility are good alternatives to their amorphous silicon counterparts for the fabrication of high performance thin-film transistors (TFTs)1, especially in the field of flexible electronics or flat panel displays. However, the trade-off between
elec-trical performance and stability2 under negative bias illumination stress (NBIS) is usually the main hurdle that
delays the implementation of such devices into tangible products. For instance, high performance AOS TFTs that exhibit high field effect mobility undergo relatively large shifts in threshold voltage when subjected to negative gate bias in the presence of visible light. The latter condition emulates the operating environment of a switching element in an operating active matrix liquid crystal display (AMLCD) with a backlight unit, or in a transparent active matrix organic light emitting diode (AMOLED) TFT array exposed to ambient illumination.
In AOS TFTs, the field effect mobility is the principal metric of device performance, which is greatly influ-enced by the amount of free carriers and their effective mass in the semiconductor. The number of free electrons is determined by the concentration of shallow donor-like defects such as oxygen vacancies and/or hydrogen impurities, and the conduction band dispersion of the host material affects the carrier effective mass. On the other hand, the degradation of TFTs under NBIS is reported to originate from the metastable deep-to-shallow electronic transitions of bistable centers in the semiconductor3–8. The most trivial way to improve the reliability of
oxide semiconductor devices is therefore to reduce or deactivate such electrical defects. For the latter purposes, several methods may be employed to decrease the defect density either during the semiconductor synthesis or
1Department of Materials Science and Engineering, KAIST, Daejeon, 34141, Republic of Korea. 2Department of
Materials Science and Engineering, Hanyang University, Seoul, 04763, Republic of Korea. 3Center for Correlated
Electron Systems, Institute for Basic Science (IBS), Seoul, 08826, Republic of Korea. 4Department of Physics and
Astronomy, Seoul National University (SNU), Seoul, 08826, Republic of Korea. 5Present address: R&D Center,
Samsung Display, Yongin, 17113, Republic of Korea. 6Present address: Graduate School of Nanoscience and
Technology, Korea Advanced Institute of Science and Technology, Daejeon, Republic of Korea. Jozeph Park and Hyun-Jun Jeong contributed equally to this work. Correspondence and requests for materials should be addressed to H.-H.N. (email: [email protected]) or J.-S.P. (email: [email protected])
Received: 28 September 2016 Accepted: 11 April 2017 Published: xx xx xxxx
in the associated device fabrication processes. Yet, such engineering procedures also suppress the formation of shallow donors that contribute to the total free carrier density, resulting in relatively inferior charge transport properties. In order to obtain a balance between performance and stability of AOS TFTs, a delicate control of chemical components or electronic defects is therefore mandatory.
Various electronic centers responsible for the degradation of oxide semiconductor devices have been suggested by different research groups, examples of which include bistable native defects and impurities such as oxygen vacancy (VO)3, peroxide (O22−)4, interstitial oxygen (Oi)5, undercoordinated In (In*)6, and interstitial or
substi-tutional hydrogen (Hi7 or HO7, 8). When they capture hole carriers, deep-to-shallow-like transitions occur by the
following reactions: VO0 + 2 h+ → VO2+, 2O2− + 2 h+ → O22−, Oi2− + 2 h+ → Oi0, (In*-M)2− + 2 h+ → In* (M:
tran-sition metal atom), Hi− + 2 h+ → Hi+, and HDX− + 2 h+ → HO+ (HDX: H-related DX center). Conversely, when
electrons are captured, reverse transitions take place: VO2+ + 2e− → VO0, O22− + 2e− → 2O2−, Oi0 + 2e− → Oi2−,
In* + 2e− → (In*-M)2−, H
i+ + 2e− → Hi−, and HO+ + 2e− → HDX−. Many experimental and theoretical studies
have been reported up to date on how to reduce the concentration of the above electronic defects in amorphous oxide semiconductors9–15. In particular, to understand the degradation of TFT devices under NBIS, an early V
O
model has led researchers to focus on the passivation of the VO related imperfections9–14, the incorporation of
substitutional nitrogen in oxygen sites being one of a few effective methods2, 13, 14.
Recently, amorphous zinc oxynitride (ZnON) was experimentally demonstrated to be a semiconductor that can provide both high device performance and stability2. It was proposed that deep V
O defects may become
elec-trically inactive if the valence band minimum of the host material were raised above the VO levels, in the presence
of abundant nitrogen anions. The resulting nitrogen-rich semiconductor would exhibit a band structure close to that of zinc nitride (Zn3N2) so that the VO defects would not form carrier traps within the forbidden band gap,
and thus influence the associated device reliability to a much lesser extent16, 17. However, the exact mechanism of
VO passivation by nitrogen in ZnON has not been elucidated to the best of our knowledge. Further studies are still
required to clarify if nitrogen may actually replace an oxygen site13, 14 and one needs to verify if the V
O defects may
be deactivated by having the valence band minimum of the semiconductor raised above the VO levels2. From a
point defect perspective, the following issues may be of interest: (i) Where is the VO level located (deep or shallow)
when nitrogen is incorporated into ZnO? (ii) Then, how do nitrogen vacancies (VN) and oxygen vacancies (VO)
differ in terms of formation enthalpy and deep-to-shallow electronic transitions? (iii) How are the valence band tail (VBT) states (responsible for the formation of peroxides) affected? Moreover, in a nitrogen-rich environ-ment with a high probability of finding two neighboring nitrogen anions or vacancies, which of a closely-paired N-divacancy complex (VN-VN) and a nitrogen dimer (N-N) is more likely to form? Understanding the above
physical phenomena is therefore of the essence in order to successfully tailor the performance and stability of ZnON thin-film transistors.
The present work begins with a study on the structure of nitrogen-related defects in amorphous ZnON, based on first-principles density-functional-theory (DFT) calculations. The results indicate that (i) shallow single-donor VN defects (with a deep-to-shallow-like VN+-VN3+ electronic transition similar to that of VO) form more easily
than deep double-donor VO because the Zn-N binding energy is smaller than that of a Zn-O bond, (ii) the highest
occupied levels of the VN+ and VO0, which are anticipated to be photo-excited, are located near the VBT states
above the valence band maximum (VBM), and (iii) the formation of O-O dimers (peroxides) that induce device degradation under NBIS becomes less likely as the nitrogen content increases. The presence of N-O dimers is not expected, considering the formation energetics. Also, although the creation of N-N dimers is energetically most favorable compared to O-O and N-O complexes, they are not likely to be generated within the anion concentra-tion ranges that allow the realizaconcentra-tion of operating thin film transistors.
If the N concentration increases, the number of shallow VN+ defects that contribute free electrons also
increases, thus enhancing the carrier mobility of the semiconductor18, 19. Yet, above a critical N content, the
for-mation of electrically inactive (VN-VN)0 pairs is induced through a resonant interaction between two neighboring
VN vacancies. The divacancies have an effect of annihilating the electrically active VN+ defects, which
dimin-ishes the total carrier concentration. Therefore, a maximum amount of nitrogen anions is anticipated in ZnON, above which the electron mobility begins to decrease. Since the formation of O-O dimers is suppressed with increasing N content (making it less likely for an oxygen anion to find a neighboring oxygen anion), peak device performance with reasonable stability is expected to be achieved near this critical N concentration. To verify the theoretical predictions, TFTs incorporating amorphous ZnON active layers are fabricated and evaluated. It is found that indeed a O/N anion ratio of approximately 1.6 in the ZnON semiconductor results in the best balance between field effect mobility and device stability under negative bias illumination stress (NBIS).
Results
Mobility perspective: DFT study on vacancies and divacancies.
Despite controversy, oxygen vacan-cies (VOs) in amorphous InGaZnO4 have been commonly regarded as both shallow and deep defects20, andnitro-gen vacancies (VNs) in crystalline Zn3N2 as major shallow donors (VN+s)21. Among them, the shallow types have
been considered as the main source of the high field effect mobility due to their ability to donate free electron car-riers, while the deep VOs having a deep-to-shallow electronic transition, VO0 + 2 h+ → VO2+, have been suggested
to act as the main positive (hole) charge traps that induce device degradation under NBIS3, 20. Several research
groups proposed that nitrogen may passivate the electrically active VO defects in amorphous InGaZnO413, 14 and
ZnO2. Since anion vacancies in the amorphous ZnON may act as the sources of free carriers or hole traps, the
energetics of VO and VN formation was studied. Individual oxygen and nitrogen vacancies were generated by
respectively removing an oxygen and a nitrogen atom from the amorphous ZnON supercell. For the sake of sta-tistical analysis, all possible vacant sites in the supercell were evaluated by static DFT calculations.
The formation enthalpy values of all possible VO and VN configurations in amorphous ZnON were calculated
based on the following equations22: Ω( )V =E V( )−E +µ +qE
nonstoichiometric amorphous ZnON supercell including q-charged Vaq (a = N or O), E0 the total energy of a
stoichiometric amorphous supercell, μa the chemical potential of either N or O, and EF the electronic chemical
potential. The chemical potentials of nitrogen and oxygen (μN and μO, respectively) were evaluated under N-rich
and O-rich (O-poor) conditions, respectively, with μN = E(N2)/2 and μO = E(O2)/2 (E(O2)/2 + ΔμO(=δ)).
Because Zn-N bong is relatively weak (the formation enthalpy of crystalline Zn3N2 is much smaller (−0.23 eV23)
than that of crystalline ZnO (−3.64 eV8)), the variation of the nitrogen chemical potential (Δμ
N) is negligible
with respect to that of the oxygen chemical potential (ΔμO). Therefore the formation enthalpies of the VO defects
are relatively more susceptible to the film growth conditions (δ ≤ ΔμO ≤ 0: ΔμO = 0 and ΔμO = δ for O-rich and
O-poor conditions, respectively). The average maximum value (δ) of the ΔμO is calculated to be approximately
−2.58 eV, based on the following equation: δ=(Eave−(n µ +n µ +n µ ))/n
Zn Znbulk N Ngas O Ogas O
0 (assuming that
µN=µNgas since ΔμN is negligible), where E0ave is the average total energy of the amorphous stoichiometric supercells, µZnbulk, µ
Ngas, and µOgas are, respectively, the total energies of bulk Zn metal, an isolated N atom in the gas phase, and an isolated O atom in the gas phase, and nZn, nN, and nO are, respectively, the numbers of Zn, N, and O
atoms included in the supercells. All neutral VO0 defects and singly charged VN+ nitrogen vacancies were
com-pared while maintaining EF positioned at the CBM of amorphous ZnON.
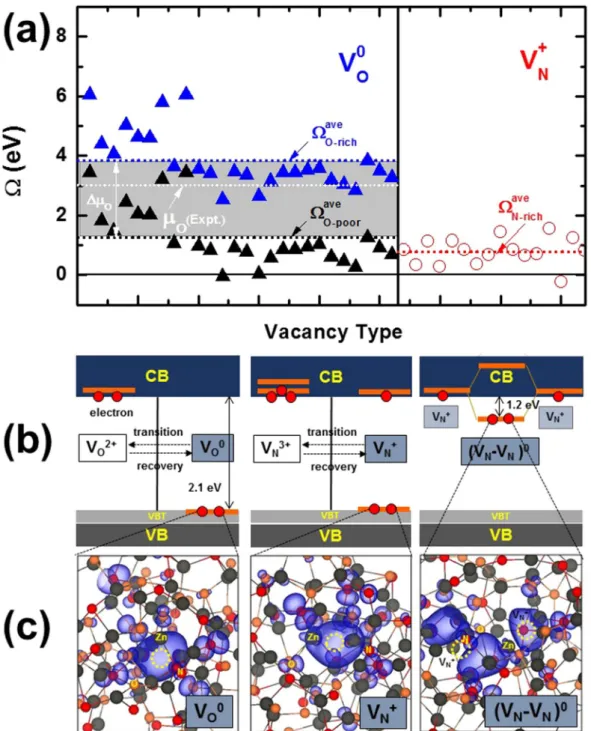
Figure 1a shows the calculated formation enthalpies of the VO0 and VN+ defects in amorphous ZnON. For
VO, opposite to the fact that deep and shallow levels may coexist in amorphous InGaZnO43, 20, all VO levels in
amorphous ZnON are located deep near the VBT states. This may be understood because the resonant interaction between the somewhat perturbed dangling Zn 4 s orbitals around the VO in amorphous ZnON is stronger than
that in amorphous InGaZnO4 with the disorder of multi-cations. The VO defect in ZnON is found to undergo
a deep-to-shallow structural transition as shown in the leftmost diagram of Fig. 1b, in a way similar to the deep VO levels in amorphous InGaZnO4, when the deep level shown in the leftmost image of Fig. 1c is occupied by
two holes (see density of states (DOS) in Figure S1). The transition (Eα) and recovery (Eβ) between VO0 and VO2+
occurs easily with negligible energy barriers. On the other hand, the VN defect is found to be stable in both VN+
and VN3+ states, as shown in the middle of Fig. 1b (see DOS in Figure S2). When EF is located near the CBM,
the VN+ state becomes stable, acting as a shallow donor in amorphous ZnON. When two electrons are excited
from the deep VN+ state shown on the middle of Fig. 1c, the structural breathing-like relaxation of the VN is also
accompanied with a deep-to-shallow electronic transition, similar to what is observed in the VO. In this case, the
calculated transition and recovery barriers, Eα and Eβ, are also negligible.
A remarkable aspect is that the average formation enthalpy of the VN defects is much lower than that of the VO
defects, considering the oxygen chemical potential (μO(Expt.))24 under the experimental film growth conditions
(temperature (T = about 300 K) and gas partial pressure (p = 5 mTorr)) to obtain amorphous ZnON samples with various O/N compositions (shown by the white shot-dot line in Fig. 1a). Furthermore, even in extremely O-poor condition, the average formation enthalpy of the VN defects is smaller than that of the VO defects (see Fig. 1a).
Therefore as the N content increases, the number of shallow VN+ donors increases, which enhances the electron
mobility in ZnON by generating more free electrons.
The possibility of obtaining divacancies by the resonant interaction between neighboring VN defects is studied
next, considering the fact that the concentration of VN increases considerably with the incorporation of a large
number of N anions. For this purpose, an extra VN was introduced by removing a nitrogen atom in the supercell
containing an initial VN. The binding energy of both VN donors was calculated to be largely exothermic (1.29 eV)
using the following equation, (2 (E V+)+2 )e− −(E +E V V(( ‑ ) ))
N 0 N N 0 . The divacancy originates from the
forma-tion of a VN-VN bonding state induced by the resonant interaction between the two shallow VN states above the
CBM (as shown on the rightmost image of Fig. 1b), and thus the divacancy level is located relatively deeper at about 1.2 eV below the CBM (as shown on the right in Fig. 1c and DOS in Figure S3). When two free electrons are present, two shallow VN+ defects combine to create an electrically inactive divacancy complex:
2VN+ + 2e− → (VN-VN)0. The latter has an effect of annihilating the electrically active VN+ vacancies, which is
anticipated to reduce the charge transport ability of the ZnON semiconductor owing to a reduction in carrier density. It is thus anticipated that as the amount of nitrogen in ZnON increases, the mobility will reach a maxi-mum value at a certain nitrogen concentration, above which (VN-VN)0 pairs begin to form readily.
Stability perspective: DFT study on anion-anion dimers.
It is well-known that when two holes are captured in the valence band tail (VBT, with O-O ppσ* character) of amorphous InGaZnO4, peroxides form
(2O2− + 2 h+ → O
22−) and stabilize by virtue of large lattice relaxations driven by a strong resonant interaction
between two O-2p orbitals5. The O-O ppσ* level is subsequently raised above the CBM (donating two free
elec-trons to the host). The recovery process by peroxide dissociation (O22− + 2e− → 2O2−) requires a relatively large
amount of energy, since two electrons must fill-in the widely spread O-O ppσ* level above the CBM. The study of
the electronic states on top of the valence band may be extended to ZnON semiconductors, where the effects of nitrogen become important regarding the formation of peroxide-like anion-anion dimers.
Figure 2a shows that since the band-gap energy of ZnON is reduced by the presence of N-2p orbitals, the high-est valence band states in amorphous ZnON are characterized by the mixed ppσ* states based on O-2p and N-2p
orbitals, in contrast with amorphous InGaZnO4 where only O-O ppσ* states are dominant. Figure 2b,c consist of
two typical charge density plots of the VBT states in amorphous ZnON supercells, in which N-O and N-N dimers are expected to form, respectively. Three types of hole-induced anion dimers may thus be proposed in ZnON: O-O, O-N, and N-N.
First, for the O-O case, the formation of peroxides is less favorable in ZnON than in amorphous InGaZnO4,
because the O-2p state is located rather deep below the VBT states, resulting in a relatively large transition energy barrier (required to have two holes occupy the corresponding ppσ* state). As the nitrogen concentration
anion to find a neighboring oxygen anion decreases considerably. For N-O dimers, it may be schematically under-stood from the relatively small energy gain of the N-O hybridization in Fig. 2d that the N-O dimerization is not likely to take place, because the N-O ppσ bond energy in amorphous ZnON is weaker than that of a resonant O-O ppσ bond in amorphous InGaZnO44, 15. Therefore one may suspect that the concentration of O-O (N-O) dimers
Figure 1. (a) When the Fermi level is located at the conduction band minimum (CBM), the formation enthalpy values of both shallow VN+ (red open circles) and deep VO0 defects (blue and black solid triangles for O-rich and
O-poor conditions, respectively) are shown for all anion vacancies in the selected amorphous ZnON (as an example, with an O/N ratio of 1.625). Red, blue, and black short-dotted lines indicate the average formation enthalpy values of N-rich VN+, O-rich VO0, and O-poor VO0 (ΩaveN rich− , ΩO richave− , and ΩO poorave− ), respectively. To compare the formation enthalpy values of the VN+ defects with those of the VO0 defects under experimental
growth conditions of amorphous ZnON, the experimental oxygen chemical potential, μO(Expt.) = μO(T, p), was
estimated at the growth temperature (T = about 300 K) and gas pressure (p = 5 mTorr)24. (b) The electronic
defect levels of VN, VO, and nitrogen divacancy (VN-VN)0 are schematically depicted, respectively. VB, VBT, and
CB stand for valence band, valence band tail, and conduction band, respectively. (c) Charge density plots of the highest occupied deep levels for VN+, VO0, and (VN-VN)0 are shown, respectively, with an isosurface value of
will be substantially low (without any apparent influence) in ZnON semiconductors, compared to the generally reported amorphous oxide semiconductors. Finally, when two nearest N anions are present, a strong resonant interaction is induced, similar to that when peroxides form in amorphous InGaZnO4, as shown by a schematic
description in Fig. 2e. N-N dimerization in amorphous ZnON may occur if the nearest N anions pair up. With increasing nitrogen content, a high probability of finding adjacent nitrogen anions thus promotes the formation of N-N dimers.
In order to confirm the above concepts by DFT calculations, two hole carriers were inserted in the amorphous ZnON supercells, and the possibility of anion-anion dimerization was investigated. As expected, the occurrence of peroxides and N-O dimers in proximity of the N anions is negligible in all ZnON supercells. This is because Figure 2. (a) For stoichiometric amorphous ZnON with O/N = 1.625 anion ratio as an example, the total density of states (DOS), inverse participation ratio (IPR) (indicating the degree of electronic localization), and partial DOS (PDOS) for O-2p, N-2p, and Zn-4s are shown. Because it is difficult to determine both the valence band maximum (VBM) and valence band tail (VBT) states of amorphous ZnON without being able to consider a crystalline ZnON structure as reference, the VBM and VBT distributions were evaluated through the analysis of the high inverse participation ratio (IPR) values near the top valance bands. For (b) the N-O ppσ* and (c)
the N-N ppσ* states, charge density plots of the top valence band states in amorphous ZnON are shown with
an isosurface value of 1.25 × 10⁻⁵ Å−3. The green dotted line is a bond direction along which a dimer is formed
when two holes are captured at the top valence band state. Schematic formation mechanisms for the character of the top valence band states in amorphous ZnON are also shown for (d) the N-O ppσ* and (e) the N-N ppσ*
the O-O or N-O dimerizations from individual anions involve relatively high transition energy barriers (Eα) and
energetics, which can be overcome only when excess holes are actively present in ZnON. On the other hand, as the structural transition from 2O2− to peroxide (O
22−) occurs without any apparent (or a small) energy barrier
in InGaZnO4, the atomic and electronic structures of N-N dimers in amorphous ZnON are similar to those of
peroxides in amorphous InGaZnO4. In the hole-injected state, the N-N structure is found to be more stable by
approximately 0.96~2.89 eV (with a somewhat broad energy distribution) than the original structure in which the two N anions remain well separated. While the transition energy barriers, Eαs, of the N-N formation reaction are
found to be smaller than 0.1 eV, the recovery energy barriers, Eβs, of the dimer dissociation reaction are relatively
large (~0.83 eV). Therefore if the N concentration increases significantly, the N-N dimers may not be neglected when discussing the origins of device instability under NBIS. The above results strongly suggest that the forma-tion of anion-anion dimers is of critical importance regarding the degradaforma-tion of ZnON devices under long-time NBIS, while the fast transitions of VN+ and VO0 defects are expected to induce temporary effects only.
Mobility and stability of ZnON-based thin-film transistors: Experimental confirmation.
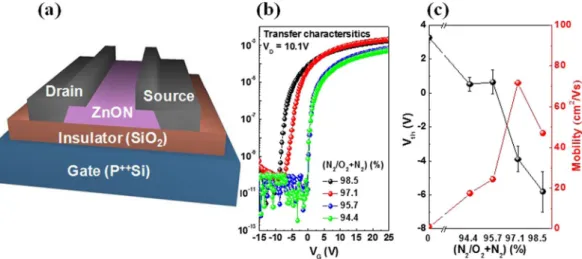
The actual anion contents in the ZnON films grown with different gas flow rates were measured by Auger electron spectroscopy (AES), and are listed in Table 1.Figure 3a shows the schematic structure of a unit TFT device incorporating a ZnON active layer. Figure 3b represents the transfer characteristics that show the drain current (ID) with respect to the gate voltage (VG), as a
function of the N2/(N2 + O2) flow rate ratio during ZnON growth. The field effect mobility (μFE) and threshold
voltage (Vth) values with respect to the N2/(N2 + O2) flow rate ratio are plotted in Fig. 3c. Note that as the nitrogen
content increases, the mobility reaches a peak value at N2/(N2 + O2) = 97.1%, and decreases with further nitrogen
gas incorporation, just as was expected in the DFT calculations regarding the formation of (VN-VN)0 pairs.
Figure 4a illustrates the TFT evaluation scheme, involving a monochromatic source of green light, and an evacuated chamber in which the device is positioned in order to exclude all environmental artifacts such as mois-ture permeation. Figure 4b shows the time evolution of the transfer curves of a ZnON TFT fabricated with N2/
(N2 + O2) = 94.4%, under NBIS for a total stress time of 3,000s. Figure 4c shows a plot of total Vth shift (ΔVth) of
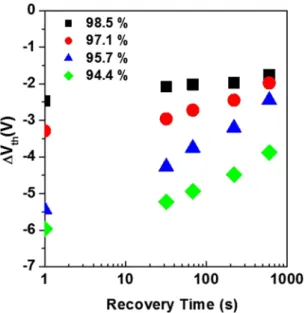
the devices under NBIS, with respect to the nitrogen gas flow rate during ZnON growth. Note that as the nitrogen incorporation increases, the amount of device degradation under NBIS is reduced. Figure 5 consists of the change in ΔVth values of the devices after NBIS, as they are left to recover without any light or voltage bias. While the
TFTs based on ZnON active layers grown with N2/(O2 + N2) gas flow rates of 98.5, 97.1 and 95.7% exhibit
rela-tively fast recovery to ΔVth values close to −2 V, the device containing the highest amount of oxygen (grown with
N2/(O2 + N2) Gas
Flow Rate
Anions in film (AES)
O (%) N (%) O/N
94.4 35.4 9.4 3.77
95.7 31.2 12.9 2.42
97.1 26.5 16.5 1.61
98.5 23.0 18.4 1.25
Table 1. Relative oxygen to nitrogen anion ratio in the ZnON films analyzed by Auger electron spectroscopy (AES), with respect to the incorporated nitrogen gas flow rate ratio [N2/(O2 + N2)] during growth.
Figure 3. (a) Schematic diagram of a ZnON TFT device. (b) Transfer characteristics of the devices incorporating ZnON active layers grown with different N2/(N2 + O2) gas flow rate ratios. (c) Field effect
mobility (μFE) and threshold voltage (Vth) with respect to the N2/(N2 + O2) gas flow rate ratios used during
N2/(O2 + N2) = 94.4%) undergo relatively slow recovery, reaching a final ΔVth value of approximately −3.86 V.
The ΔVth values during NBIS and after the stress test are listed in Table 2.
Discussion
The field effect mobility, μFE, of amorphous ZnON-based TFTs increases as the free carrier density increases.
The latter is determined by the concentration of N anions in the ZnON semiconductor. As the N2/(N2 + O2)
flow rate ratio is increased, the total N content increases, which results in relatively low electron effective mass in the ZnON layer2. An important finding is the fact that the present ZnON-based TFTs exhibit peak μ
FE at a
critical N content. Above this value, the sudden decrease of the μFE observed in the samples may be theoretically
understood by either the decrease of free carriers (considering the scattering mechanisms suggested as percola-tion25, hopping26, or cation disorder models27) or another mechanism (i.e., further ionized impurity scattering
well-known in general semiconductors). In this regard, the density of free electrons in the grown amorphous ZnON samples was studied as a function of N content through Hall measurements. As the N2/(N2 + O2) gas
flow rate ratio increases in the following order: 94.4, 95.7, 97.1 and 98.5%, the corresponding films’ free carrier density values are 9.29 × 10¹⁷, 2.58 × 10¹⁸, 4.92 × 10¹⁹ and 1.44 × 10¹⁹, respectively. The sudden decrease in μ
FE at
N2/(N2 + O2) = 97.1% is thus highly likely to occur from the decrease in free carrier density, which indicates that
the concentration of shallow donor-like defects such as vacancies and/or hydrogen impurities must have been reduced. Hydrogen impurities are generally well known to act as effective shallow donors in various oxide sem-iconductors. However, in the present work the electrical properties of the ZnON layers are controlled by the N2/
(N2 + O2) flow rate ratio during ZnON growth without intentional hydrogen incorporation, therefore vacancies
should be regarded as the major source of free carriers. Here, the nonlinear relationship between mobility and carrier concentration complies well with the formerly reported transport theories such as percolation25, disorder
scattering27, and extended mobility edge28. From the DFT calculations, the existence of a peak mobility may be Figure 4. (a) Experimental setup for the measurement of ZnON TFT characteristics and stability, using a vacuum chamber and a green light source on top of the entire compartment. (b) Transfer characteristics under NBIS of a TFT based on ZnON grown with N2/(N2 + O2) = 94.4%. (c) Vth shift (ΔVth) under NBIS of the ZnON
concluded to originate from the reduction of VN+ donors by the formation of the electrically inactive nitrogen
divacancies, (VN-VN)0, above a critical N content.
Bistable centers provide a good explanation on the microscopic origins of the negative shifts in threshold voltage (Vth) under NBIS (see Fig. 6). As mentioned in the above sections, the instability of amorphous ZnON
devices with respect to NBIS is influenced by the VO0, VN+, or O-O dimers that undergo deep-to-shallow
tran-sitions. When two holes excited by light are captured at the deep levels, the transitions of VO0, VN+, or anion
dimers occur instantly without any apparent energy barrier (Eα < 0.1 eV): VO0 + 2 h+ → VO2+, VN+ + 2 h+ → VN3+,
or 2O2− + 2 h+ → O
22−. Then, two photo-excited free electron carriers may exist in a metastable state near the
CBM in the form of VO2+ + 2e−, VN3+ + 2e−, or O22− + 2e− complexes. The lifetime of the metastable states is
determined by the recovery energy barrier (Eβ). As shown in the above calculation results, the VN+ (VO0) defects
require relatively short recovery times from the VN3+ (VO2+) states; i.e. VN3+ + 2e+ → VN+ (VO2+ + 2e+ → VO0),
since Eβ < 0.1 eV. On the other hand, the O-O dimers (O22− + 2e+ → 2O2−) require relatively long recovery times
from the peroxide state, since Eβ ~ 0.97 eV4. Therefore, relatively high N contents favor the stability of ZnON
devices with respect to NBIS, because the formation of O-O dimers is suppressed by the presence of nitrogen anions in ZnON. This is consistent with the experimental results, in which the shifts in threshold voltage (ΔVth)
decrease with increasing nitrogen content in ZnON during NBIS. After all stresses are released, the device based on ZnON containing the largest amount of oxygen undergoes indeed slowest recovery.
Conclusions
In the present work, the influence of nitrogen-related defects on the electrical properties of amorphous ZnON was theoretically and experimentally examined. The resonant interaction between anions or anion vacancies is found to play a fundamental role in the formation of individual anion vacancies (VN and VO), anion-anion
divacancies, and anion-anion dimers. First-principles calculations indicate that the formation of shallow-donor nitrogen vacancies (VN+) is energetically favorable in comparison with that of deep-donor oxygen vacancies (VO0)
when EF is equal to the CBM. If the nitrogen content increases beyond a critical point, the formation of electrically
inactive (VN-VN)0 pairs decreases the free carrier density, so that a decrease in electron mobility is observed.
Regarding the formation of anion-anion dimers, the incorporation of nitrogen modifies the valence band structure in such a way to suppress the formation of O-O dimers, which are anticipated to be the major defects Figure 5. The change in ΔVth values after NBIS, as the devices are left to recover with the light turned off and
without any voltage bias. Note that the devices based on ZnON grown with the highest oxygen content exhibit slowest recovery, which agrees well with the theoretical predictions that O-O peroxides will result in relatively slow recovery from the photo-excited state.
N2/(O2 + N2) Gas Flow Rate
(O/N ratio by AES) ΔV3000s)th (NBIS, ΔVrecoveryth after
94.4 (3.77) −5.97 −3.88
95.7 (2.42) −5.44 −2.45
97.1 (1.61) −3.29 −1.98
98.5 (1.25) −2.47 −1.76
Table 2. Amount of Vth shift (ΔVth) during NBIS for 3000 seconds, and the ΔVth values after the devices are
left to recover from the bias stress for 1000 seconds, with respect to the O/N ratio in the films (measured by AES). The ΔVth values are all measured with reference to the initial Vth values before the NBIS stress.
that induce the degradation of ZnON TFTs under NBIS. Peroxides are less likely to form, since the probability of having neighboring O-O pairs decreases considerably as the nitrogen content increases. As a result, device stability is enhanced with increasing nitrogen concentration. From the above observations, it is reasonable to conclude that maximum performance and reasonable stability of TFTs based on amorphous ZnON semicon-ductors may be achieved by controlling the anion composition. Experimental results involving the fabrication of ZnON transistors indeed confirm this hypothesis, suggesting that an optimum O/N ratio of approximately 1.6 in the active layer may result in the highest field effect mobility, while the device reliability may be further improved with increasing nitrogen content.
Methods
First-principles calculations.
The Vienna Ab-initio Simulation Package (VASP)29 was used forfirst-prin-ciples calculations. Melt-and-quench molecular dynamics (MD) simulations were performed to obtain stoi-chiometric amorphous ZnON supercells based on the initial configurations derived from previously-studied amorphous ZnON structures2, and static density-functional-theory (DFT) calculations were adopted to
gener-ate the atomic and electronic structures of the stoichiometric amorphous structures, as well as cells containing vacancies, divacancies, and anion-anion dimers. Projector augmented wave (PAW) pseudopotentials30 were used,
along with a plane wave basis set with a kinetic energy cutoff of 400 eV and a 2 × 2 × 2 k-point mesh (on excep-tion, a 1 × 1 × 1 k-point mesh was used for the MD simulation). While the Perdew-Burke-Ernzerhof (PBE)31
exchange-correlation functional was applied during the MD simulations, the generalized gradient approxima-tion (GGA) plus U (GGA + U) funcapproxima-tional32 and the hybrid functional of the Heyd-Scuseria-Ernzerhof (HSE)
type33 with a screening parameter of 0.2 Å−1 were used in the static DFT calculations. A U value of 6.5 eV was
chosen, which is in good agreement with the former DFT calculations34, and the HSE mixing parameter was set
to describe an intermediate value, α = 0.355, between the mixing parameter of crystalline Zn3N2 (0.325) and ZnO
(0.375)8, 35.
To study the effects of the O/N anion ratio in stoichiometric amorphous ZnON, three types of supercells were constructed, each including a total number of 101, 92, and 100 atoms, with O/N = 3.80, 1.625, and 1.250 (N/(N + O) = 20.83, 38.09, and 44.44 at.%), respectively. For each type, at least four samples were generated by melt-and-quench MD simulations, as illustrated in Figure S4. In case of the charged defects, the supercell size effect was corrected by considering the spurious electrostatic interaction36. Since the GGA + U calculations tend
to underestimate the band gap values of amorphous ZnON, the band gap correction scheme was applied by considering the HSE hybrid calculations. The calculated band gaps of three type ZnON semiconductors with O/N = 3.80, 1.625, and 1.250 are, respectively, estimated to be about 1.38~2.53, 1.10~1.73, and 0.98~1.74 eV (see Figures S5–S7). These are in good agreement with experimentally determined optical band gaps of the stoichi-ometric amorphous ZnON semiconductors (1.27 eV, 1.01, and 0.92 eV, respectively). In case of the shallow VN
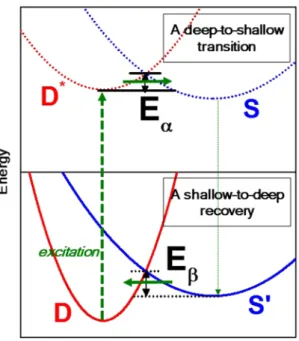
Figure 6. Schematic energy diagram for the hole-induced transition (top) and recovery (bottom) between deep and shallow states in bistable centers, explained in terms of configuration coordinates. D (D*) and S (S’),
respectively, indicate the deep states without (with) the excitation of electron carriers [i.e. VO0, VN+, and 2O2−
(VO0 + 2 h+, VN+ + 2 h+, and 2O2− + 2 h+)] and the shallow ones without (with) free electron carriers [i.e., VO2+,
VN3+, and O22− (VO2+ + 2e−, VN3+ + 2e−, and O22− + 2e−)]. Eα and Eβ are, respectively, the energy barriers for
defects, the band filling correction was applied to the neutral charge state (the neutral charged VN0 is regarded as
a singly charged VN+ with an electron in the conduction band minimum (CBM): VN+ + e−).
Materials and characterization.
The fabrication of ZnON layers involved the use of direct current (DC) reactive sputtering using a zinc (Zn) metal target, onto p++ Si/SiO2 (SiO2: 100 nm thick) substrates. The DC power
was 100 W and the process pressure was kept at 5 mTorr without intentional heating of the substrates. A mix-ture of Ar/O2/N2 gas was used to generate the plasma, and the nitrogen gas flow rate (N2/(N2 + O2)) was varied
from 94.4 to 98.5%. For both thin film analyses and TFT fabrication, the ZnON layer thickness was maintained between 30~35 nm. To fabricate the devices, the active islands were patterned using shadow masks. To form the source-drain electrodes, a 100 nm-thick indium tin oxide (ITO) film was sputter deposited every time, using shadow masks as well. The resulting channel width and length of the devices are 800 and 200 µm, respectively. The electrical properties of the TFTs were evaluated using a HP4155A semiconductor parameter analyzer in a vacuum ambient in order to exclude environmental effects such as moisture permeation into ZnON. For the NBIS tests, the gate voltage (VG) was maintained at −20 V, and the drain voltage (VD) was kept at +10.1 V.
References
1. Nomura, K. et al. Room-temperature fabrication of transparent flexible thin-film transistors using amorphous oxide semiconductors.
Nature (London) 432, 488–492, doi:10.1038/nature03090 (2004).
2. Kim, H.-S. et al. Anion control as a strategy to achieve high-mobility and high-stability oxide thin-film transistors. Sci. Rep. 3, 1459, doi:10.1038/srep01459 (2013).
3. Ryu, B., Noh, H.-K., Choi, E.-A. & Chang, K. J. O-vacancy as the origin of negative bias illumination stress instability in amorphous In–Ga–Zn–O thin film transistors. Appl. Phys. Lett. 97, 022108, doi:10.1063/1.3464964 (2010).
4. Nahm, H.-H., Kim, Y.-S. & Kim, D. H. Instability of amorphous oxide semiconductors via carrier-mediated structural transition between disorder and peroxide state. Physica. Status Solidi. B 249, 1277 (2012).
5. Robertson, J. & Guo, Y. Light induced instability mechanism in amorphous InGaZn oxide semiconductors. Appl. Phys. Lett. 104, 162102, doi:10.1063/1.4872227 (2014).
6. Nahm, H.-H. & Kim, Y. S. Undercoordinated indium as an intrinsic electron-trap center in amorphous InGaZnO4. NPG Asia Mater.
6, e143, doi:10.1038/am.2014.103 (2014).
7. Kang, Y. et al. Hydrogen Bistability as the Origin of Photo‐Bias‐Thermal Instabilities in Amorphous Oxide Semiconductors. Adv.
Electron. Mater. 1, 1400006, doi:10.1002/aelm.201400006 (2015).
8. Nahm, H.-H., Park, C. H. & Kim, Y. S. Bistability of hydrogen in ZnO: Origin of doping limit and persistent photoconductivity. Sci.
Rep. 4, 4124, doi:10.1038/srep04124 (2014).
9. Ji, K. H. et al. Effect of high-pressure oxygen annealing on negative bias illumination stress-induced instability of InGaZnO thin film transistors. Appl. Phys. Lett. 98, 103509, doi:10.1063/1.3564882 (2011).
10. Yang, B. S. et al. Role of ZrO2 incorporation in the suppression of negative bias illumination-induced instability in Zn-Sn-O thin film
transistors. Appl. Phys. Lett. 98, 122110, doi:10.1063/1.3571448 (2011).
11. Tsao, S. W. et al. Hydrogen-induced improvements in electrical characteristics of a-IGZO thin-film transistors. Solid State Electron. 54, 1497–1499, doi:10.1016/j.sse.2010.08.001 (2010).
12. Noh, H.-K., Park, J.-S. & Chang, K. J. Effect of hydrogen incorporation on the negative bias illumination stress instability in amorphous In-Ga-Zn-O thin-film-transistors. J. Appl. Phys. 113, 063712, doi:10.1063/1.4792229 (2013).
13. Huang, X. et al. Enhanced bias stress stability of a-InGaZnO thin film transistors by inserting an ultra-thin interfacial InGaZnO:N layer. Appl. Phys. Lett. 102, 193505, doi:10.1063/1.4805354 (2013).
14. Huang, S. Y. et al. Device characteristics of amorphous indium gallium zinc oxide thin film transistors with ammonia incorporation.
Solid State Electron. 61, 96–99, doi:10.1016/j.sse.2011.01.001 (2011).
15. Nahm, H.-H. & Kim, Y.-S. Role of lone-pair electrons in Sb-doped amorphous InGaZnO4: Suppression of the hole-induced lattice
instability. Appl. Phys. Lett. 102, 152101, doi:10.1063/1.4801931 (2013).
16. Asahi, R. et al. Visible-Light Photocatalysis in Nitrogen-Doped Titanium Oxides. Science. 293, 269–271, doi:10.1126/ science.1061051 (2001).
17. Jansen, M. & Letschert, H. P. Inorganic yellow-red pigments without toxic metals. Nature. 404, 980–982, doi:10.1038/35010082 (2000).
18. Nomura, K. et al. Carrier transport in transparent oxide semiconductor with intrinsic structural randomness probed single-crystalline InGaO3(ZnO)5 films. Appl. Phys. Lett. 85, 1993–1995, doi:10.1063/1.1788897 (2004).
19. Shklovskii, B. I. and Efros, A. L. Electronic Properties of Doped Semiconductors Springer (Heidelberg, 1984).
20. Noh, H.-K., Chang, K. J., Ryu, B. & Lee, W.-J. Electronic structure of oxygen-vacancy defects in amorphous In-Ga-Zn-O semiconductors. Phys. Rev. B 84, 115205, doi:10.1103/PhysRevB.84.115205 (2011).
21. Long, R. et al. Atomic geometry and electronic structure of defects in Zn3N2. Thin Solid Films 516, 1297–1301, doi:10.1016/j.
tsf.2007.06.107 (2008).
22. Zhang, S. B. & Northrup, J. E. Chemical potential dependence of defect formation energies in GaAs: Application to Ga self-diffusion.
Phys. Rev. Lett. 67, 2339–2342, doi:10.1103/PhysRevLett.67.2339 (1991).
23. Wriedt, H. A. The N−Zn (Nitrogen-Zinc) system. Bull. Alloy Phase Diagrams 9, 247–251, doi:10.1007/BF02881275 (1988). 24. Reuter, K. & Scheffler, M. Composition, structure, and stability of RuO2(110) as a function of oxygen pressure. Phys. Rev. B 65,
035406, doi:10.1103/PhysRevB.65.035406 (2011).
25. Kamiya, T., Nomura, K. & Hosono, H. Electronic Structures Above Mobility Edges in Crystalline and Amorphous In-Ga-Zn-O: Percolation Conduction Examined by Analytical Model. J. Disp. Technol. 5, 462–467, doi:10.1109/JDT.2009.2022064 (2009). 26. Tomai, S. et al. High-Performance Thin Film Transistor with Amorphous In2O3–SnO2–ZnO Channel Layer. Jpn. J. Appl. Phys., Part
1 51, 03CB01, doi:10.7567/JJAP.51.03CB01 (2012).
27. Kang, Y., Cho, Y. & Han, S. Cation disorder as the major electron scattering source in crystalline InGaZnO. Appl. Phys. Lett. 102, 152104, doi:10.1063/1.4802093 (2013).
28. Germs, W. C. et al. Charge transport in amorphous InGaZnO thin-film transistors. Phys. Rev. B 86, 155319, doi:10.1103/ PhysRevB.86.155319 (2012).
29. Kresse, G. & Hafner, J. Ab initio molecular dynamics for liquid metals. Phys. Rev. B 47, 558–561, doi:10.1103/PhysRevB.47.558 (1993).
30. Blöchl, P. E. Projector augmented-wave method. Phys. Rev. B 50, 17953–17979, doi:10.1103/PhysRevB.50.17953 (1994). 31. Perdew, J. P., Burke, K. & Ernzerhof, M. Generalized gradient approximation made simple. Phys. Rev. Lett. 78, 1396 (1997). 32. Dudarev, S. L. et al. Electron-energy-loss spectra and the structural stability of nickel oxide: An LSDA + U study. Phys. Rev. B 57,
1505–1509, doi:10.1103/PhysRevB.57.1505 (1998).
34. Kim, Y.-S. & Park, C. H. Rich variety of defects in ZnO via an attractive interaction between O vacancies and Zn interstitials: origin of n-type doping. Phys. Rev. Lett. 102, 086403, doi:10.1103/PhysRevLett.102.086403 (2009).
35. Oba, F. et al. Defect energetics in ZnO: A hybrid Hartree-Fock density functional study. Phys. Rev. B 77, 245202, doi:10.1103/ PhysRevB.77.245202 (2008).
36. Makov, G. & Payne, M. C. Periodic boundary conditions in ab initio calculations. Phys. Rev. B 51, 4014–4022, doi:10.1103/ PhysRevB.51.4014 (1995).
Acknowledgements
This work was supported by IBS-R009-D1 and by the MOTIE (Ministry of Trade, Industry & Energy (#10051403 and #10052020)) and KDRC (Korea Display Research Corporation).
Author Contributions
J.P., J.-S.P. and H.-H.N. designed this work and wrote the manuscript. H.-J.J. and H.M. Lee carried out the experiments and H.-H.N. performed the DFT calculations. All authors discussed the results and commented on the manuscript. J.P. and H.-J.J. contributed equally as the first author.
Additional Information
Supplementary information accompanies this paper at doi:10.1038/s41598-017-02336-5 Competing Interests: The authors declare that they have no competing interests.
Publisher's note: Springer Nature remains neutral with regard to jurisdictional claims in published maps and institutional affiliations.
Open Access This article is licensed under a Creative Commons Attribution 4.0 International License, which permits use, sharing, adaptation, distribution and reproduction in any medium or format, as long as you give appropriate credit to the original author(s) and the source, provide a link to the Cre-ative Commons license, and indicate if changes were made. The images or other third party material in this article are included in the article’s Creative Commons license, unless indicated otherwise in a credit line to the material. If material is not included in the article’s Creative Commons license and your intended use is not per-mitted by statutory regulation or exceeds the perper-mitted use, you will need to obtain permission directly from the copyright holder. To view a copy of this license, visit http://creativecommons.org/licenses/by/4.0/.