Genetic mapping and DNA sequence-based analysis of deleted regions on
chromosome 16 involved in progression of bladder cancer from occult
preneoplastic conditions to invasive disease
Dong-Sup Yoon
1,5,6, Li Li
1, Ruo-Dan Zhang
1, Andrzej Kram
1, Jae Y Ro
1, Dennis Johnston
2,
H Barton Grossman
3, Steven Scherer
4and Bogdan Czerniak*
,11Department of Pathology, The University of Texas MD Anderson Cancer Center, Houston, Texas, TX 77030, USA;2Department of Biomathematics, The University of Texas MD Anderson Cancer Center, Houston, Texas, TX 77030, USA;3Department of Urology, The University of Texas MD Anderson Cancer Center, Houston, Texas, TX 77030, USA;4Department of Molecular and Human Genetics, Human Genome Sequencing Center, Baylor College of Medicine, Houston, Texas, TX 77030, USA
Histologic and genetic mapping with 30 hypervariable markers mapped to chromosome 16 were performed on 234 DNA samples of ®ve cystectomy specimens from patients with invasive bladder cancer. Allelic losses of individual markers were related to microscopically identi®ed precursor conditions in the entire bladder mucosa and invasive cancer. Their signi®cance for the development and progression of neoplasia from in situ preneoplastic conditions to invasive disease was analysed by the nearest neighbor algorithm and binomial max-imum likelihood analysis. Using this approach we identi®ed ®ve distinct regions of allelic losses de®ned by their ¯anking markers and predicted size as follows. p13.3(D16S418-D16S406, 1.2 cM),
p13.1(D16S748-D16S287, 12.9 cM), q12 1(D16S409-D16S514,
24.0 cM), q22.1 (D16S496-D16S515, 5.4 cM), and q24 (D16S507-D16S511, 5.9 cM and D16S402-D16S413, 17.4 cM). The regions mapping to p13.1 and q24 were involved in early intraurothelial phases of bladder neoplasia such as mild to moderate dysplasia. On the other hand the deleted region mapping to p13.3 was involved in progression of severe dysplasia/carcinoma in situ to invasive bladder cancer. Testing of markers that exhibited statistically signi®cant LOH in relation to progression of neoplasia from precursor conditions to invasive cancer on 28 tumors and voided urine samples from 25 patients with bladder cancer revealed that q12.1 showed LOH in 46.4% of tumor and 32.0% of voided urine samples. The LOH of a single marker D16S541 could be detected in approximately 28% of tumors and 20% of voided urine samples of patients with bladder cancer. These data imply that the deleted region centered around marker D16S541 spanning approximately 10 cM and ¯anked by D16S409 and D16S415 contains a novel putative tumor suppressor gene or genes playing an
important role in the development of human bladder cancer. To facilitate more precise positional mapping and identi®cation of pathogenetically relevent genes, we analysed of human genome contig and sequence databases spanning the deleted regions. Multiple known candidate genes and several smaller gene-rich areas mapping to the target regions of chromosome 16 were identi®ed Oncogene (2001) 20, 5005 ± 5014.
Keywords: tumor suppressor gene loci; chromosome 16; bladder cancer
Introduction
Alterations of chromosome 16 are implicated in the development of several common human malignancies. Karyotyping studies have shown that clonal deletions of 16q are frequent in carcinomas of the lung, breast, prostate, and liver (Carter et al., 1990; Devilee et al., 1991; Dutrillaux et al., 1990, Larsson et al., 1990; Pan et al., 1998; Rodgers et al., 1984; Sato et al., 1990, 1998; Tsuda et al., 1990). More recently three distinct regions of chromosome 16 involved in breast and prostate cancer were identi®ed by hypervariable marker studies. They were mapped to 16p13, 16q22.1, and 16q24.3 bands, which contain the TSC2/PKD1, E-cadherin, and Fanconi anemia. A tumor suppressor genes, respectively (Asgeirsson et al., 2000; Lininger et al., 1998; Whitmore et al., 1998).
Here we report the results of our studies on the evolution of allelic losses in the progression of human urothelial neoplasia from preneoplastic con-ditions to invasive bladder cancer using the strategy of whole-organ histologic and genetic mapping. Allelic losses of chromosome 16 were studied on multiple DNA samples extracted from invasive bladder cancer and from the microscopically identi-®ed intraurothelial precursor conditions in the adjacent mucosa of the entire bladder. Using this approach we were able to match the allelic losses of individual markers to progression of urothelial neoplasia from in situ preneoplastic conditions to
*Correspondence: B Czerniak, E-mail: bczernia@mdanderson org Current addresses: 5Department of Pathology, The University of Texas MD Anderson Cancer Center, Houston, Texas, USA; 6Department of Surgery, Yonsei University College of Medicine, Seoul, Korea
Received 8 February 2001; revised 2 April 2001; accepted 9 May 2001
invasive bladder cancer and identify several novel critical regions of chromosome 16 involved in urinary bladder cancer progression. The markers identi®ed as signi®cantly altered in relation to neoplastic progression were subsequently tested on multiple bladder tumor samples and related to clinico-pathological parameters of the tumors. Final-ly, the applicability of chromosome 16 allelic losses as noninvasive markers of urothelial neoplasia was tested on voided urine and bladder washing samples from patients with urinary bladder carcinoma. To facilitate further mapping and identi®cation of pathogenetically relevant genes on chromosome 16 involved in bladder carcinogenesis, we analysed available human genome contig and sequencing databases spanning the deleted regions.
Results
Whole-organ histologic and genetic mapping
The initial testing of paired normal and invasive tumor DNA samples from the same patient revealed loss of heterozygosity (LOH) in 11 of 30 tested markers mapped to chromosome 16 (Figure 1). No shortening or expansion of the repetitive sequences was identi®ed. None of the cystectomy cases used for whole-organ histologic and genetic mapping showed evidence of chromosome 16 monosomy, i.e. none of the cases showed LOH of all informative markers, which would indicate complete loss of chromosome 16. Testing of alterations on multiple samples from the same patient revealed the same pattern of allelic loss, i.e., the same allele was always lost, indicating a clonal relationship exists among the samples with an altered marker (Figure 2a). The superimposition of distributions of allelic losses in individual markers over the histologic maps disclosed two basic patterns of chromosome 16 deletions, scattered and plaque-like. Some of the allelic losses involved large areas of urinary bladder mucosa encompassing various precursor conditions and even some adjacent areas of morphologically normal urothelium, which implicated their involvement in early phases of urothelial neoplasia (Figure 2b). On the other hand, some markers exhibited LOH restricted to severe dysplasia/carcinoma in situ and invasive carcinoma only, suggesting their involvement in the later phases of urothelial neoplasia progressing to invasive disease. The patterns of LOH distribution of the entire chromosome in individual cystectomies were generated by the nearest neighbor analysis (Figure 2c) The nearest neighbor analysis disclosed that scattered foci of alterations with no apparent relationship to speci®c phases of neoplasia were in fact located within the ®eld change in which other chromosomal regions were deleted and involved larger areas of the urinary bladder mucosa.
For the purpose of binomial maximum likelihood analysis the intraurothelial precancerous changes were classi®ed into two major groups: low-grade
intraur-othelial neoplasia (mild and moderate dysplasia; LGIN) and high-grade intraurothelial neoplasia (se-vere dysplasia and carcinoma in situ, HGIN). The analysis of LOD scores revealed that the markers with a statistically signi®cant relationship to the develop-ment and progression of urothelial neoplasia were located in several distinct chromosome 16 regions: p13.3 (D16S513); p13.1 (D16S500); q12.1 (D16S541,
D16S415); q22.1 (D16S512); q24 (D16S505,
D16S520). The location of these regions, their predicted size, and the position of the nearest ¯anking markers are shown in Figure 1. The regions mapping to p13.1, q22.1, and q24 developed allelic losses early during the development of urothelial neoplasia, involving areas of urinary bladder mucosa with LGIN as well as adjacent areas of normal urothelium. In contrast, a p13.3 developed LOH in late phases of urothelial neoplasia, and it was associated with HGIN progressing to invasive carcinoma. In addition, allelic losses within the q12.1 were statistically signi®cant for the development of early phases of urothelial neoplasia such as LGIN, but they were not associated with progression to HGIN and invasive carcinoma. Such patterns of alteration suggested that LOH in this area may not be functionally signi®cant for the progression of preneoplastic changes to invasive disease.
Testing of allelic losses on chromosome 16 in bladder tumors and voided urine samples
The markers that exhibited statistically signi®cant relationships to the development and progression of urothelial neoplasia as revealed by the whole-organ histologic and genetic mapping as well as their nearest nonaltered ¯anking markers were tested on multiple bladder tumors and voided urine samples of the patient with bladder cancer corresponding to dierent pathogenetic subsets, grades, and stages of the disease (Table 1). The frequencies of alterations in individual markers as well as in their correspond-ing chromosomal regions are provided in Table 2. Alterations of at least one of the tested markers could be identi®ed in 82.1% of tumors and 60.0% of voided urine samples of patients with TCC. Moreover alterations of multiple markers mapped to selected regions of chromosome 16 (42 markers) could be identi®ed in 39.3% of bladder tumor and 32.0% of voided urine samples of patients with bladder cancer. The allelic losses involving q12.1, p13.1, and q24 were the most frequent and could be identi®ed in 46.4, 28.6 and 21.4% of tumor samples, respectively. The alterations in these regions could be also documented in 20 ± 32% of voided urine samples. Interestingly, the allelic losses of a single marker, D16S541, ¯anked by D16S409 and D16S415 and spanning 10 cM, could be identi®ed in 28.6% of tumor and 20.0% of voided urine samples of the patient with bladder cancer de®ning the most frequently deleted region of chromosome 16 involved in urinary bladder cancer.
Analysis of contig and sequencing data spanning the deleted regions of chromosome 16
The analysis of available contig and sequencing data spanning the deleted regions of chromosome 16 is summarized in Figure 3. The ®ve deleted regions of chromosome 16 contain 88 known genes, some of them with potential tumor suppressor gene activities. In addition multiple ESTs were assigned to individual deleted regions identifying several smaller gene-rich areas. The two most frequently deleted regions mapping to 16q12.1 and q22.1 contained several smaller areas with particularly high densities of ESTs and of known genes with putative tumor suppressor activities, further supporting the concept of their potential pathogenetic relevance for bladder carcino-genesis.
Discussion
Whole-organ histologic mapping together with poly-morphic DNA markers and other molecular probes is a powerful tool for studying the genetic and molecular events involved in bladder cancer development and progression (Chaturvedi et al., 1997; Czerniak et al., 1999, 2000). The major advantages of this approach are that the entire mucosa of the aected organ is included in the analysis and the alterations are analysed in continuity with disease progression from morphologically normal urothelium through microsco-pically recognizable in situ precursor lesions to invasive cancer. Using this method, we identi®ed ®ve distinct regions of allelic losses on chromosome 16, mapped to
p13.3(D16S513), p13.1(D16S500), q12.1(D16S541,
D16S415), q22.1(D16S512), q24(D16S505, D16S520), that may contain tumor suppressor genes involved in urothelial carcinogenesis. The allelic losses within regions mapped to 16q13.1 and 16q24 were the most frequent and could be identi®ed in approximately 20 ± 45% of bladder tumors as well as in 20 ± 30% of voided urine samples of patients with bladder cancer. Moreover the LOH of a single marker (D16S541) with a statistically signi®cant LOD score for HGIN progressing to invasive cancer could be detected in approximately 28% of bladder tumors and 20% of voided urine samples of patients with TCC. These data implicate the deleted region centered around D16S541 and ¯anked by D16S409 and D16S415 spanning approximately 10 centimorgans may contain important tumor suppressor gene/genes frequently involved in progression of intraurothelial neoplasia to invasive bladder cancer. In order to place and reorient the position of markers de®ning the deleted regions, we looked for overlap between the originally used markers and those used to generate the most updated version of GeneMap99. The aim of these analyses was to ®nd the new positions for markers based on physical map data and identify the nearest substitute markers for those markers, which are not present on the radiation hybrid panel-based physical map produced by the
Interna-tional Radiation Hybrid Mapping Consortium. Final-ly, multiple searches of available sequence data were performed to locate and orient the markers with statistically signi®cant LOH and identify the position of known genes and ESTs within the deleted regions. This approach produced the most complete, currently available, sequence-based map of the deleted region on chromosome 16 involved in bladder neoplasia and identi®ed several smaller gene-rich areas as potential targets for more accurate future mapping. It should be noted that these data represent a snapshot of human genome databases available at the time of this analysis (January 2001). The rapidly developing human genome databases and its associated analytical tools will necessitate a constant reanalysis of the data presented here.
The original histological maps of cystectomy speci-mens were performed approximately two decades ago and provided the foundation for the generally accepted `dual-track concept' of the development of urinary bladder cancer (Koss et al., 1974, 1977; Koss, 1979; Koss and Czerniak, 1991). It postulates that urothelial tumors arise via two distinct but often overlapping pathways, papillary and nonpapillary (Czerniak et al., 1992; Cairns et al., 1994; Spruck et al., 1994). Strong evidence exists that the development of both papillary and nonpapillary tumors is preceded by clonal expansion of clinically occult but genetically abnormal urothelial cells that may or may not be associated with microscopically recognizable intraurothelial precursor conditions. It is generally accepted that the low-grade super®cial papillary lesions originate from the urothe-lial mucosa microscopically characterized by urotheurothe-lial hyperplasia and a mild degree of atypia, frequently referred to as minimal urothelial dysplasia. The high grade invasive urothelial carcinoma typically presents in a patient without prior history of super®cial papillary lesions and represents a progression of high-grade intraurothelial neoplasia i.e. severe dysplasia or carcinoma in situ. The genetic and molecular dier-ences between the two pathways seem to be predomi-nantly quantitative. In general, low-grade super®cial papillary tumors exhibit fewer chromosomal changes than high-grade carcinomas, particularly regarding extra copies of chromosome 1 and 7 and deletions of chromosome 9 (Spruck et al., 1994; Czerniak and Herz, 1995). On the other hand, high-grade invasive bladder cancers are characterized by cumulative rearrange-ments, deletions, and ampli®cations of multiple chromosomes, particularly chromosome 3, 11, 17, 18, and 22 as well the alterations of several major tumor suppressor genes such as p53, RB, and other genes within their respective regulatory pathways (Chang et al., 1995). Our prior studies using whole-organ histologic and genetic mapping of several other chromosomes provided strong evidence that the initial phases of urothelial neoplasia may represent clonal expansion of genetically abnormal urothelial cells common for both pathways of bladder neoplasia which exhibit deletions in several regions on chromosome 9 (Czerniak et al., 1999).
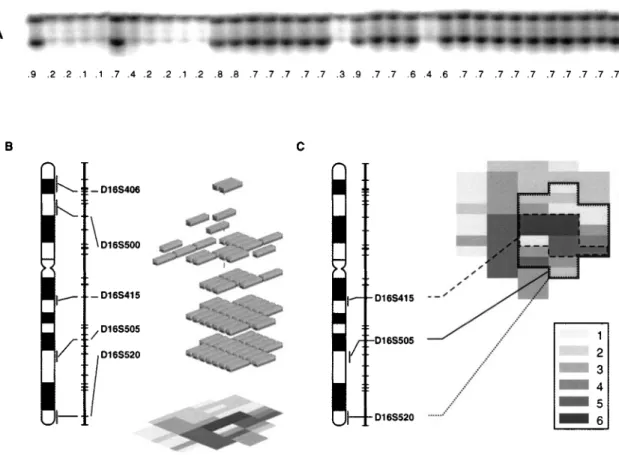
Figure 1 Summary of whole-organ histologic and genetic mapping of deleted regions on chromosome 16 involved in progression of bladder neoplasia from intraurothelial precursor conditions to invasive cancer. (a) Map of chromosome 16 with a list of tested markers and their positions according to the Genethon database, version March, 1996. Asterisks on the right side of the markers indicate a statistically signi®cant association between an altered marker and urothelial neoplasia. Bars on the left side of the chromosomal vector designate deleted regions de®ned by their ¯anking markers and a size in cM as follows p13.3(D16S418 -D16S406, 1.2 cM), p13.1(D16S748 - D16S287, 12.9 cM), q12.1(D16S409 - D16S514, 24.0 cM), q22.1(D16S496 - D16S515, 5.4 cM), q24(D16S507 - D16S511, 5.9 cM) and q24(D16S402 - D16S413, 17.4 cM). The relationship of LOH in individual markers to
Our current studies provide strong evidence that previously unknown regions on chromosome 16 are involved in the development of intraurothelial pre-neoplasic lesions. Losses of genetic material in these
loci may inactivate yet unidenti®ed tumor suppressor genes involved in early phases of both papillary and nonpapillary pathways of bladder neoplasia. Moreover, the high frequency of allelic losses of chromosome 16
various phases of urothelial neoplasia was tested by binomial maximum likelihood analysis and is summarized in the LOD score table shown in (b). (cM, Centimorgans, WOHGM, whole organ histologic and genetic mapping of individual cystectomy specimens consecutively numbered 1 to 5 *, Nonaltered marker; *, altered marker; f, noninformative marker). (b) Binomial maximum likelihood analysis testing the relationship among LOH of individual chromosome 16 markers and progression of bladder neoplasia from intraurothelial precursor conditions to invasive cancer. Cumulative LOD scores for chromosome 16 markers with LOH were calculated at variable y=(0.01, 0.5 and 0.99) for normal urothelium (NU), low-grade intraurothelial neoplasia (LGIN), high-grade intraurothelial neoplasia (HGIN), and transitional cell carcinoma (TCC). To simplify graphical presentation only stringency 1 calculations are provided. The patterns of statistically signi®cant LOD scores are as described in Materials and methods. Note that signi®cant patterns of LOD scores typically correspond to high Tmaxvalues. (*, LOD score 53; *, LOD score 53)
Figure 2 Assembly of whole-organ histologic and genetic maps. (a) Example of a marker D16S541 tested on multiple mucosal samples from the same cystectomy specimen (map 4). Sample 1 represents allelic patterns of the marker from peripheral blood lymphocytes of the same patient and serves as control. Marker D16S541 shows LOH in samples corresponding to microscopically normal urothelium (samples 2 ± 5, 7, and 8), LGIN (samples 9 ± 11, and 19) and invasive TCC (sample 24). The presence of LOH in all samples was con®rmed by densitometry and is expressed as OD ratio below each sample. OD ratio 40.5 was considered indicative of LOH. (b) Example of chromosome 16 allelic losses in a single cystectomy specimen with invasive TCC assembled by nearest neighbor analysis. The vertical axis represents a chromosome 16 vector with positions of markers and their chromosomal locations. Only markers with LOH are shown. The shaded blocks represent areas of urinary bladder mucosa with LOH as they relate to progression of neoplasia presented by a histologic map of cystectomy in the background. The code for histologic map is as shown in (c). (c) Example of whole-organ histologic and genetic map of a cystectomy specimen showing distribution of LOH in three markers on chromosome 16. Markers D16S505 and D16S520 show an almost identical overlapping plaque-like LOH involving a large area of urinary bladder mucosa corresponding not only to invasive cancer but also to areas of bladder mucosa with HGIN, LGIN, and microscopically normal urothelium. Such pattern of involvement implies that the concurrent allelic losses of these markers represent early hits in bladder carcinogenesis. On the other hand LOH of marker D16S415 involves a smaller area of urinary bladder mucosa corresponding to HGIN and invasive cancer only, and so indicates that the allelic loss of this marker occurred later in urinary bladder cancer development. Histologic map code: (1) normal urothelium; (2) mild dysplasia; (3) moderate dysplasia, (4) severe dysplasia, (5) carcinoma in situ; (6) transitional cell carcinoma
Table 1 Allelic loss es of chrom osome 16 ide nti®ed in 28 tum or sam ples and 25 voide d urin e sam ples of patie nts w ith urin ary bladd er can cer Cur rent status FU Primary tumor p13.3 p13.1 q12.1 q22.1 q24 q24 No Gro wth Gra de Stage Mo Growth Grade Stag e D16S4 18 D16S513 D16S406 D16S7 48 D16S5 00 D16S2 87 D16S409 D16S541 D16S4 15 D16S5 14 D16S496 D16S512 D16S515 D16S507 D16S5 05 D16S5 11 D16S4 02 D16S520 D16S413 Tu mor sample s 1 1 Ta 10 P 2 Ta X 0 0 0 0 0 . 000 0 0 0 . 00 0 X 0 2 T 4 P 2 T 3 0 00 000 . 0 f 00 0 0 0 f 00 0 0 3 48 P 2 T a 0 00 000 0 . 00 0 0 0 0 0 f 00 0 44 6 P 2 T a f 00 000 0000 0 0 0 000 0 0 0 5 23 P 2±3 T a 0 f 0 000 0 . 00 0 0 0 0 f 0 ff 0 6T 3 23 P 3 T 3 0 0 0 ff 00 . 00 0 0 0 000 0 0 0 7P 3 T a 0 0 0 0 . 0 .. 00 . 0 . 000 0 0 0 8T 0 4 P 3 T 1 .. 0 000 000 f 00 0 0 ff f 00 92 5 P 3 T 1 ff . f 00 0000 0 . 0X 0 0 f 00 10 8 P 3 T 2 0 00 00 X 0000 0 0 . 00 0 0 0 0 11 T3 16 NP 3 T 3 . 00 000 00 . 0 0 00 000 0 0 0 12 T3 12 NP 3 T 3 0 0 0 0 0 0 0 0 . 0 0 00 000 0 0 0 13 3 T 3 10 N P 3 T3 0 0 0 0 . 00 0 . 0 0 00 000 0 . 0 14 3 T 3 6 NP 3 T 3 f 00 ff 0 .. 00 0 0 . 00 f 00 . 15 3 T 3 6 N P 3 T 3 0 00 000 0 . 00 0 0 0 . 00 0 . 0 16 T2 19 NP 3 T 2 0 0 0 X 0 0 0 . 00 0 0 0 0 0 f 00 0 17 T2 93 NP 3 T 3 0 0 0 0 0 0 0 . 00 0 0 0 . 00 0 0 0 18 3 T 3 13 N P 3 T3 0 0 0 0 . 0 0000 0 0 0 0 f 00 f 0 19 3 T 2 15 N P 3 T 2 X X 0 X 00 0000 f 00 . f 00 0 0 20 3 T 4 7 N P 3 T 4 E 00 000 0000 0 0 0 . 0 f 00 0 21 3 T 2 23 N P 3 T 2 0 X 0 X 00 X 000 0 0 0 . 0 f 00 0 22 3 T 3 19 N P 3 T3 0 0 0 ff 0 0000 X 0 0 000 f 00 23 3 T 3 45 N P 3 T3 0 . 0 . 00 0000 0 0 0 000 0 0 0 24 3 T 3 11 N P 3 T3 0 . 00 . 0 0000 0 0 0 000 0 X 0 25 3 T 3 11 N P 3 T3 0 0 0 0 . 0 0000 0 0 0 0 f 00 0 0 26 3 T 3 18 N P 3 T 3 0 0 0 000 000 f 0 0 0 000 0 0 0 27 3 T 3 16 N P 3 T 3 X 0 0 000 0000 0 0 0 000 0 0 0 28 3 T 3 22 N P 3 T3 0 f 0 000 0000 0 0 0 000 f 00 Voi ded urine samples* 1 2 Ta 55 P 1 Ta 0 0 S 0 0 0 f S0 0 0 0 0 S X 0 0 S0 2T o 60 P 2 T a 0 0 . 000 .. 00 0 0 . 000 . 00 3 2 Ta 140 P 2 Ta ff 0X 0 0 0 . 0 ff 0X f 0X 0 0 f 4 P 2 T a 149 P 2 Ta 0 . 0X X . 0000 0 0 0 000 0 0 0 5 P 2 T a 0 P 2 T a 0 0 0 000 0 X X 0 0 0 0 000 0 0 0 6 T o 15 P 2 T a 0 00 000 0000 0 0 0 0 f 00 0 0 7 T o 6 P 2 T2 0 f 0X ff f 0 f X 0 0X 0X X 0 X f 8 P 2 T a 8. 5 P 2 T 1 0 0 0 000 0000 0 0 0 000 0 0 0 9 N P 3 T3 a 25 N P 3 T1 0 f 00 0 ff 0 . ff f f 0X f 00 0 10 3 Tis 0.6 NP 3 T 2 0 0 0 0 . 0 000 . 00 . 000 0 . 0 11 NP 3 T 2 2.5 NP 3 T 2 0 0 0 0 . 00 . 00 0 . 0 000 .. 0 12 NP 3 T 2 0 NP 3 T 2 f 00 f 0 . 0 . 0 f 0 0 0 000 0 X 0 13 To 1 N P 3 T2 0 0 0 0 f 0 . 000 0 X 0 f X0 0 f 0 14 N P 3 T 3b 1 N P 3 T 1 0 0 0 000 0000 0 0 . 0 f 00 0 0 15 3 Tis 1 N P 3 T2 0 0 0 . 00 0000 0 . 0 000 0 0 0 16 N P 3 T 4 4 N P 3 T 2 0 00 000 0000 . 00 000 0 0 0 17 To 3 N P 3 T2 0 0 0 0 0 0 f X0 ff 00 00 f . X f 18 3 T a 12 0 N P 3 T 3 0 00 000 0000 0 0 0 000 0 0 0 19 T o 0. 6 N P 3 T 2 0 00 000 0000 0 0 0 000 0 0 0 20 N P 3 T 1 1. 6 N P 3 T 1 0 00 000 0000 0 0 0 000 0 0 f 21 N P 3 T 3a 1 N P 3 T 2 0 0 0 000 0000 0 0 0 000 0 0 0 22 3 T is 0. 6 N P 3 T 1 0 00 000 0000 0 0 0 0 X 0 0 0 f 23 P 2 T1 0 . 0 000 0000 0 . 0 . 00 f . 0 24 To 2 Tis Tis 0 0 0 0 0 0 ? . 0 . 0 0 X 000 0 0 0 25 NP 3 T 3 . 00 000 0000 0 0 0 000 0 0 f .: L O H ; 0: no LOH; f : non-in format ive; X: no reaction; S: shortenin g. *Urine sam ples for this ana lysis w ere not obtain ed from the same patients as blad der tumor sam ples
make them useful as noninvasive markers for detection of occult bladder cancers in voided urine samples (Czerniak et al., 1999; Mao et al., 1996; Steiner et al., 1997). Given a large size of these regions, which span several centimorgans, the task of identifying pathogen-etically relevant gene or genes in this area would be extremely complex if a conventional positional cloning approach were used. However, with the advent of novel BAC-based DNA microarray technologies, mapping of large chromosomal segments becomes feasible (Hughes et al., 2000; Lucito et al., 2000). We believe that our data will facilitate such studies, which may in turn lead to the identi®cation of novel unknown genes involved in clinically occult preinvasive phases of human bladder neoplasia.
Materials and methods Histologic and genetic mapping
Five cystectomy specimens with invasive urothelial carcinoma were used for whole-organ histologic and genetic mapping and were prepared as previously described (Chaturvedi et al., 1997). All cases represented previously untreated sporadic carcinoma of the bladder. None of the cases occurred in the known familial syndrome predisposing to the development of urinary bladder cancer. All patients were males, and their age ranged from 47 to 78 years (mean=66.4+11.9 years s.d.). The tissue of interest was identi®ed microscopically and microdissected from the frozen block. DNA was extracted from cell suspensions containing at least 90% microscopically recognizable intact urothelial cells. Cystectomy specimens yielding less pure cell suspensions were not included in this study.
We obtained 49, 39, 65, 42, and 39 mucosal samples respectively from each bladder. In four cases, a single focus of grade 3, nonpapillary urothelial carcinoma invading the muscularis propria, was present. It was accompanied by extensive precancerous lesions ranging from mild dysplasia to carcinoma in situ. In one case (map 3), multiple foci of carcinoma were present. One focus represented a grade 3 nonpapillary urothelial carcinoma with transmural invasion of the bladder wall and involvement of the perivesical adipose tissue. Two additional foci of carcinoma represented grade 3 papillary urothelial carcinoma without invasion. Like the other four cases, extensive areas of the urinary bladder mucosa in this case exhibited changes ranging from mild dysplasia to carcinoma in situ.
Tumor, voided urine samples, and clinico-pathological data Fresh samples of urinary bladder tumors from 28 patients and voided urine samples from 25 patients with TCC were used to study the allelic losses. The markers of chromosome 16 that were identi®ed as signi®cantly altered by the superimposed histologic and genetic mapping were tested in 28 tumor samples and 25 voided urine samples. The intraurothelial precancerous changes were microscopically classi®ed as mild, moderate, or severe dysplasia or as carcinoma in situ. The TCCs were classi®ed according to the three-tier histologic grading system of the World Health Organization (Mosto® et al., 1999). The growth pattern (papillary versus nonpapillary), and depth of invasion according to the TNM staging system were also recorded (Sobin and Wittekind, 1997). DNA was extracted from individual bladder tumors and sediments of voided urine samples as previously described (Chaturvedi et al., 1997). For controls, DNA was also extracted from the peripheral blood lymphocytes and/or normal tissue in the resected specimens from each patient.
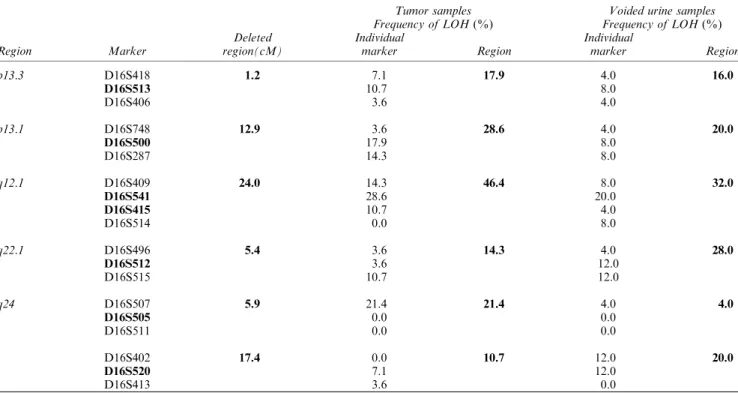
Table 2 Frequency of LOH on ®ve distinct regions of chromosome 16 identi®ed on tumor and voided urine samples of patients with urinary bladder neoplasia
Tumor samples Voided urine samples
Frequency of LOH (%) Frequency of LOH (%)
Deleted Individual Individual
Region Marker region(cM) marker Region marker Region
p13.3 D16S418 1.2 7.1 17.9 4.0 16.0 D16S513 10.7 8.0 D16S406 3.6 4.0 p13.1 D16S748 12.9 3.6 28.6 4.0 20.0 D16S500 17.9 8.0 D16S287 14.3 8.0 q12.1 D16S409 24.0 14.3 46.4 8.0 32.0 D16S541 28.6 20.0 D16S415 10.7 4.0 D16S514 0.0 8.0 q22.1 D16S496 5.4 3.6 14.3 4.0 28.0 D16S512 3.6 12.0 D16S515 10.7 12.0 q24 D16S507 5.9 21.4 21.4 4.0 4.0 D16S505 0.0 0.0 D16S511 0.0 0.0 D16S402 17.4 0.0 10.7 12.0 20.0 D16S520 7.1 12.0 D16S413 3.6 0.0
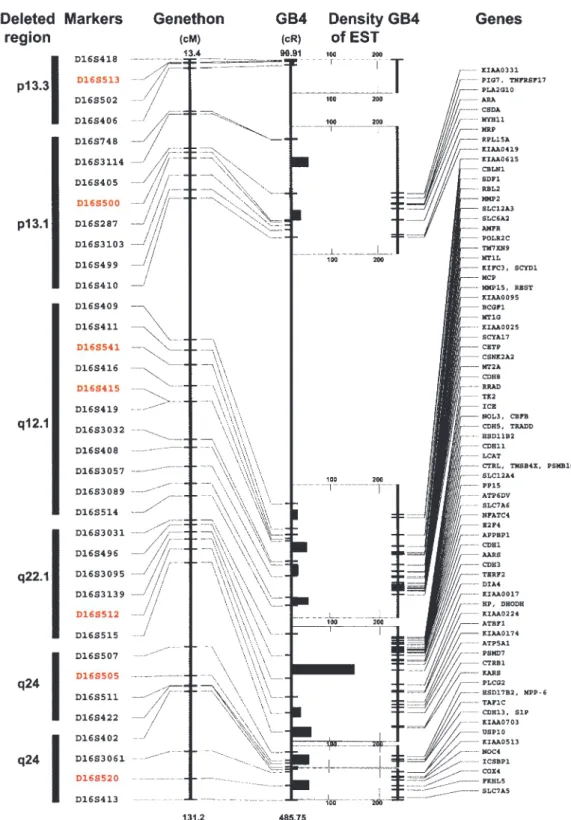
Figure 3 Summary of physical map and sequence database analysis spanning the deleted regions of chromosome 16 performed as described in Material and methods. The Genethon positions of the markers de®ning the deleted regions were related to the GB4 radiation hybrid panel-based physical map. The new positions for the Genethon markers with LOH as well as ¯anking markers on the GB4 map were identi®ed by electronic PCR search of BAC contigs. In addition, multiple alternative markers based on their proximity to markers with LOH were identi®ed and added to the map. The nearest substitute markers are often located within the same BAC clone as original Genethon markers used for LOH studies. Consequently some of the original Genethon and substitute markers have the same position on the GB4 map. The original Genethon markers with LOH are shown in red. All other substitute and ¯anking markers are printed in black. An average EST density is provided for regions ¯anked by individual markers. The list of known genes within the target regions and their positions on the GB4 map is also shown. To simplify the diagram, only the ®rst position of a known gene sequence on the GB4 map is shown. More complete data with contigs information and alternative positions of the genes can be obtained from our Web site http://www.mdanderson.org/BladderGenomicMaps/
Microsatellites
A set of primers for 30 microsatellite markers on chromo-some 16 based on an updated Genethon microsatellite map was purchased from Research Genetics (Huntsville, AL, USA), (Gyapay et al., 1994). The markers selected for testing exhibited high levels of heterozygosity and relatively uniform distribution, i.e. they covered all regions of chromosome 16. The allelic patterns of markers were resolved on polyacryla-mide gels after their ampli®cation using the polymerase chain reaction as previously described (Chaturvedi et al., 1997). A minimum 50% reduction in signal intensity was required to be considered evidence of LOH. Tests with questionable results were repeated. In such cases the densitometric measurements were performed to ensure objective reading of the data. Testing of markers was performed in two phases. Initially, all 30 markers were tested on paired non-tumor versus tumor DNA samples. This revealed LOH of 13 markers, which were subsequently tested on all mucosal samples to generate whole-organ histologic and genetic maps. Analysis of LOH data
The data were analysed as previously described (Chaturvedi et al., 1997). In brief, three-dimensional displays of LOH distribution patterns in relation to progression of the neoplasia from precursor intraurothelial conditions to invasive cancer were generated and initially analysed by the nearest-neighbor analysis (Hartigan, 1975). The signi®cance of LOH in individual markers for progression of urothelial neoplasia from precursor conditions to invasive carcinoma was tested by a binomial maximum likelihood analysis, and the signi®cance of the relationship was expressed as a LOD score. Cumulative LOD scores were calculated at variable y (0.01, 0.5, and 0.99). Stringency level 1 designated LOD scores for speci®c stages of neoplasia. Stringency level 2 designated LOD scores for progression to higher stages of neoplasia. The pattern of LOD score 3 at=0.01 or 0.99 and LOD score 53 at=0.5 for the same marker were considered signi®cant. The strongest association between an altered marker and neoplasia was when a LOD score was 3 at=0.99 and 0.5 and 53 at=0.01. In this approach, the geographic relationship between LOH and speci®c phases of urothelial neoplasia was more important than the absolute number of alterations in individual mucosal samples and/or cystectomy specimens.
Therefore, LOH of a tested marker seen in several cystectomy specimens but without a geographic relationship to speci®c phases of neoplasia was not identi®ed as statistically signi®cant. On the other hand, LOH of limited number of samples which corresponded to distinct phases of bladder cancer development and progression was typically identi®ed as signi®cant. The use of LOD scores in this analysis was not the same as that commonly used in linkage analysis of familial genetic predisposition for diseases (Ott, 1991). Rather, it was intended to be used in its generic mathematical sense as a likelihood test of events (Brownlee, 1965). We used the LOD score variant of the likelihood test, as many researchers are more familiar with approximate
levels of signi®cance when expressed in this form. The relationships among LOH in individual loci and various clinico-pathological parameters of tumors and of voided urine samples were tested by Gehan's generalized Wilcoxon and log-rank tests (P40.05 was considered signi®cant). Analysis of contig and sequence data
The initial plan for our whole-organ histologic and genetic mapping of chromosome 16 involvement in bladder neoplasia was based on a map of hypervariable markers from Genethon, version March, 1996. However, during the course of this study rapidly emerging human genome sequence data with more accurate physical and sequence-based maps became available. To relate our ®ndings to these new resources, the markers de®ning deleted regions of chromo-some 16 were reoriented with the set of markers used to generate the current version of GeneMap99 (http:// www.ncbi.nlm.nih.gov/genemap99/). GeneMap99 represents the most complete melding of the microsatellite-based genetic map data from Genethon (http://www.genethon fr/) with the GB4 and G3 radiation hybrid panel-based physical map produced by the International Radiation Hybrid Mapping Consortium (http://www.ncbi.nlm.nih.gov/genemap99/page. cgi?F=Consortium.html). While some of the Marsh®eld sex-averaged markers used in this analysis can be found in GeneMap99, substitutes for those not found were proposed based primarily on the proximity of physical distances and in most instances location within the same BAC clone. The resources used to ®nd substitute markers included the `Golden Path' Genome Browser (http://genome.ucsc.edu/), based on the whole-genome ®ngerprint map assembly from Washington University (http://genome.wustl.edu/gsc/human/ human_database.shtml), the sequence-based mapping tools at the Ensembl website produced at the European Bioinfor-matics Institute (http://www.ensembl.org/), and the highly integrated MapViewer browser from the NCBI (http:// www . ncbi . nlm . nih . gov / cgi - bin / Entrez / hum_srch ? chr = hum_chr inf&query). Finally, these resources, together with NCBI's LocusLink (http://www.ncbi.nlm.nih.gov/LocusLink/) were used to scan the deleted regions for both known genes and EST clusters based on Unigene (http://www.ncbi.nlm.-nih.gov/UniGene/Hs.Home.html), while the BCM Search Launcher (http://www.hgsc.bcm.tmc.edu/SearchLauncher/) provided the portal and integration for these links. After reorientation of contigs based on multiple substitute markers, electronic PCR searches were performed to relocate the original set of markers de®ning the deleted regions. Since in most instances the continuous sequence of individual BAC clone was not available, the exact order of the original Genethon versus neighbor substitute markers within the single BAC clone is not known.
Acknowledgments
This work was supported by National Institutes of Health grants R29CA66723 and UO-1 CA85078 to Bogdan Czerniak.
References
Asgeirsson KS, Jonasson JG, Tryggvad L, Olafsd K, Sigurgeirsd JR, Ingvarsson S and Ogmundsd HM. (2000). Eur. J. Cancer, 36, 1098 ± 1106.
Brownlee KA. Statistical Theory and Methodology in Science and Engineering 2nd edn. (1965). John Wiley & Sons, Inc. New York.
Cairns P, Tokino K, Eby Y and Sidransky D. (1994). Cancer Res., 54, 1422 ± 1424.
Carter BS, Ewing CM, Ward WS, Treiger BF, Aalders TW, Schalken JA, Epstein JI and Isaacs WB. (1990). Proc. Natl. Acad. Sci. USA, 87, 8751 ± 8755.
Chang WYH, Cairns P, Schoenberg MP, Polascik TJ and Sidransky D. (1995). Cancer Res., 55, 3246 ± 3249. Chaturvedi V, Li L, Hodges S, Johnston D, Ro JY,
Logothetis C, Eschenbach A, Batsakis J and Czerniak B. (1997). Oncogene, 14, 2059 ± 2070.
Czerniak B, Chaturvedi V, Li L, Hodges S, Johnston D, Ro JY, Luthra R, Logothetis C, Eschen bach A, Grossman B, Benedict WF and Batsakis JG. (1999). Oncogene, 18, 1185 ± 1196.
Czerniak B Cohen GL, Etkind P, Deitch D, Simmons H, Herz F and Koss LG. (1992). Hum. Pathol., 23, 1199 ± 1204.
Czerniak B, Li L, Chaturvedi V, Ro JY, Johnston D, Hodges S and Benedict WF. (2000). Genes. Chromosomes. Cancer, 27, 392 ± 402.
Czerniak B and Herz F. (1995). Diagnostic Cytology of the Urinary Tract with Histopathologic and Clinical Correla-tions, Koss LG (ed). Lippincott-Raven. Philadelphia, pp 345 ± 359.
Devilee P, Van Vliet M, Van Sloun P, Kuipers-Dijkshoorn N, Hermans J, Pearson PL and Cornelisse CJ. (1991). Oncogene, 6, 1705 ± 1711.
Dutrillaux B, Gerbault-Seureau M and Zafrani B. (1990). Cancer Genet. Cytogenet., 49, 203 ± 217.
Gyapay G, Morissette J, Vignal A, Dib C, Fizames C, Millasseau P, Marc S, Bernardi G, Lathrop M and Weissenbach J. (1994). Nat. Genet., 7, 246 ± 339.
Hartigan JA. Clustering Algorithms, (1975). John Wiley & Sons, Inc. New York.
Hughes TR, Roberts CJ, Dai H, Jones AR, Meyer MR, Slade D, Burchard J, Dow S, Ward TR, Kidd MJ, Friend SH and Marton MJ. (2000). Nat. Genet., 25, 333 ± 337. Koss LG. (1979). Hum. Pathol., 10, 533 ± 548.
Koss LG and Czerniak B. (1991). N. Engl. J. Med., 324, 125 ± 126.
Koss LG, Nakanishi I and Freed SZ. (1977). Urology, 9, 442 ± 455.
Koss LG, Tiamson EM and Robbins MA. (1974). JAMA, 227, 281 ± 286.
Larsson C, Byrstrom C, Skoog L, Rotstein S and Nordenskjold M. (1990). Genes. Chromosome Cancer, 2, 191 ± 197.
Lininger RA, Park WS, Man YG, Pham T, Macgrogan G, Zhuang Z and Tavassoli FA. (1998). Human Pathol., 29, 1113 ± 1118.
Lucito R, West J, reiner A, Alexander J, Esposito D, Mishra B, Powers S, Norton L and Wigler M. (2000). Genome Res., 10, 1726 ± 1736.
Mao L, Schoenberg MP, Scicchitano M, Erozan YS, Merlo A, Schwab D and Sidransky D. (1996). Science, 271, 659 ± 662.
Mosto® FK (ed.). Histological Typing of Urinary Bladder Tumors (1999). Springer: New York.
Ott J. Analysis of Human Genetic Linkage. (1991). Johns Hopkins University Press: Baltimore.
Pan Y, Matsuyama H, Wang N, Yoshihiro S, Haggarth L, Li C, Tribukait B, Ekman P and Bergerheim US. (1998). Prostate, 36, 31 ± 38.
Rodgers CS, Hill SM and Hulten M. (1984). Cancer Genet. Cytogenet., 13, 95 ± 119.
Sato T, Tanigami A, Yamakawa K, Akiyama F, Kasumi F, Saka OG and Nakamura Y. (1990). Cancer Res., 50, 7184 ± 7189.
Sato M, Mori Y, Sakurada A, Fukushige S, Ishikawa Y, Tsuchiya E, Saito Y, Nukiwa T, Fujimura S and Hori A. (1998). Genes Chromosomes Cancer, 22, 1 ± 8.
Sobin LH and Wittekind C. TNM classi®cation of malignant tumors 5th ed. (1997). Wiley-Liss, New York.
Spruck CH III, Ohneseit PF, Gonzalez-Zulueta M, Esrig D, Noriomi M, Tsai YC, Lerner SP, Schumutte Yang AS, Cote R, Dubeau LD, Nichols PW, Hermann GG, Steven K, Horn T, Skinner DG and Jones PA. (1994). Cancer Res., 54, 784 ± 788.
Steiner G, Schoenberg MP, Linn JF, Mao L and Sidransky D. (1997). Nature Med., 3, 621 ± 624.
Tsuda H, Zhang W, Shimosato Y, Yokota J, Terada M, Sugimura T, Miyamura T and Hirohashi S. (1990). Proc. Natl. Acad. Sci. USA, 87, 6791 ± 6794.
Whitmore SA, Crawford J, Apostolou S, Eyre H, Baker E, Lower KM, Settasatian C, Goldup S, Seshadri R, Gibson RA, Mathew CG, Cleton-Jansen AM, Savoia A, Pronk JC, Auerbach AD, Doggett NA, Sutherland GR and Callen DF. (1998). Genomics, 50, 1 ± 8.