저작자표시-비영리-동일조건변경허락 2.0 대한민국 이용자는 아래의 조건을 따르는 경우에 한하여 자유롭게 l 이 저작물을 복제, 배포, 전송, 전시, 공연 및 방송할 수 있습니다. l 이차적 저작물을 작성할 수 있습니다. 다음과 같은 조건을 따라야 합니다: l 귀하는, 이 저작물의 재이용이나 배포의 경우, 이 저작물에 적용된 이용허락조건 을 명확하게 나타내어야 합니다. l 저작권자로부터 별도의 허가를 받으면 이러한 조건들은 적용되지 않습니다. 저작권법에 따른 이용자의 권리는 위의 내용에 의하여 영향을 받지 않습니다. 이것은 이용허락규약(Legal Code)을 이해하기 쉽게 요약한 것입니다. Disclaimer 저작자표시. 귀하는 원저작자를 표시하여야 합니다. 비영리. 귀하는 이 저작물을 영리 목적으로 이용할 수 없습니다. 동일조건변경허락. 귀하가 이 저작물을 개작, 변형 또는 가공했을 경우 에는, 이 저작물과 동일한 이용허락조건하에서만 배포할 수 있습니다.
Hair Na and K Concentration is Related with
the Risk of Coronary Artery Disease
in Korean Men
by
Hyejin Ryu
Major in Medicine
Department of Medical Sciences
The Graduate School, Ajou University
Hair Na and K Concentration is Related with
the Risk of Coronary Artery Disease
in Korean Men
by
Hyejin Ryu
A Dissertation Submitted to The Graduate School of
Ajou University in Partial Fulfillment of the Requirements
for the Degree of
Master of Medicine
Supervised by
Bom-Taeck Kim, M.D., Ph.D.
Major in Medicine
Department of Medical Sciences
The Graduate School, Ajou University
This certifies that the dissertation
of Hyejin Ryu is approved.
SUPERVISORY COMMITTEE
Bom-Taeck Kim
Jae-Ho Han
Sun-Il Kim
The Graduate School, Ajou University
December 13
th, 2013
i -ABSTRACT-
Hair Na and K Concentration is Related with the Risk of Coronary
Artery Disease in Korean Men
Imbalance in mineral metabolism, particularly sodium (Na) and potassium (K), is associated with increased risk of coronary artery disease (CAD). There has been no previous study to elucidate the relationship using hair mineral concentration which is a better reflection of body mineral content compared to conventional tests. A cross sectional observation was conducted on 523 men aged 20 years or older, who had visited the Ajou University Hospital for a periodic health check-up between 2009 and 2012. Hair mineral analysis was performed using mass spectrometry. CAD risk was calculated for each individual using the Framingham risk score. Hair Na and K concentrations showed positive correlations with Framingham risk score. Hair calcium (Ca) and magnesium (Mg) concentrations showed no correlation, while hair Ca/Na and Ca/K ratios showed negative correlations with coronary risk. The highest quartile of hair Na and K had significantly higher odds ratio (3.51 and 2.36) compared with the lowest quartile group and hair Ca/Na had significantly lower odds ratio (0.41) to have higher than 10% of 10 years CAD risk, even after adjustment for major CAD risk factors. High hair Na and K concentration is an independent risk factor for CAD. Hair Na and K concentration may be a useful predictor for CAD risk.
Keywords : Hair, Sodium, Potassium, Coronary artery disease, Framingham risk score
ii
TABLE OF CONTENTS
ABSTRACT...i TABLE OF CONTENTS...ii LIST OF FIGURES...iii LIST OF TABLES...iv I. INTRODUCTION...1II. MATERIALS AND METHODS...3
A. Study Population ...3
B. Measurement...3
1. Anthropometric measurements and screening questionnaire...3
2. Laboratory study...3
3. Framingham Risk Score (FRS)...4
4. Measurement of Hair Mineral Concentrations...4
C. Statistical analysis...4 D. Ethics statement...5 III. RESULTS...6 IV. DISCUSSION...12 V. CONCLUSION...15 VI. REFERENCES...16 국문요약...v
iii
Fig. 1. Scatter diagram of hair Na and total Framingham score point...9 Fig. 2. Scatter diagram of hair K and total Framingham score point...10
iv
Table 1. General characteristics of subjects and between the groups for CAD risk...6 Table 2. Hair tissue mineral concentrations between the groups for CAD risk...7 Table 3. Pearson correlation coefficients between CAD risk factors with FRS and
log-transformed hair mineral concentrations...8 Table 4. Odds Ratios (OR) for the high CAD risk group (10-year CAD risk ≥ 10%)
according to quartiles of hair mineral concentrations by logistic regression
1
I. INTRODUCTION
Coronary artery disease (CAD) is a major cause of death, claiming 7.3 million people globally every year.(Mendis et al., 2011) Although current preventive strategies for CAD focus on the control of risk factors such as hypertension, dyslipidemia and type 2 diabetes mellitus (T2DM), favorable changes in nutritional elements may provide additional benefits in the outcome for CAD prevention.(Vaskonen, 2003)
Imbalances in mineral intake, transport and storage are associated with metabolic deteriorations leading to increased CAD risk.(Masironi, 1969) For instance, it has been well documented that sodium (Na)-rich diets promote hypertension.(Kotchen et al., 2013) In a recent population-based study, low serum potassium (K) level was related to high serum triglyceride (TG) and low high density lipoprotein (HDL).(Sun et al., 2013) Ranee et al. (Chatterjee et al., 2010; Chatterjee et al., 2012) reported that both dietary K intake and serum K level are inversely associated with new onset T2DM. A recent meta-analysis showed that low sodium intake and high potassium intake are associated with a low risk of fatal CAD, stroke and cardiovascular diseases.(D'Elia et al., 2011; Aburto et al., 2013)
Earlier studies estimated mineral content in the body by measuring serum mineral concentration, 24 hr urine mineral contents or food frequency questionnaire. However, the mineral levels in serum are strictly regulated within a narrow range by homeostasis, such that serum mineral concentration is not a reliable surrogate to detect mineral deficiency or overload in the body.(Berne, 1998) Also, measuring mineral contents in urine is affected more by diet at the moment when the measurement occurs, rather than by accumulated amount of a mineral in the body.(Berne, 1998) In contrast, growing hair is a metabolically active and sequestering tissue, conferring information regarding intracellular mineral contents over a certain period of time.(Combs et al., 1982) The measurement of hair mineral content is non-invasive, practical for sampling and offers relatively long-term information.(Klevay et al., 1987) Several studies have demonstrated that hair calcium (Ca) level is associated with insulin resistance,(Chung and Yum, 2012) metabolic syndrome(Park et al., 2009) and aortic calcification.(Bacso et al., 1986) However, the relationship between CAD and hair concentrations of other minerals has not been elucidated, especially for Na
2
and K which is closely connected with CAD and CAD risk factors. Our study aimed to investigate the relationship between hair Na and K concentrations and CAD risk, using the Framingham Risk Score (FRS), in Korean men.
3
II. MATERIALS AND METHODS
A. Study PopulationThis study identified 655 healthy men 20 years of age and older who underwent a health check-up and hair mineral analysis at the Ajou University Hospital Health Center between March, 2009 and December, 2012. Exclusion criteria were past history of CAD, cerebrovascular disease, T2DM, liver cirrhosis or cancer. After eliminating 132 subjects due to exclusion criteria, 523 men were included in the analysis.
B. Measurements
1. Anthropometric measurements and screening questionnaire
Body mass index (BMI) was calculated as weight (kg) divided by height in meters squared (m2). Waist circumference (WC) was measured by a trained nurse at the middle part
between the lower rib and iliac crest. Blood pressure was measured using a standard mercury manometer with the participant in a sitting position for 5 minutes prior to measurement. A questionnaire was used to identify subjects who had past clinical history of CAD, cerebrovascular disease, hypertension, T2DM, hypercholesterolemia, liver cirrhosis, cancer, smoking, and alcohol consumption. Subjects who, at the time of the survey, had smoked cigarettes regularly within the prior year were considered to be current smokers and weekly alcohol consumption (grams of ethanol per week) was calculated by the graduated frequency method .(Greenfield, 2000)
2. Laboratory study
Blood sampling was performed after at least 8-hours fasting. Laboratory data from blood analysis including total cholesterol, HDL cholesterol, low-density lipoprotein (LDL) cholesterol, TG, fasting glucose, insulin, blood urea nitrogen, creatinine, gamma-glutamyl transferase (GGT), aspartate aminotransferase, alanine aminotransferase and high-sensitivity C-reactive protein. The homeostasis model assessment of insulin resistance (HOMA-IR) was calculated using Matthews’ method: fasting insulin (in microunits per milliliter) x fasting blood glucose (in millimoles per liter)/22.5.(Matthews et al., 1985)
4
3. Framingham Risk Score (FRS)The FRS is a mathematical model to predict the risk of developing CAD events during a 10-year period. The FRS was calculated from the National Cholesterol Education Program Adult Treatment Panel III (ATP III) algorithm based on six coronary risk factors: gender, age, total cholesterol, HDL, systolic blood pressure (BP) and smoking habit.(National Cholesterol Education Program Expert Panel on Detection, 2002) The total FRS points were used to categorize the subjects into two risk groups: low CAD risk (<10% risk of developing a CAD event over the next 10 years) and high CAD risk (≥10% risk of developing a CAD event over the next 10 years).
4. Measurement of Hair Mineral Concentrations
Only patients with uncolored hair and no shampoo use were accepted for the study. The hair sample was sent to the US TEI (Dallas, TX, USA) through Korea TEI (Trace Elements, Inc.). After washing with acetone, water, and Extran (1% v/v) and water, aliquots of hair samples were wet-ashed according to the following procedure: a 250 mg sample was wet digested overnight with 2.5 ml of HNO3 in a closed, graduated polypropylene tube (50 ml) at
room temperature, and then placed in a drying oven for 1 h at 60~70 ℃. After cooling to room temperature, the sample was diluted to a final volume of 25 ml with Milli Q water. This solution was analyzed using a Perkin-Elmer Mass Spectrometer (SciexElan 6100, Perkin-Elmer Corporation, Foster, CA, USA)(Miekeley et al., 2001). The mineral concentrations are shown as mg% (in milligrams per 100 g of hair).
C. Statistical analysis
SPSS 18.0 (SPSS Ltd, Chicago, IL, USA) was used for all statistical analysis. Data are presented as the mean ± standard deviation (SD) for continuous variables and as number (percentages) for discrete variables unless otherwise indicated. General characteristics and hair mineral concentrations were compared between the low CAD risk and the high CAD risk groups using the Student’s t-test. The natural log-transformed hair mineral concentration was used to compensate for skewness. The Pearson’s correlation was used to examine the relationship between the log-transformed hair mineral concentrations and FRS or CAD risk
5
factors. We constructed logistic regression to analyze the odds ratio (OR) for the high CAD risk group according to quartiles of log-transformed hair Na, K, Ca/Na and Ca/K concentrations. For this analysis, the lowest quartile (Q1) group of each hair Na, K, Ca/Na and Ca/K was used as a reference group and considered 5 models: (1) unadjusted; (2) adjusted only for age and BMI; (3) adjusted for age, BMI, systolic BP, diastolic BP, total cholesterol, HDL, LDL, TG, fasting glucose, and GGT; (4) adjusted for covariates of model (3) plus log-transformed hair K concentration applied to hair Na and Ca/Na groups; (5) adjusted for covariates of model (3) plus log-transformed hair Na concentration applied to hair K and Ca/K groups. For all analysis, p values <0.05 were considered statistically significant.
D. Ethics statement
All participants agreed to the use of their health check-up results. The institutional review board of Ajou University Hospital approved this study (AJIRB-MED-MDB-13-220). Informed consent was waived by the board.
6
III. RESULTS
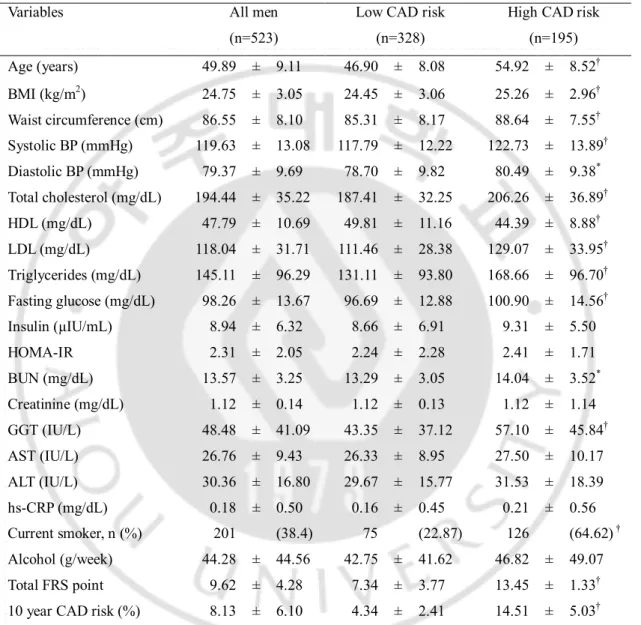
General characteristics of the subjects are presented in Table 1. There were significant differences in age, BMI, WC, BP, lipid profiles, fasting glucose, GGT and current smoking status between the low risk group and high risk group.
Table 1. General characteristics of subjects and between the groups for CAD risk.
Variables All men (n=523)
Low CAD risk (n=328)
High CAD risk (n=195) Age (years) 49.89 ± 9.11 46.90 ± 8.08 54.92 ± 8.52† BMI (kg/m2) 24.75 ± 3.05 24.45 ± 3.06 25.26 ± 2.96† Waist circumference (cm) 86.55 ± 8.10 85.31 ± 8.17 88.64 ± 7.55† Systolic BP (mmHg) 119.63 ± 13.08 117.79 ± 12.22 122.73 ± 13.89† Diastolic BP (mmHg) 79.37 ± 9.69 78.70 ± 9.82 80.49 ± 9.38* Total cholesterol (mg/dL) 194.44 ± 35.22 187.41 ± 32.25 206.26 ± 36.89† HDL (mg/dL) 47.79 ± 10.69 49.81 ± 11.16 44.39 ± 8.88† LDL (mg/dL) 118.04 ± 31.71 111.46 ± 28.38 129.07 ± 33.95† Triglycerides (mg/dL) 145.11 ± 96.29 131.11 ± 93.80 168.66 ± 96.70† Fasting glucose (mg/dL) 98.26 ± 13.67 96.69 ± 12.88 100.90 ± 14.56† Insulin (µIU/mL) 8.94 ± 6.32 8.66 ± 6.91 9.31 ± 5.50 HOMA-IR 2.31 ± 2.05 2.24 ± 2.28 2.41 ± 1.71 BUN (mg/dL) 13.57 ± 3.25 13.29 ± 3.05 14.04 ± 3.52* Creatinine (mg/dL) 1.12 ± 0.14 1.12 ± 0.13 1.12 ± 1.14 GGT (IU/L) 48.48 ± 41.09 43.35 ± 37.12 57.10 ± 45.84† AST (IU/L) 26.76 ± 9.43 26.33 ± 8.95 27.50 ± 10.17 ALT (IU/L) 30.36 ± 16.80 29.67 ± 15.77 31.53 ± 18.39 hs-CRP (mg/dL) 0.18 ± 0.50 0.16 ± 0.45 0.21 ± 0.56 Current smoker, n (%) 201 (38.4) 75 (22.87) 126 (64.62) † Alcohol (g/week) 44.28 ± 44.56 42.75 ± 41.62 46.82 ± 49.07 Total FRS point 9.62 ± 4.28 7.34 ± 3.77 13.45 ± 1.33†
10 year CAD risk (%) 8.13 ± 6.10 4.34 ± 2.41 14.51 ± 5.03†
* P < 0.05, † P < 0.01; Statistical significances between low and high CAD risk groups were tested by Student’s t test. Values are presented as mean ± standard deviations (SD) or number (%) unless
7
otherwise indicated. BMI: body mass index, BP: blood pressure, HDL: high-density lipoprotein, LDL: low-density lipoprotein, HOMA-IR: homeostasis assessment model-insulin resistance, GGT: gamma-glutamyl transferase, AST: aspartate aminotransferase, ALT: alanine aminotransferase, hs-CRP: high-sensitivity C-reactive protein, FRS : Framingham risk score, CAD: coronary artery disease
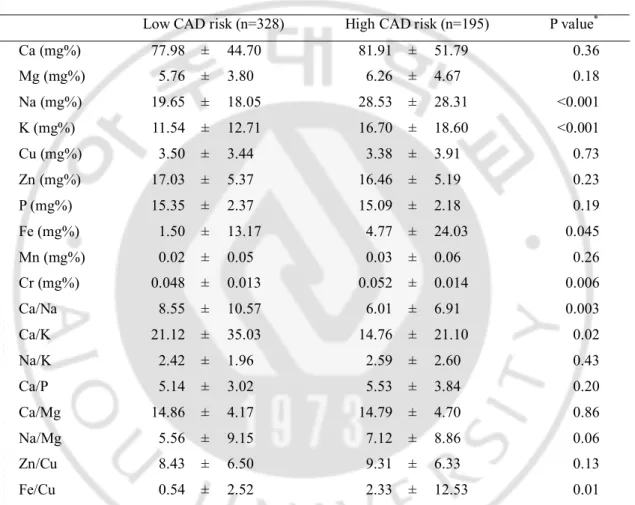
There was no difference observed between the groups in hair Ca and magnesium (Mg) levels, the Na, K and iron (Fe) concentrations in hair were significantly elevated in the high risk group (Table 2.).
Table 2. Hair tissue mineral concentrations between the groups for CAD risk.
Low CAD risk (n=328) High CAD risk (n=195) P value*
Ca (mg%) 77.98 ± 44.70 81.91 ± 51.79 0.36 Mg (mg%) 5.76 ± 3.80 6.26 ± 4.67 0.18 Na (mg%) 19.65 ± 18.05 28.53 ± 28.31 <0.001 K (mg%) 11.54 ± 12.71 16.70 ± 18.60 <0.001 Cu (mg%) 3.50 ± 3.44 3.38 ± 3.91 0.73 Zn (mg%) 17.03 ± 5.37 16.46 ± 5.19 0.23 P (mg%) 15.35 ± 2.37 15.09 ± 2.18 0.19 Fe (mg%) 1.50 ± 13.17 4.77 ± 24.03 0.045 Mn (mg%) 0.02 ± 0.05 0.03 ± 0.06 0.26 Cr (mg%) 0.048 ± 0.013 0.052 ± 0.014 0.006 Ca/Na 8.55 ± 10.57 6.01 ± 6.91 0.003 Ca/K 21.12 ± 35.03 14.76 ± 21.10 0.02 Na/K 2.42 ± 1.96 2.59 ± 2.60 0.43 Ca/P 5.14 ± 3.02 5.53 ± 3.84 0.20 Ca/Mg 14.86 ± 4.17 14.79 ± 4.70 0.86 Na/Mg 5.56 ± 9.15 7.12 ± 8.86 0.06 Zn/Cu 8.43 ± 6.50 9.31 ± 6.33 0.13 Fe/Cu 0.54 ± 2.52 2.33 ± 12.53 0.01
* Statistical significances were tested by Student’s t test. Values are presented as mean ± standard
deviations (SD). CAD: coronary artery disease, Ca: calcium, Mg: magnesium, Na: sodium, K: potassium, Cu: copper, Zn: zinc, P: phosphorus, Fe: iron, Mn: manganese, Cr: chromium
8
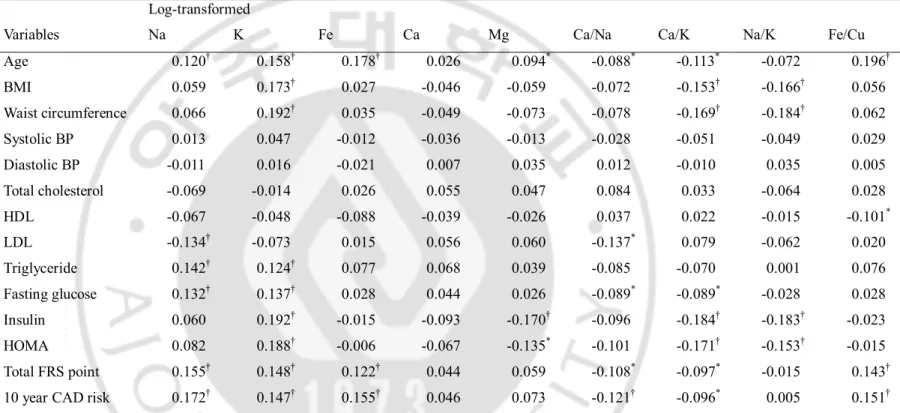
Table 3. Pearson correlation coefficients between CAD risk factors with FRS and log-transformed hair mineral concentrations.
Log-transformed
Variables Na K Fe Ca Mg Ca/Na Ca/K Na/K Fe/Cu Age 0.120† 0.158† 0.178† 0.026 0.094* -0.088* -0.113* -0.072 0.196† BMI 0.059 0.173† 0.027 -0.046 -0.059 -0.072 -0.153† -0.166† 0.056 Waist circumference 0.066 0.192† 0.035 -0.049 -0.073 -0.078 -0.169† -0.184† 0.062 Systolic BP 0.013 0.047 -0.012 -0.036 -0.013 -0.028 -0.051 -0.049 0.029 Diastolic BP -0.011 0.016 -0.021 0.007 0.035 0.012 -0.010 0.035 0.005 Total cholesterol -0.069 -0.014 0.026 0.055 0.047 0.084 0.033 -0.064 0.028 HDL -0.067 -0.048 -0.088 -0.039 -0.026 0.037 0.022 -0.015 -0.101* LDL -0.134† -0.073 0.015 0.056 0.060 -0.137* 0.079 -0.062 0.020 Triglyceride 0.142† 0.124† 0.077 0.068 0.039 -0.085 -0.070 0.001 0.076 Fasting glucose 0.132† 0.137† 0.028 0.044 0.026 -0.089* -0.089* -0.028 0.028 Insulin 0.060 0.192† -0.015 -0.093 -0.170† -0.096 -0.184† -0.183† -0.023 HOMA 0.082 0.188† -0.006 -0.067 -0.135* -0.101 -0.171† -0.153† -0.015 Total FRS point 0.155† 0.148† 0.122† 0.044 0.059 -0.108* -0.097* -0.015 0.143†
10 year CAD risk 0.172† 0.147† 0.155† 0.046 0.073 -0.121† -0.096* 0.005 0.151† * P < 0.05; † P < 0.01; BMI: body mass index, BP: blood pressure, HDL: high-density lipoprotein, LDL: low-density lipoprotein, HOMA-IR:
9
Log-transformed hair Na, K and Fe concentrations showed positive correlations with total FRS points and 10 year CAD risk (Table 3). There was no correlation between log-transformed hair Ca or Mg concentration and total FRS points, however hair Mg concentration showed a significant negative correlation with insulin and HOMA-IR.
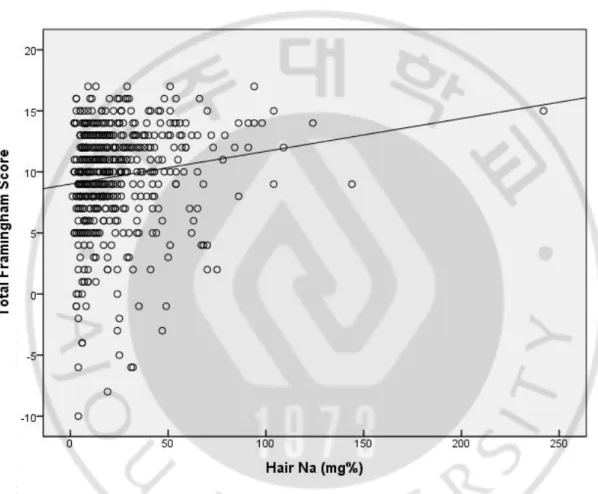
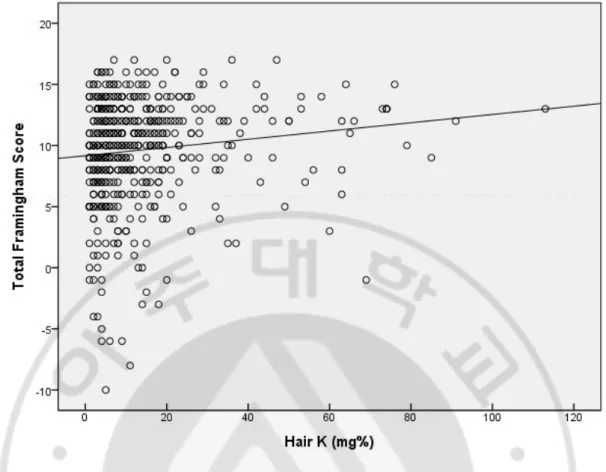
Figure 1 and 2 show the weak but significant positive correlations between total FRS points and hair Na (R2=0.02, p=0.001) and hair K (R2=0.015, p=0.006) by linear regression
analysis.
Fig. 1. Scatter diagram of hair Na and total Framingham score point. Hair Na showed positive correlation with the total Framingham score point. (R=0.143, P=0.001)
10
Fig. 2. Scatter diagram of hair K and total Framingham score point. Hair K showed positive correlation with the total Framingham score point. (R=0.121, P=0.006)
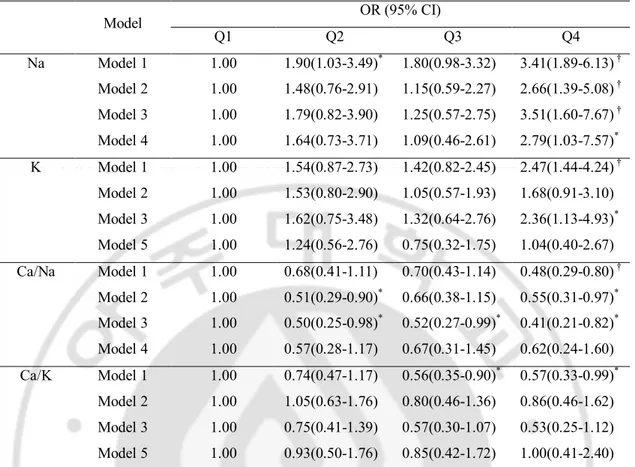
The highest quartile of log-transformed hair Na and K was likely to have higher CAD risk about 3.4 and 2.5 times of OR, respectively, compared with the lowest quartile group. The highest quartile of hair Ca/Na and Ca/K had approximately 50% of the lowest quartile’s CAD risk (Table 4). These relationships remained statistically significant after adjustment for age, BMI, BP, lipid profiles, fasting glucose and GGT. The highest quartile of hair Na had a significantly higher OR in high CAD risk even after additional adjustment for hair K concentration (OR=2.79, p=0.044), but not vice versa.
11
Table 4. Odds Ratios (OR) for the high CAD risk group (10-year CAD risk ≥ 10%) according to quartiles of hair mineral concentrations by logistic regression analysis.
Model OR (95% CI) Q1 Q2 Q3 Q4 Na Model 1 1.00 1.90(1.03-3.49)* 1.80(0.98-3.32) 3.41(1.89-6.13) † Model 2 1.00 1.48(0.76-2.91) 1.15(0.59-2.27) 2.66(1.39-5.08) † Model 3 1.00 1.79(0.82-3.90) 1.25(0.57-2.75) 3.51(1.60-7.67) † Model 4 1.00 1.64(0.73-3.71) 1.09(0.46-2.61) 2.79(1.03-7.57)* K Model 1 1.00 1.54(0.87-2.73) 1.42(0.82-2.45) 2.47(1.44-4.24) † Model 2 1.00 1.53(0.80-2.90) 1.05(0.57-1.93) 1.68(0.91-3.10) Model 3 1.00 1.62(0.75-3.48) 1.32(0.64-2.76) 2.36(1.13-4.93)* Model 5 1.00 1.24(0.56-2.76) 0.75(0.32-1.75) 1.04(0.40-2.67) Ca/Na Model 1 1.00 0.68(0.41-1.11) 0.70(0.43-1.14) 0.48(0.29-0.80) † Model 2 1.00 0.51(0.29-0.90)* 0.66(0.38-1.15) 0.55(0.31-0.97)* Model 3 1.00 0.50(0.25-0.98)* 0.52(0.27-0.99)* 0.41(0.21-0.82)* Model 4 1.00 0.57(0.28-1.17) 0.67(0.31-1.45) 0.62(0.24-1.60) Ca/K Model 1 1.00 0.74(0.47-1.17) 0.56(0.35-0.90)* 0.57(0.33-0.99)* Model 2 1.00 1.05(0.63-1.76) 0.80(0.46-1.36) 0.86(0.46-1.62) Model 3 1.00 0.75(0.41-1.39) 0.57(0.30-1.07) 0.53(0.25-1.12) Model 5 1.00 0.93(0.50-1.76) 0.85(0.42-1.72) 1.00(0.41-2.40) Model 1, unadjusted; Model 2, after adjustment for age and BMI; Model 3, model 2 plus after adjustment for systolic BP, diastolic BP, total cholesterol, HDL, LDL, triglyceride, fasting glucose and GGT; Model 4, model 3 plus after adjustment log-transformed hair K concentrations; Model 5, model 3 plus after adjustment log-transformed hair Na concentrations
12
IV. DISCUSSION
We demonstrated that log-transformed hair Na and K concentrations positively correlated with the FRS independent of major CAD risk factors. Also, the hair Ca/Na ratio was inversely associated with CAD risk.
A previous study showed that hair Na and K concentrations were significant higher in patients with metabolic syndrome.(Park et al., 2009) In this study, hair Na and K concentrations correlated with metabolic syndrome components such as TG and fasting glucose.
The importance of dietary Na restriction to lower CAD risk is widely recognized. High Na intake not only expands plasma volume, but also elevates vascular tone. High serum Na level raises the concentrations of endogenous cardiac glycosides that inhibit the Na+, K+-ATPase on the plasma membrane of arterial smooth muscle, and results in accumulation of Na+ in the subplasma-membrane space.(Iwamoto and Kita, 2006) The retention of Na+ in the arterial smooth muscle facilitates Ca2+ entry through Na+/Ca2+ exchanger on the plasma membrane and causes vasoconstriction.
Also, dietary Na increases shear stress on arterial endothelial cells by fluid retention. Increased shear stress stimulates Transforming growth factor-β1 production and nitric oxide (NO) synthesis in endothelial cells through augmentation of NO synthase expression.(Ying and Sanders, 1999) Transforming growth factor-β1 is a fibrogenic growth factor and overexpression produces a reversible cellular- and matrix-rich neointima in the arterial wall. NO plays critical role in vascular remodeling as well as in BP regulation. Therefore, chronic high Na intake causes fibrosis of arteries and loss of elasticity which ultimately exacerbates CAD risk, independently of BP.(Safar et al., 2009) This may explain how the effect of hair Na is independent of BP or other CAD risk factors in our study.
It is well known that high K intake has cardio-protective effects by modifying CAD risk factors such as BP(Tunstall-Pedoe, 1999) and fasting glucose.(Chatterjee et al., 2010) However, K homeostasis is influenced by the levels of other minerals and hormones as well as dietary K intake. In a small cross sectional study, the hypotensive effect of high K intake was neutralized by concurrent Na supplementation.(Rebacz-Maron et al., 2013) Our result also showed disappearance of the relationship between hair K concentration and CAD risk,
13
after adjustment for hair Na level. Aldosterone is a major endocrine regulator of K homeostasis. While aldosterone decreases plasma K level by activating Na+, K+-ATPase in the renal tubule, aldosterone stimulates intracellular K uptake(Syed and Qureshi, 2012) in the same manner and results in an elevated hair K concentration. Insulin stimulates K uptake into cells, as well. It has been confirmed that obesity and insulin resistance activates the renin-angiotensin-aldosterone system which leads to fluid retention, endothelial cell dysfunction and atherosclerosis.(Lamounier-Zepter and Ehrhart-Bornstein, 2006; Syed and Qureshi, 2012) These observations are consistent with the observations in this current study which showed that hair K concentration correlates with BMI, WC, serum insulin and HOMA-IR.
Several studies have reported the association of hair Ca with CAD risk, which still remains inconsistent.(MacPherson and Bacso, 2000; Park et al., 2009) Bacso et al. reported an inverse relationship between hair Ca level and aortic calcification(Bacso et al., 1986) and between hair Ca level and CAD mortality.(MacPherson and Bacso, 2000) Another study included hypertensive obese patients with insulin resistance who inherently had a significantly higher hair Ca concentration compared to healthy controls.(Suliburska et al., 2011) These results do not show concordance probably because Ca metabolism is regulated by numerous factors such as oral Ca intake, bone turnover, and endocrine status,(Jeruszka-Bielak and Brzozowska, 2011) which were not fully considered as variables in the previous studies. Hair Na level also impacts hair Ca level as high Na intake facilitates intracellular Ca uptake through Na+/Ca2+ exchanger as mentioned above. This may support our observation that CAD risk has a significant negative correlation with hair Ca/Na, but not with hair Ca itself.
Hair mineral analysis provides information regarding the intracellular levels of minerals such as Na and K, reflecting not only dietary intake but also pathologic and physiologic conditions. Because minerals accumulate in hair at least 10 times more compared to minerals concentrated in serum and urine, hair is more sensitive and reliable for detecting mineral imbalances in the body compared with serum and urine analysis.(Combs et al., 1982) The current study is the first study to demonstrate the relationship between hair Na, K concentration and CAD risk. This relationship persisted, independent of other major CAD risk factors such as age, BMI, BP, lipid profiles and fasting glucose. These data suggest that
14
hair mineral content may be a non-invasive predictor of CAD risk.(MacPherson and Bacso, 2000)
This study has a few limitations. First, to obtain a more precise representation of Na and K metabolism in the body, more endocrine factors and life-style factors need to be assessed such as food analysis and aldosterone level. However, our analysis did include serum insulin level which contributes to the regulation of hair K concentration. Second, data were obtained from periodic health check-ups of men without any apparent sign of cardiovascular diseases and few adults with 10 year CAD risk higher than 20% were included in this study. In spite of these limitations, we successfully demonstrated distinctive differences between the low and high CAD risk groups in hair mineral levels and CAD risk factors.
15
V. CONCLUSION
High hair Na and K concentration is an independent risk factor for CAD risk in healthy adult men. Therefore, hair mineral analysis is a useful tool to predict CAD risk. In the future, due to the cross-sectional character of this study, a longitudinal study is required as the next step for establishing the relationship between hair Na and K concentrations and future CAD risk.
16
VI. REFERENCES
1. Aburto NJ, Ziolkovska A, Hooper L, Elliott P, Cappuccio FP, Meerpohl JJ: Effect of
lower sodium intake on health: systematic review and meta-analyses. BMJ 346: f1326, 2013
2. Bacso J, Lusztig G, Pal A, Uzonyi I: Comparative investigation of some mineral elements in the aortic wall and the calcium concentration in hair. Exp Pathol 29: 119-125, 1986
3. Berne RM, Levy MN, Koeppen BM, Stanton BA: Physiology. 5th ed. St. Louis,
Mosby, pp.685-702, 1998
4. Chatterjee R, Colangelo LA, Yeh HC, Anderson CA, Daviglus ML, Liu K, Brancati
FL: Potassium intake and risk of incident type 2 diabetes mellitus: the Coronary Artery Risk Development in Young Adults (CARDIA) Study. Diabetologia 55: 1295-1303, 2012
5. Chatterjee R, Yeh HC, Shafi T, Selvin E, Anderson C, Pankow JS, Miller E, Brancati
F: Serum and dietary potassium and risk of incident type 2 diabetes mellitus: The Atherosclerosis Risk in Communities (ARIC) study. Arch Intern Med 170: 1745-1751, 2010
6. Chung JH, Yum KS: Correlation of hair mineral concentrations with insulin
resistance in Korean males. Biol Trace Elem Res 150: 26-30, 2012
7. Combs DK, Goodrich RD, Meiske JC: Mineral concentration in hair as indicators of
the mineral status. J Anim Sci 54: 391-398, 1982
8. D'Elia L, Barba G, Cappuccio FP, Strazzullo P: Potassium intake, stroke, and cardiovascular disease a meta-analysis of prospective studies. J Am Coll Cardiol 57: 1210-1219, 2011
9. Greenfield TK: Ways of measuring drinking patterns and the difference they make:
experience with graduated frequencies. J Subst Abuse 12: 33-49, 2000
10. Iwamoto T, Kita S: Hypertension, Na+/Ca2+ exchanger, and Na+, K+-ATPase.
17
11. Jeruszka-Bielak M, Brzozowska A: Relationship between nutritional habits and hair
calcium levels in young women. Biol Trace Elem Res 144: 63-76, 2011
12. Klevay LM, Bistrian BR, Fleming CR, Neumann CG: Hair analysis in clinical and
experimental medicine. Am J Clin Nutr 46: 233-236, 1987
13. Kotchen TA, Cowley AW, Jr., Frohlich ED: Salt in health and disease--a delicate balance. N Engl J Med 368: 1229-1237, 2013
14. Lamounier-Zepter V, Ehrhart-Bornstein M: Fat tissue metabolism and adrenal
steroid secretion. Curr Hypertens Rep 8: 30-34, 2006
15. MacPherson A, Bacso J: Relationship of hair calcium concentration to incidence of
coronary heart disease. Sci Total Environ 255: 11-19, 2000
16. Masironi R: Trace elements and cardiovascular diseases. Bull World Health Organ 40: 305-312, 1969
17. Matthews DR, Hosker JP, Rudenski AS, Naylor BA, Treacher DF, Turner RC:
Homeostasis model assessment: insulin resistance and beta-cell function from fasting plasma glucose and insulin concentrations in man. Diabetologia 28: 412-419, 1985
18. Mendis S, Puska P, Norrving B: Global atlas on cardiovascular disease prevention and control. Geneva, World Health Organization in collaboration with the World Heart Federation and the World Stroke Organization, 2011
19. Miekeley N, de Fortes Carvalho LM, Porto da Silveira CL, Lima MB: Elemental anomalies in hair as indicators of endocrinologic pathologies and deficiencies in calcium and bone metabolism. J Trace Elem Med Biol 15: 46-55, 2001
20. National Cholesterol Education Program Expert Panel on Detection, Evaluation, and
Treatment of High Blood Cholesterol in Adults: Third Report of the National Cholesterol Education Program (NCEP) Expert Panel on Detection, Evaluation, and Treatment of High Blood Cholesterol in Adults (Adult Treatment Panel III) final report. Circulation 106: 3143-3421, 2002
21. Park SB, Choi SW, Nam AY: Hair tissue mineral analysis and metabolic syndrome.
18
22. Rebacz-Maron E, Baranowska-Bosiacka I, Gutowska I, Chlubek D: Blood pressure
and levels of Fe, Ca, Mg, Zn, Cu, Na and K in the hair of young Bantu men from Tanzania. Biol Trace Elem Res 151: 350-359, 2013
23. Safar ME, Temmar M, Kakou A, Lacolley P, Thornton SN: Sodium intake and
vascular stiffness in hypertension. Hypertension 54: 203-209, 2009
24. Suliburska J, Bogdanski P, Pupek-Musialik D, Krejpcio Z: Dietary intake and serum
and hair concentrations of minerals and their relationship with serum lipids and glucose levels in hypertensive and obese patients with insulin resistance. Biol Trace Elem Res 139: 137-150, 2011
25. Sun K, Su T, Li M, Xu B, Xu M, Lu J, Liu J, Bi Y, Ning G: Serum potassium level is
associated with metabolic syndrome: A population-based study. Clin Nutr, 2013
26. Syed SB, Qureshi MA: Association of aldosterone and cortisol with cardiovascular
risk factors in prehypertension stage. Int J Hypertens 2012: 906327, 2012
27. Tunstall-Pedoe H: Does dietary potassium lower blood pressure and protect against
coronary heart disease and death? Findings from the Scottish Heart Health Study? Semin Nephrol 19: 500-502, 1999
28. Vaskonen T: Dietary minerals and modification of cardiovascular risk factors. J Nutr
Biochem 14: 492-506, 2003
29. Ying WZ, Sanders PW: Dietary salt increases endothelial nitric oxide synthase and
v -국문요약-
한국 남성에서 모발 나트륨 및 칼륨 농도와
관상동맥질환의 위험도와의 관계
아주대학교 대학원 의학과 류 혜 진 (지도교수: 김 범 택) 미네랄 불균형과 관상동맥질환의 위험성의 관계는 밝혀진 바 있다. 그러 나 지금까지 체내 미네랄 상태를 기존의 방법들 보다 더 잘 반영하는 모발미네 랄검사를 이용하여 이 관계를 보여준 연구는 없다. 본 연구는 단면적 연구로, 2009년부터 2012년까지 아주대학교병원 건강증 진센터에서 모발미네랄검사를 포함한 건강검진을 시행한 20세 이상의 남성 523 명의 데이터를 대상으로 하였다. 관상동맥질환의 위험도는 프래밍험 위험지수를 이용하여 계산하였다. 대상군을 모발 나트륨, 칼륨 농도 및 칼슘/나트륨 비에 따 라 4분할로 나누어 분석하였다. 모발 나트륨과 칼륨 농도와 프래밍험 위험지수는 양의 상관관계를 보였 다. 프래밍험 위험지수는 모발 칼슘, 마그네슘과는 상관관계를 보이지 않았으나, 모발 칼슘/나트륨 및 칼슘/칼륨 비와 음의 상관관계를 보였다. 모발 미네랄 농도 에 따라 4분할로 나눈 그룹 중 가장 낮은 값을 가진 그룹을 기준으로 비교하였 을 때, 주요 관상동맥질환의 위험요소를 보정한 후에도 모발 나트륨, 칼륨 농도 중 가장 높은 값을 가진 그룹은 의미 있게 높은 오즈비(나트륨: 3.51, 칼륨: 2.36) 를 보였으며 모발 칼슘/나트륨 비 그룹은 의미 있게 낮은 오즈비(0.41)를 보였다. 높은 모발 나트륨 및 칼륨 농도는 관상동맥질환 위험도에 대한 독립적인 위험인자이다. 모발 나트륨 및 칼륨 농도를 이용하여 관상동맥질환의 위험도를vi 예측할 수 있다.
핵심어: 모발, 나트륨, 칼륨, 관상동맥질환, 프래밍험 위험지수