94
1. Introduction
The energy consumption of lighting in buildings is a major contributor to carbon emissions, often estimated as 20-40% of the total building energy consumption [1-3]. According to a recent review, investing in energy-efficient lighting is one of the
most cost-effective solutions to reduce CO2 emissions, and other studies have shown that existing technology could reduce electricity use for lighting by 50% [4-7]. Integrating lighting controls and HVAC systems is complex, and it can offer significant energy savings in a high-performance building through its deep insight design and control technology. The research on building material and structure, heating and cooling systems, renewable energy, and lighting techniques, has made great
Comparative study on the effect of cooling & heating
loads by lighting energy of various light sources in an
office building
Won Pyo, Hong*
Abstract
The objective of the work was to evaluate the impact of lighting energy to cooling and heating consumption in medium scale office building, when currently installed fluorescent lights were replaced with various LED lighting fixtures. This evaluation comes from an integrated approach combining the proper indoor lighting environment and the thermal aspects of cooling & heating consumption in office building. These simulations were performed by coupling an appropriate luminaire analysis for energy consumption and a dynamic thermal simulation software (TRNSYS). To analyze comparative study of effects on the heating, cooling loads, and energy consumption of an LED lamp application, 2 types of LED lamp with low light power watt(LPW) 24W and high LPW 7.5W and a fluorescent lights(FL) with 37W are used respectively. Integrated building energy consumption decreased up to 3.2% when fluorescent lamps were replaced with LEDs. Thus, the high LPW of LED(7.5W) replaced with the same number of FL shows an effective energy saving and cost- effective luminary.
Key Words:Light Emitting Diodes(LED) Lamp, Fluorescent lights(FL), Light Power Watt(LPW), Heating & Cooling Energy, Lighting Simulation, Integrated Energy Performance Simulation of Building
* Main author:Dept. of Building & Plant Engineering, Hanbat National University, Korea Tel:042-821-1179, Fax:042-821-1175
E-mail:[email protected] Received:2016. 1. 20.
Accepted:2016. 3. 3.
improvements in energy saving technology. The solid-state lighting (SSL) revolution signals a profound shift in how we will use and consider lighting and represents a huge opportunity to generate significant energy savings. Converting to LED lighting system is a popular approach to improve energy performance of building lighting system [5,8]. In particular, LED lighting which was developed to replace traditional lighting sources such as halogen, incandescent, fluorescent tube and compact fluorescent lamp (CFL), is expected to play a critical role in light energy reduction. Thus, rising electricity prices, mounting concerns about climate change, and desire for energy independence are causing the global lighting market to shift toward more energy-efficient light sources. Nowadays, the most electricity-saving and energy efficient lighting products is LED lamp. LEDs and electrode less induction lamps have 9-10 times longer lives compared to compact fluorescent lamps (CFL). They have higher PF and lower THD compared to CFL. LED lamps use RGB system or multiple phosphors technique to produce white light. For these reasons, LED technology is being considered as the next generation of lighting [9].
In Korea, the government plans to replace more than 30% of existing lighting fixtures in public institutions with LED lights by the end of 2012, and has established regulations specifying that from 2013, in new constructions and in the expansion and reconstruction of existing buildings, more than 60% LED products will be installed in 2020. Thus, the LED industry has been growing steadily in size and value owing to the support of governmental policies [10].
In America, LED lighting is forecasted to account for the majority of installations by 2030,
representing 88% of the lumen-hours being generated by general illumination [11]. The high efficacy of SSL sources is a critical factor in the drive for higher adoption. LED lighting is already as efficient, or more efficient, than most incumbent technologies, but there is plenty more to come. Using fairly conservative projections for performance improvements, the Department of Energy (DOE) has determined that by 2030, LED technology can potentially save 261 terawatt-hours (TWh) annually, a 40% reduction of the site electricity consumption forecasted for a counter-factual “no-LED” scenario [12] and The U.S. DOE expects LED technology to reach a 200 lumen per watt efficiency by 2030. LEDs are estimated to capture 28 percent of the commercial market by 2020 and could reach 70 percent of that market by 2030[13].
Japan, through the ‘Light for the 21st Century project’, has set a goal of a 20% reduction in lighting energy by widespread installation of white LED lighting and development of 120lm/W LED technology [14]. According to the 2010 revised Japanese Energy Basic Plan, Japan plans to replace 100% of existing lights with highly efficient technologies including by 2020 [15]. EU declared the European LED Quality Charter on 4 May 2010 in Ispra (Italy) and EU Key Climate and Energy Objectives for 2020. lighting plays a key-role for 20% energy saving target such as efficient solutions and new technologies, including LEDs and SSL [16]. LED luminaires are already more efficient than incandescent lamps, halogen lamps, CFL, and most linear fluorescent luminaires, while initial OLED luminaire products have efficacy nearing that of CFLs. LED products are already as efficient, or
more efficient, than most incumbent
prices. There is significant room for improvement in terms of performance and price for LED-based SSL products. The analysis shows that 250 lumens per watt (lm/W) is an achievable performance target for LED packages and excellent progress toward this target has been demonstrated in the laboratory. LED luminaires offer improvements of up to 100lm/W over the best efficacies possible for incumbent technologies [17]. Furthermore, the convergence of many technologies with SSL is providing new opportunities for connectivity with lighting. We are rapidly moving towards a future where all building systems, including lighting, HVAC, and
security, will be networked through
internet-enabled components. This will change the way lighting is valued. However, approximately 75-85% of the light electric power in LED lights is still generated as heat, although heat generation and thermal management technologies are being developed [2,18]. Therefore, the proper emission of heat from the junction is critical for the improvement of the lighting performance. Generally, initial light intensity and light intensity after LED operation changed depending on the temperature of LED lamps, indicating the ratio of initial light intensity to light intensity rapidly decreases at high temperature. LEDs are not a directional light source but instead they use a system in which light is condensed with a reflecting mirror and an epoxy lens in the luminaire. The thermal properties of a light source depend on the method of installation of the light fixture. Generally, incandescent lights are suspended from the ceiling, whereas fluorescent lights and LED lights are mounted on the ceiling in a recess. For suspended-type lighting, the light fixtures emit radiant heat into the room along with visible
light, and this increases the indoor cooling load generally. For recessed-type fluorescent lighting, less radiant heat is emitted than that from the suspended type, and the remaining heat stays in the ceiling as convective heat. However, for LED lighting, most of the heat generated stays in the ceiling as convective heat because no radiant heat is emitted from the light source and this increases the indoor cooling load [19].
The use of highly efficient systems and energy saving technologies have been made a very high priority among various green building rating systems to improve the overall energy performance of a building. In particular, LED lighting, which was developed to replace traditional lighting sources is expected to play a critical role in light energy reduction and furthermore, for the sustainable low carbon buildings. However, retrofitting the fluorescent lights by LED lamp doesn’t only give the merits in viewpoint of indoor illumination level and cooling & heating loads in building. The heat gains produced from such lighting have an important influence upon heating and cooling loads. Therefore, it is important to analyze a comparative study of the effects of various light sources on heating, cooling, and energy consumption of an LED lamp for retrofitting the fluorescent lights in medium scale buildings. This paper proposes a novel analysis technique, integrated energy performance model &
TRNSYS (Transient System Simulation
Tool)-based simulation using thermal analysis program and the optical properties of LED light using the light analysis program. To analyze comparative study of effects on the heating, cooling loads, and energy consumption of an LED lamp application, 2 types of LED lamp with 24W with low efficiency and 7.5W with high
efficiency and a fluorescent lights with 37W are used respectively.
2. Simulation of the indoor light
environment
2.1 Outline of the analysis program 1) Photometrics Pro
Photometrics Pro is a software package for analyzing the luminary performance from a light manufacturer’s photometric web files and is used to calculate the number of lights needed for an interior lighting plan.
2) Lightscape
Lightscape is a rendering software known for its lighting and material effects. In this study, Lightscape was used to analyze day light. Two other light analysis rendering softwares are Superlite and Radiance (LBL, USA), both of which use an algorithm that applies a ray-tracing method. Ray-tracing is relatively accurate for mirror-like specular reflection analysis, but it only works in a view-dependent way, which has the disadvantage of requiring the constant updating of data from different camera positions. However, Lightscape utilizes a progressive refinement radiosity algorithm that produces useful visual results almost immediately upon processing in a view-independent way. Therefore, it is not necessary to re-calculate the global illumination depending on a position change since the radiosity component pre-calculates the diffused energy distribution in an environment and stores the lighting distribution as part of the 3D model. In addition, this program quickly produces an accurate analysis model by using 3-D modeling files generated in AutoCAD.
2.2 Analysis of the indoor lighting environment using light analysis programs
A manufacturer’s photometric web files for luminaries were used in order to determine the expected energy consumption profile when traditional fluorescent lights were replaced with LEDs. The indoor illuminance change and achievement of designed illuminance were evaluated when the 2 LED types were replaced with currently installed fluorescent lights. If the optimal illuminance was not generated by installing LEDs, the numbers of LED and fluorescent lights were calculated using a light analysis program (photometric pro). [20] displays the 3D images of photometric file for fluorescent light and LED lamps, respectively. Table 1 shows specifications of one fluorescent and 2 types of LED lights used for analyzing the integrated energy performance of medium scale building. Two types of LED consist in 24W LED with low efficacy and 7.5W LED with high efficacy.
(1) Calculation of the number of luminaries using a photometric file
Using Photometrics Pro, the rendering program described in section 3.1, the number of luminaires required for optimal illuminance were calculated. For this calculation, the parameters were input from the photometric web, ceiling height, and designed illuminance. When the illuminance of the work plane was maintained at 500lux, 120 fluorescent lights (81.8lm/W), which have a flux of 3050 lumen and use 37.3W of electric power per light, were needed, whereas 426 LED lights, which have a flux of 817 lumen and use 24W of electric power per light and 120 LED lights (102.7lm/W), which have a flux of 770.9 lumen and use 7.5W of electric power per light,
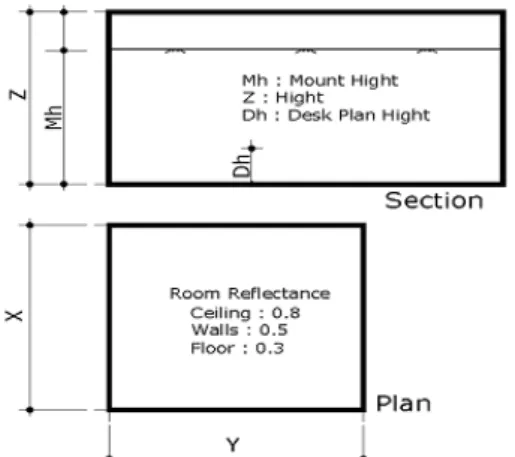
were required. This data suggested that more LED lamps were required to achieve the indoor illuminance than fluorescent lamps, and the lighting power density per unit increased from 5.48W/㎡ to 13.72W/㎡. Figure 3 illustrates the input parameters
of interior for light density calculation of fluorescent light and LED lamps installed in a simulation model. X, Y, Z represent the length, width, and height, respectively. Room reflectance including ceilings, walls and floors have 0.8, 0.5 and 0.3, respectively. Also, Mh, Z and Dh of input parameters represent mount height, height and desk plan height respectively.
(2) Analysis of indoor lighting environment using photometric web files
Using Lightscape (Autodesk, USA), the indoor lighting condition was examined when a calculated number of luminaries were applied to the work plane. Under four different conditions, luminaries were applied to make the interior luminance 480lux : 1) A calculated number of fluorescent lamps were
installed.
Table 1. Specifications of fluorescent and various LED lights
Fluorescent light LED light with low efficiency LED light with high efficiency
Manufacturer Lithonia Lighting, Lithonia
Fluorescent
Eclipse Lighting- 4'LED Luminaire- T5 Railite
Eclipse Lighting- 4'LED Luminaire- T5 Railite
Luminaire General Purpose Channel,
4' 1LP T8 ELEC
With White Interior and Clear Plastic Lens
With White Interior and Clear Plastic Lens
Luminaire Cat C 1 32 TUBI LEDF0012 NICHIA 757D
Lamp 3050 LM LAMP Eighty One LEDs. Lumen
Rating = 818 LMS LED
Lamp Output 1 lamp(s), rated
Lumens/lamp: 3050
1 lamp(s), rated Lumens/ lamp: 817
1 lamp(s), rated Lumens/ lamp: 770.9
Max Candela 558.0 at Horizontal: 22.5, Vertical: 5 389.7 at Horizontal: 0, Vertical: 2.5 222 at Horizontal: 90°0, Vertical: 2.5
Input Wattage 37.3 24.1 7.5
Luminous Opening Rectangle (L: 3.96ft, W: 0.35ft) Rectangle (L: 3.75ft, W: 0.03ft) Rectangle (L:0.55mt, W: 0.12m)
Test L5049 24682 24682
Photometry Type C Type C Type C
CIE Class Semi-Direct Direct Direct
Fig. 1. Input parameters for light design using photometric web files
2) The same number of LED lights with low LPW were installed in place of the fluorescence lights.
3) A re-calculated number of LED lamps with low LPW were installed.
4) The same number of LED lights with high LPW were installed in place of the fluorescence lights. The reflectance and color of the interior wall, ceiling, and floor used in this analysis are displayed in [20].
The colors were displayed in a Munsell color system, the world’s widely used color system, which was created by Aber H. Munsell, a color specialist in the united state of America. In this system, the color is composed of three properties, hue, value and chroma. The color is described in an order of hue and value/chroma (HV/C) and N represents non-chromatic color. The measured color and reflectance were displayed in [20].
With the fluorescent lights installed, the simulation result [20] shows the desk illuminance was maintained at 480 lux . However, when the fluorescent lights were replaced with the same number of LED lights, the work plane illuminance was only 137 lux shown as Fig. 2, lower than that
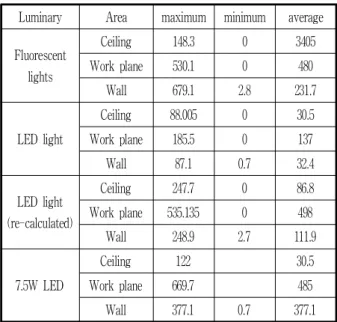
of the fluorescent lights, and could not achieve the level of designed illuminance. Thus, 24 W LED numbers with low efficiency were recalculated to meet 480Lux desk illuminance. Then, the re-calculated number of LED lamps for optimal illuminance were applied and the illuminance of the work plane was measured. The installation of the re-calculated number of LED lamps produced 498 lux of average illuminance, very similar to that generated with the fluorescent lamp installation[20]. As the same method, when the fluorescent lights were replaced with the same number of 7.5W LED lights with high efficiency, the work plane illuminance was only 485 lux shown as Fig. 3. This data indicated that the illuminance distributions on the wall and ceiling were lower than that of the fluorescent light installation, but illuminance distributions on the floor were relatively higher than that of fluorescent lights. This was because LED lamps generate a narrower light distribution and their coefficient of utilization (CU) is higher under an equal light flux when compared to fluorescent lights. Table 3 summarizes simulation results of interior lighting illuminance condition of various
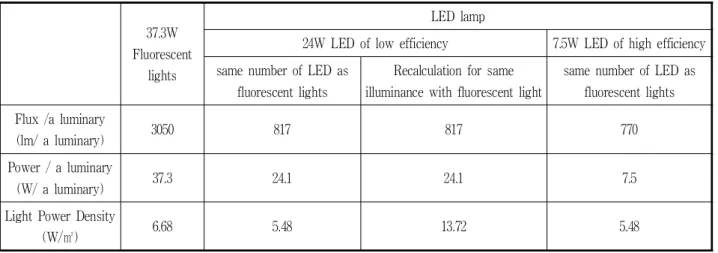
Table 2. Light power density (LPD) of different light sources
37.3W Fluorescent
lights
LED lamp
24W LED of low efficiency 7.5W LED of high efficiency
same number of LED as fluorescent lights
Recalculation for same illuminance with fluorescent light
same number of LED as fluorescent lights Flux /a luminary
(lm/ a luminary) 3050 817 817 770
Power / a luminary
(W/ a luminary) 37.3 24.1 24.1 7.5
Light Power Density
light sources analyzed by Photometrics Pro and Lightscape tool.
Fig. 2. Illuminance distribution of office interior installed with same number of 24W LED
Fig. 3. Illuminance distribution of office interior installed with installed with same number of 7.5W LED
Table 3. Interior lighting illuminance condition of various light sources (Unit : lux)
Luminary Area maximum minimum average
Fluorescent lights Ceiling 148.3 0 3405 Work plane 530.1 0 480 Wall 679.1 2.8 231.7 LED light Ceiling 88.005 0 30.5 Work plane 185.5 0 137 Wall 87.1 0.7 32.4 LED light (re-calculated) Ceiling 247.7 0 86.8 Work plane 535.135 0 498 Wall 248.9 2.7 111.9 7.5W LED Ceiling 122 30.5 Work plane 669.7 485 Wall 377.1 0.7 377.1
3. Analysis of the integrated
energy performance of the
office building
3.1 Characteristics of the dynamic thermal analysis program
For the energy performance analysis, we used the program, ESP-r, which has been popularly used by more than 60 universities and research institutes around the world. This program has been used as the European Reference Building Simulation Program for the performance evaluation of passive solar buildings. The trend in the development of this building energy analysis program has been changed from a separate analysis using individual programs, such as Radiance and Phoenics, into a combination of individual programs in order to analyze the phenomenon of complex energy mechanisms more practically and precisely. The data was analyzed every hour by a thermal equation based on a finite volume and the law of energy conservation in relation to weather conditions, indoor environment conditions, kinds of plants, and control methods.
TRNSYS is a transient systems simulation program with a modular structure for flexible energy analysis. It recognizes a system description language in which the user specifies the components that constitute the system and the manner in which they are connected. Main applications include: solar systems (solar thermal and photovoltaic systems), low energy buildings and HVAC systems, renewable energy systems, cogeneration, and fuel cells.
3.2 Outline of the simulation model 1) Analysis of climate
buildings depends on the thermo-physical properties of building materials and the quality of construction which can be controlled artificially. Besides thermo-physical properties of building materials and the quality of construction quality, the local weather is the most important factor in the energy performance of a building. In this study, standard climate data over 30 years in Seoul area was converted to a TRY(Test Reference Year) format, one of the weather programs.
2) Aspects of the building
A twenty-story office building with 22,257㎡ of total area was utilized as the simulation model in this study. The exterior walls of the building are a curtain wall structure with 46.6% window-to-wall area ratio. Low-e double-pane glass, which has a Solar Heat Gain Coefficient(SHGC) of 50%, was applied to the windows. Depending on the operation of the air conditioning, the building was divided into three parts; service areas (including stairways, elevator halls and restrooms), occupant work areas, and rest areas. The floor plan of a simulation model is composed of exterior zone, interior zone, and core zone and its structure and size are identical from 5th floor to 24th floor. Characteristics of each floor within building is shown as [20]. The fluorescent lamps were installed as basic lights based on the design plan, while internal heat gains from the occupants and electrical appliances were based on standard values in [20] respectively. Overall coefficient of heat transmission U values indicate the heat flow through materials - the higher the figure, the higher the heat loss. While the values vary for each particular material and method of construction, [20] gives general figures for some common modes of construction. Partition wall is defined as a wall provided for the purpose of dividing one room or a portion of a room from
another and internal wall is a boundary wall between core zone and interior zone. A schematic picture for analysis model of a medium office building was represented [20].
3) Aspects of HVAC equipment
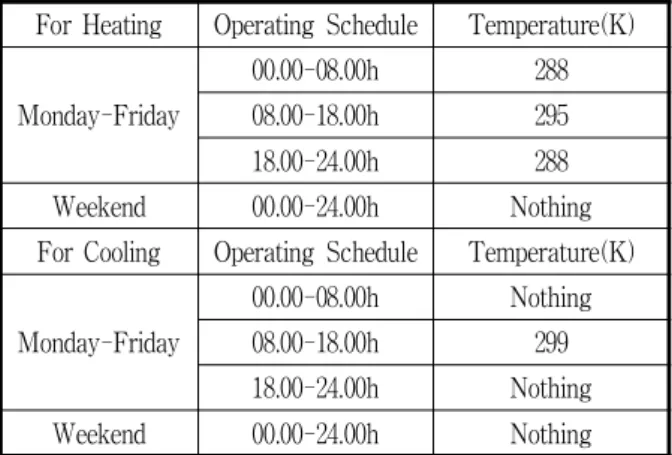
The heating and cooling system installed in the simulation building works in a central system, which heats the air and circulates it through the ductwork. The heating equipment includes a boiler, double-stage absorption chiller, and turbo chiller. Table 4 represented operating schedule of building heating and cooling system and setting temperature.
Table 4. Operating condition and schedule for simulations
For Heating Operating Schedule Temperature(K)
Monday-Friday
00.00-08.00h 288
08.00-18.00h 295
18.00-24.00h 288
Weekend 00.00-24.00h Nothing
For Cooling Operating Schedule Temperature(K)
Monday-Friday
00.00-08.00h Nothing
08.00-18.00h 299
18.00-24.00h Nothing
Weekend 00.00-24.00h Nothing
3.3 Analysis of the integrated
energy performance of medium office building
Lighting is a major internal heat source in the building along with the occupants and electrical appliances. Therefore, the luminaires affect directly not only the heating and cooling energy consumption, but also lighting energy. In general, the office building’s energy is divided into heating and cooling, lighting, electrical appliances, and mechanical energy fluid machines. However, the
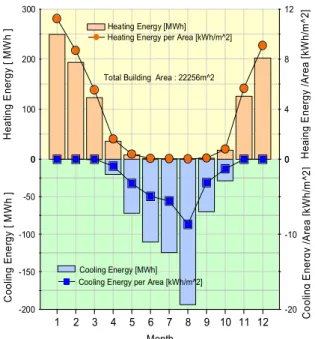
effect of the luminaires on the energy for electrical appliances is minimal. Therefore, in this study, energy performance was evaluated only for heating, cooling, and lighting energy when currently installed fluorescent lamps were replaced with LEDs. The same office building was used as a model as described in section 3.2. Basic lighting for the model building was fluorescent lamps and its specifications were described in table 1 and table 2. The energy consumption for heating, cooling, and lighting was 43.02kWh/㎡yr, 27.94kWh/㎡yr and 16.6kWh/㎡yr in the case of the fluorescent lights, respectively. Fig. 4 displays monthly energy consumption of a simulation model installed with fluorescent lights. When the fluorescent lamps were replaced with the same number of 24W LEDs, the energy consumption for heating, cooling, and lighting was 44.7kWh/㎡yr, 26.3kWh/㎡yr, 13.6kWh/㎡yr, respectively. Low efficiency LED(24W) replacements reduced the energy consumption by 18% and the total energy consumption was 84.6kWh/㎡yr which is 3.4% lower than that with fluorescent lamps installed[20]. The installation of the same number of LED lamps as fluorescent lamps could not meet the required indoor illuminance level. Thus, when the number of LEDs increased, energy consumption for heating, cooling, and lighting was 33.84kWh/㎡yr, 38.42kWh/㎡yr, and 34kWh/㎡yr, respectively. Lighting and cooling energy increased more than 200% and 37.2% respectively, but heating energy reduced about
21.3%, resulting in a total energy consumption increase of 21.4% when compared to the fluorescent installation. The simulation results of integrated energy performance depending on the type of luminaries. Here, fluorescent stands for fluorescence lamps, LED also LED lamps with low efficiency equal to the number of fluorescent lamps, finally LED-C represents the number of LED lamps installed when corrected for optimal interior illuminance for the same illuminance in case of FL was represented in [20]. The installation of the same number of 7.5W LED lamps with high efficiency as fluorescent lamps could meet the required indoor illuminance level. Energy consumption for heating, cooling, and lighting was 45kWh/㎡yr, 26.5kWh/㎡ yr, and 13.3kWh/㎡yr, respectively. Lighting and cooling energy decreased more than 20% and 5.2% respectively, but heating energy increased about 4.6%, resulting in a total energy consumption decrease of 3.2% when compared to the fluorescent installation. Fig. 4 displays monthly energy consumption of a simulation model installed with fluorescent lights in this study. Fig. 5 represents simulation results of the heating and cooling energy depending on the type of light source in simulation model. Simulation results of integrated energy performance depending on the type of luminaries are shown as Fig. 6. In this figure, LED lamps with high efficiency are equal to the number of fluorescent lamps. Table 5 summarizes the
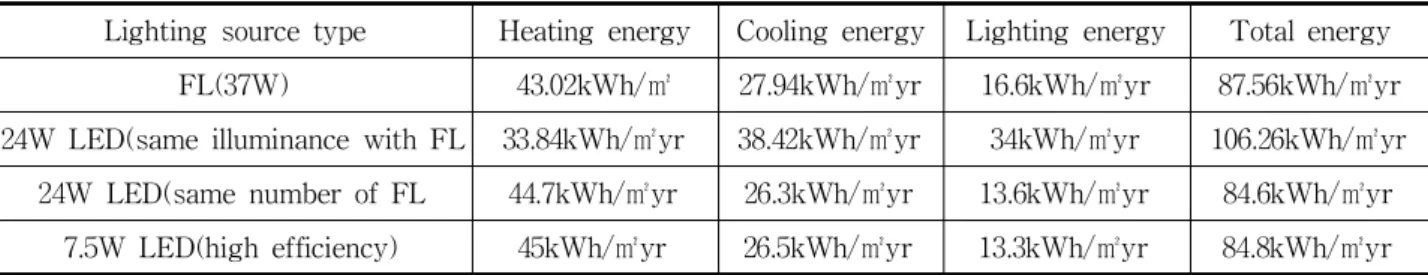
Table 5. Comparison of lighting, cooling and heating consumption according to various light sources
Lighting source type Heating energy Cooling energy Lighting energy Total energy
FL(37W) 43.02kWh/㎡ 27.94kWh/㎡yr 16.6kWh/㎡yr 87.56kWh/㎡yr
24W LED(same illuminance with FL 33.84kWh/㎡yr 38.42kWh/㎡yr 34kWh/㎡yr 106.26kWh/㎡yr
24W LED(same number of FL 44.7kWh/㎡yr 26.3kWh/㎡yr 13.6kWh/㎡yr 84.6kWh/㎡yr
comparative simulation results of lighting, cooling and heating loads according to various light sources.
4. Conclusions
The building stock in the world consumes approximately 40% of the energy and emits one third of the total greenhouse gases emissions. Office buildings are one of the highest levels of energy consumption buildings compared with energy consumption in other building sectors. The total annual energy consumption in office buildings varies in the range 100 - 1,000kWh per square meter per year, depending on the geographic location, operational schedules, use of HVAC systems, use and type of office equipment, type of lighting equipment, energy policy in each office, etc. Improving the energy efficiency in buildings is vital to address the climate change and achieve energy independence. Nowadays, the most electricity-saving and energy lighting products is LED lamp. Through the LED have higher price than other light sources, LED lamp is the most cost-effective luminary due to high -200 -150 -100 -50 0 C oo lin g E ne rg y [M W h ] -20 -10 0 C o ol in g E ne rg y /A re a [k W h/ m ^2 ] 1 2 3 4 5 6 7 8 9 10 11 12 Month 0 100 200 300 H ea tin g E ne rg y [M W h ] 0 4 8 12 H ea in g E ne rg y /A re a [k W h/ m ^2 ] Heating Energy [MWh] Cooling Energy [MWh]
Heating Energy per Area [kWh/m^2]
Cooling Energy per Area [kWh/m^2] Total Building Area : 22256m^2
Fig. 4. Monthly heating and cooling energy of FL
Fig. 5. Change of heating and cooling energy consumption depending on type of luminaries(high efficiency LED and FL)
Fig. 6. Simulation results of integrated energy performance depending on the type of luminaries LED lamps with high efficiency (equal to the number of fluorescent lamps)
LPW and long life span [21]. A novel integrated building energy consumption including indoor lighting environment has been studied from building energy and indoor light environment analysis tool which is verified many advanced nations. The following is a summary of the simulation results of this study.
1) Due to LED technology development, its effect of energy saving and long life span, The LPW of a commercial LED is about 80-120lm/W. The LPW of a commercial LED is about 100lm/W, which is equal and more than LPW of a fluorescent lamp nowadays.
2) The analysis of the interior lighting environment with an LED photometric web file revealed that the illuminance is high for the work plane, but not for the wall and ceiling, indicating that the internal light distribution is not a little identical since LEDs have a narrow light distribution and a high coefficient of utilization.
3) Although the energy consumption of LED lamps is 20% - 30% lower than fluorescent lamps, more LED lamps were required to create the standard interior illuminance levels due to their smaller light flux, leading to an increase in lighting power density in 2-3 year ago. In this paper, the high LPW of LED(7.5W) with the same number of FL shows an effective energy saving and cost- effective luminary from energy performance analysis using TRNSYS and others.
4) Integrated building energy consumption decreased up to 3.2% when fluorescent lamps were replaced with LEDs. This was due to the increase of internal heat gains since many LED lights were needed to light the space appropriately. However, heating energy consumption was reduced due to the decrease
of internal heat gains as well. This suggests that LED installation with high LPW is not appropriate for buildings which consume more heating energy than cooling energy. This result is different from generally increasing cooling energy consumption obtained in [20].
5) Although LEDs have advantages over fluorescent lights such as a longer life span and being pollution free, their light flux needs to be maintained over 90lm/㎡ in order to replace fluorescent lamps. Furthermore, more detailed information about LED products such as a photometric web file is required, and integrated energy performance needs to be analyzed to focus on energy saving techniques for heating and cooling as well as lighting. In the future, studies on the thermal comfort of occupants, improved model of high heat emission of LED package, and the photometric distribution of LEDs will be performed.
Acknowledgements
The authors would like to gratefully acknow-ledge the financial support of KETEP (Korea Institute of Energy Technology Evaluation and Planning) under project 2013T100200078
References
[1] Pandharipande A. Daylight integrated illumination control of LED systems based on enhanced presence sensing. Energy & Buildings 43, pp. 44-55, 2011.
[2] Byung-Lip Ahn, et al., “Effect of LED lighting on the cooling and heating loads in office buildings”, Applied Energy 113, pp.1484-1489, 2014.
[3] Guide F. Energy efficiency in buildings. Chartered Institute of Building Services Engineers; 1999.
[4] Jenkins D. An approach for estimating the carbon emissions associated with office lighting with a daylight contribution. Appl Energy 84, pp. 608-22. 2007.
[5] Khan N, “Comparative study of energy saving light sources”. Renew Sustain Energy Rev 15 pp.296-309, 2011. [6] Dubois MC. Energy saving potential and strategies for
electric lighting in future North European, low energy office buildings: a literature review. Energy and Build 43, pp.2572-82, 2011
[7] Santamouris M, Argiriou A, Dascalaki E, Balaras C, Gaglia A. Energy characteristics and savings potential in office buildings. Sol Energy 52, pp. 59-66, 1994.
[8] Peng C, Wang L, Zhang X .,”DeST-based dynamic simulation and energy efficiency retrofit analysis of commercial buildings in the hot summer/cold winter zone of China: a case in Nanjing”, Energy & Build 78, pp.123-31, 2014. http: //dx.doi.org/10.1016/j.enbuild.2014. 04.023.
[9] Pandharipande A, “Daylight integrated illumination control of LED systems based on enhanced presence sensing”, Energy Build 43, pp.944-55, 2011.
[10] Ministry of Knowledge Economy of Korea, “Regulation of Public Institution Energy Retrofit Act”, pp. 1-4, 2012. [11] “Energy Savings Forecast of Solid-State Lighting in
General Illumination Applications”, [online], Available : http://energy.gov/eere/ssl/led-lighting-forecast.
[12] DOE SSL Program, “Energy Savings Forecast of Solid-State Lighting in General Illumination Applications,” August 2014. [Online]. Available: http://apps1.eere.energy. gov/buildings/publications/pdfs/ssl/energysavingsforecast14. pdf.
[13] LEDs are the lights of the 21st century. [Online]. Available: http://lumenistics.com/leds-are-the-lights-of-the -21st-century/
[14] The Japan Research and Development Center of Metals. Light for the 21st Century, 2002.
[15] Ministry of Economy, Trade and Industry, Japan. Strategic Energy Plan of Japan, 2010-2014.
[16] EU Commission Directorate-General JRC Joint Research Center, “Background for the EUROPEAN LED QUALITY CHARTER”, February, 2010.
[17] Energy Efficiency & Renewable Energy, “Solid-State Lighting R&D Plan” May 2015.
[18] Bing LY, “On thermal structure optimization of a power LED lighting”, Proc Eng 2012;29:2765-9.
[19] U.S. Department Of Energy, Energy Efficiency and Renewable Energy, “Thermal Management of White LEDs”, 2007.
[20] Byoung-Soo Kim-Won-Pyo Hong, “Interior Light Environment and Building Energy Performance Analysis of LED Lamp Installed in Office Building”, Journal of the Korean Institute of Illuminating and Electrical Installation Engineers, Vol. 24, No. 5, pp. 77~85, 2010.
[21] Narun Luewarasirikul, “A Study of Electrical Energy Saving in Office”, Procedia - Social and Behavioral Sciences 197, pp. 1203 - 1208, 2015.
[22] Kim Byoung Soo, Kim Jung Sin, Yim Oh Yon, “Optimal Windows Transmittance by Energy Performance Analysis and Subjective Evaluation in office building” Journal of the Korean Solar Energy Society Vol.24, No.3, September 2004.
◇ 저자소개 ◇────────────
Won-Pyo, Hong
Won-Pyo Hong was born in Daejeon city in the Republic of Korea on May 15, 1956. He received a B.S. degree in Electrical Engineering from Sungsil University, Seoul, Korea, in 1978 and M.Sc. and Ph.D. degrees in Electrical Engineering from Seoul National University, Seoul, Korea, in 1980 and 1989, respectively. From 1980 to 1993, he was senior researcher of the Korea Electric Power Research Institute at the Korea Electric Power Cooperation. He was visiting professor at the UBC, Canada, from 2007 to 2008. He is a professor in the Department of Building & Plant Engineering of Hanbat National University, where he has taught since 1993. His main research interests are green energy and building management systems, smart green buildings, field bus-based control and distributed energy resources.