유정에서 선체까지 선박의 액화천연가스 및 해양 연료의 비교 수명주기
평가
임옥택1†⋅윤상진2
1
울산대학교 기계공학부, 2남부대학교 자동차기계공학과
Comparative Life Cycle Assessment of Liquefied Natural Gas and Marine
Fuel for Ship from Well to Hull
OCKTAECK LIM1†, SANGJIN YOON2
1School of Mechanical Engineering, University of Ulsan, 93 Daehak-ro, Nam-gu, Ulsan 44610, Korea
2School of Mechanical Automotive Engineering, Nambu University, 1 Nambudae-gil, Gwangsan-gu, Gwangju 62271, Korea
†Corresponding author :
Received 19 January, 2021
Revised 20 March, 2021
Accepted 21 April, 2021
Abstract >> In this study, well to hull was obtained by life cycle assessment (LCA) and the greenhouse gases, regulated emissions, and energy use in trans-portation model (GREET), which is developed by Argonne National Laboratory to evaluate the environmental impact of marine liquified natural gas (LNG) and rine fuel. This study compared the environmental impact of marine LNG and ma-rine fuels, which were caused by green house gases (GHG) emissions and energy consumption. The effect resulted from well to pump (WTP) process and pump to hull (PTH). Natural gas has the potential to generate more greenhouse gases than liquid fuels due to the amounts of leaks of the gas that were sent out the air during production and processing. Nevertheless, the results showed that the greenhouse gases produced during transportation were enough to reduce the disadvantages of PTH process. The research expects that the results will be in accordance with the environmental policy of South Korea.
Key words : Liquified natural gas(액화천연가스, LNG), GREET(에너지⋅교통 분야 환경
영향성 평가 모델), Well to hull(선체 적정성), Life cycle assessment(전 과 정 평가, LCA), Marine fuel(해양 연료), Greenhouse gas(온실가스)
Nomenclature
LCA : life cycle assessment GHG : green house gases
LNG : liquified natural gas WTP : well to pump PTH : pump to hull
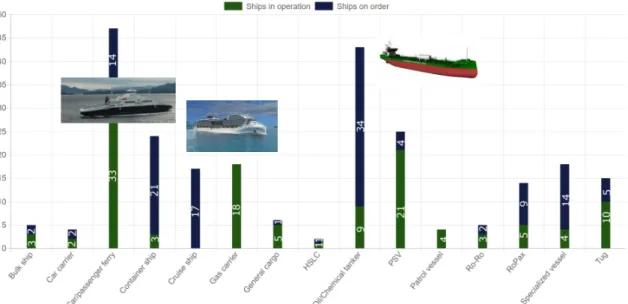
Fig. 1. Order status of ships using LNG as fuel
HEFA : hydro processed esters and fatty acids IMO : international maritime organization GREET: the greenhouse gases, regulated emissions, and energy use in transportation model
1. Introduction
Since January 2020, the International Maritime Organization (IMO) will strengthen a regulation to enforce the content of sulfur compounds in ship en-gine exhaust gas from 3.5% to 0.5%. In response, us-ing LNG as a fuel of transportation has emerged. To respond to IMO’s environmental regulations, ship-builders in each country are ordering eco-friendly ships in consideration of new ship construction. The order status of ships using LNG as fuel is shown in Fig. 1. LNG-fueled ships are rapidly being applied and dis-tributed in Northern Europe1). Since the first pas-senger ship ‘Glutra’ was built in Norway for the first time in 2000, NASSCO has recently ordered 3,400 TEU container ships.
The current market is still hesitant to introduce LNG-fueled vessels. However, if LNG-fueled vessels are ordered in earnest, the size of the market is not expected. However, the biggest obstacle to ordering LNG fueled vessels is the lack of infrastructure for fueling vessels2). Even though the disadvantages, The Korea Government plans to introduce the LNG industry. Life Cycle Assessment for vehicles is stud-ied in South Korea3). There is little research on ship emissions. Especially, emissions from return gas, boil-off-gas are hard to evaluate.
In this study, we evaluated the environmental im-pact of the whole process for well-to-hull. It analyzes and evaluates the environmental problems arising from each process of the product through evaluation, including the production and transportation of fuel used for ships as well as operation and compared fos-sil fuels with NG. Therefore, it is necessary to com-pare and analyze the well to pump (WTP) process us-ing The greenhouse gases, regulated emissions, and energy use in transportation model (GREET). Generally,
Fig. 2. Process of life cycle assessment
NG occurs greenhouse gas in the WTP than diesel due to the amounts of leakage generated during the production and treatment process.
Nevertheless, the greenhouse gases produced dur-ing transportation are expected to be good enough to reduce the shortcomings because of the pump to hull (PTH) process. A more detailed comparison of the operation part is needed through WTP analysis using GREET. The PTH result is obtained from the emis-sion information in operating. There are many limi-tations to conducting experiments using large marine engines. Therefore, the PTH is calculated from an en-gine specification which is operated in ships (Ilshin Shipping and Incheon Port Authority).
2. Methods
2.1 Life cycle analysis (LCA)
LCA provides analysis of the environmental pros-pect and potential environmental impacts throughout life cycle of a product from raw material acquisition through production, use, end-of-life treatment, re-cycling and final disposal. LCA is developed and uti-lized by many companies, and research institutes around the world in the 1970s in order to compare and analyze the environmental friendliness of products. The process in LCA is described in Fig. 2. It is pos-sible to analyze and evaluate the environmental prob-lems caused by the process of the product, and it is possible to perform a comparative analysis of the products.
2.2. GREET
GREET developed by Argonne under the auspices of the US Department of Energy (Energy Efficiency and Renewable Energy)4). It is a program that enables LCA of energy usage and emissions which occur dur-ing production and transportation of fuel as well as the driving of the vehicle. Also, it can accumulate da-ta on a wide range of dada-ta, including moving parts in the picking and transportation production of raw materials. It is calculated based on actual measure-ment results rather than simulation results. In addition to gasoline and diesel, there is data on full-range fuels used in transportation such as NG, electricity, and bio-oil. Not only energy consumption but also exhaust gas and greenhouse gas emissions are inves-tigated, and it is very useful for comparative analysis in accordance with the purpose of LCA. GREET in-cludes more than 100 fuel routes, including petro-leum and NG fuels, as well as biofuels, hydrogen, and electricity from a variety of energy sources. It is easy to compare and analyze the effects of each stage in the calculation by dividing the process from fuel production to supply. It provides the sources, usage from, contents of the data used in the GREET devel-opment process in the public domain.
2.3 LCA method
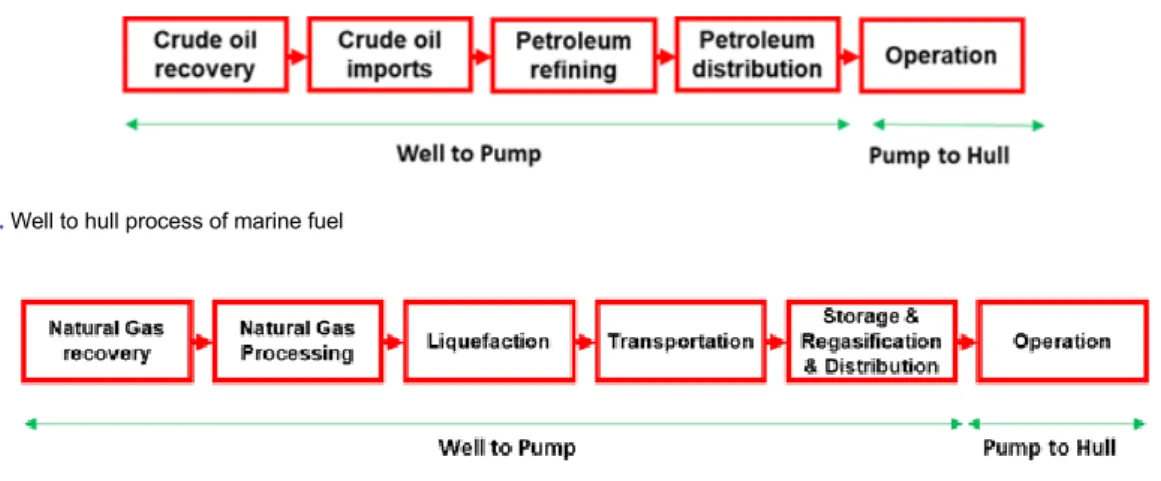
Well-to-Hull processes of marine fuel and LNG are described in Figs. 3, 4. To evaluate the environ-mental impact of diesel compared to NG, we use GREET to compare the following WTP processes5).
Fig. 3. Well to hull process of marine fuel
Fig. 4. Well to hull process of LNG
In the case of NG, it is expected that more green-house gases will be generated than diesel due to the amounts of leaks generated during production and processing. However, compared to diesel, the amount of traffic generated during transport is expected to be good enough to reduce the above disadvantages. In order to compare and analyze this, we want to com-pare and analyze the operation part using GREET and WTP analysis, PTH data.
In the case of the WTP process, it is difficult to obtain reliable data, and there is a lack of extensive data on each process. In order to solve this problem, we would like to compare and analyze the results us-ing the followus-ing GREET results.
2.4 WTP 2.4.1. Marine fuel
The use of LNG as a common marine fuel is like-ly to increase as a bunkering infrastructure develops and it becomes a recognised and viable alternative to traditional marine fuels, driven mainly by the need to comply with the forthcoming IMO global sulphur regulation in 2020.
GREET shows five things related to the WTP process of Marine fuels. The values are 1)
petro-leum-based marine fuels from crude oil, 2) fish-er-tropsch diesel fuel from NG, coal and cellulosic biomass, 3) hydro processed esters and fatty acids (HEFA) or hydro processed renewable diesel (HRD) diesel fuel from bio-oil found in soybeans, palm, ra-peseed, jatropha, camelina, and algae, 4) renewable diesel from pyrolysis of cellulosic biomass, and 5) bi-odiesel or fatty acid methyl esters (FAMEs) from bio-oil found in soybeans, palm, rapeseed, jatropha, camelina and algae. Among them, crude oil based marine fuels is chosen. The average distance from oil importing country to the Korean refinery is 12,135 km based on Korea National Oil Corporation’s data, using Voyage calculator. According to the Korea National Oil Corporation, most volume of crude oil is imported from overseas. 76% of total crude oil im-ports are from the Middle East (Saudi Arabia, Kuwait, Iraq, Qatar, etc.) in 2018. Domestic data on crude oil import, preparation and distribution for the diesel LCA were provided by the Korea Petroleum Association.
2.4.2. LNG
The data of LNG required for WTP analysis are as follows. We consider the energy efficiency of raw material extraction and processing and the ratio of
Country Distance (km) Import volume (ton) Qatar 11,297 14,250,000 Australia 6,667 7,870,000 Oman 10,556 4,280,000 The U.S. 10,556 4,660,000 Malaysia 4,598 3,700,000
Table 1. Import distance to South Korea of natural gas (2018)
Parameter Residual oil Marine distillate Low suffer marine distillate Energy use (kJ/MJ) 152.1 202.8 202.8 GHG emissions (g/MJ) 13.74 16.77 16.78
Table 2. Well to pump results in marine fuel
Fig. 5. Marine fuel WTP energy usage results (kJ/MJ) Fig. 7. Marine fuel WTH GHG emissions results (g/MJ)
Fig. 6. Marine fuel WTP GHG emissions results (g/MJ)
process fuel in NG production in the NG recovery and NG processing steps. Korea Gas Corporation pro-vides information about NG import. From the in-formation, we calculate the import distance to consid-er the transportation step6). The information describes in Table 1. In the case of storage, regasification, and distribution step after importing LNG, the data was used in GREET because there was not enough data accumulated.
2.5 PTH
Although, it is necessary to find and compare
die-sel ships of similar specifications as LNG vesdie-sels, it is difficult to obtain information on the number of days of sailing, sailing distance, ship weight (including load weight), fuel consumption and electricity con-sumption for a certain period required for calculation. There are three types of marine fueled vessels which are bulk carriers, oil tankers, and container ships. At the time, GREET only provided specifications of these ships. We average the total energy use and green-house gases to calculate data in the operation step. The information related to ships using LNG as fuel is not explained. Therefore, we get data from a com-pany that operates LNG ships in South Korea.
3. Results
In the case of marine fuel, the WTP result of en-ergy use and greenhouse gas emissions are in Table 2.
In the pump to hull pathway, the GHG emissions are only calculated from the specification of HYUNDAI MAN B & W TYPE: 6G50ME-GI used in Ilshin Shipping LNG propulsion vessel because of the com-pany’s secret. The GHG emissions result is 74.4 g/MJ in diesel mode.
Include processes of extraction, production proc-essing, and storage before importing LNG to Korea. Since NG also uses GREET, it is necessary to ana-lyze additional information by importing the country later. Based on GREET, energy use: 59,287 kJ/GJ. GHGs emission results: 12,606 gCO2/GJ. In the NG processing step, energy use is 4,510 kJ/GJ, and GHGs emission result is 34,741 gCO2/GJ. In the trans-portation step, GREET only provides a specification of oil tankers which transport crude oil, so we use the same value as well. LNG carriers are expected to generate fewer emissions than diesel ships because it generates electricity and heat using vented gases. The results are 19,646 kJ/GJ and 1,643.8 gCO2/GJ. In the storage, re-gasification, and distribution step, the data is not accumulated enough to evaluate, so we use the value in GREET. The values are 15,478 kJ/GJ and 1,904 gCO2/GJ.
For LNG, the WTP result of energy use is 194.8 kJ/MJ, and GHG emissions is 19.75 g/MJ. In the pump to hull step, the GHG emissions result is 56.5 g/MJ in gas mode.
In Figs. 5-7, all the results of WTP are organized to be comprehensive. In the case of WTP, LNG has higher energy consumption and GHGs emissions due to the addition of processes such as compressed gas and re-liquefaction, as well as the amount of gas dis-charged during production compared to marine fuels such as residual oil and marine distillate. Energy con-sumption data in PTH can’t have been obtained from Ilshin. However, it is considered that the energy con-sumption of LNG is higher because of use to
boil-off-gas reliquefaction For PTH, GHGs emissions from operations are far above the WTP process.
4. Conclusions
The research was carried out to investigate the en-vironmental impacts of LNG as fuel, comparing Marine fuels. LCA analysis shows that NG produces more GHGs in WTP compared to liquid fuel for ships, but fewer in PTH. In the case of PTH, the en-ergy consumption and GHG emissions in operation far exceed the WTP process due to the nature of ships that must cross the Pacific. Therefore, LNG, which emits less GHGs than diesel, is thought to be much better than diesel in terms of the environment but may differ from actual operating conditions, so engine experiments and additional data are needed to confirm in the future.
In South Korea, both NG and marine fuels depend on imports, so GHG emissions from WTP are rela-tively low. In order to satisfy the IMO regulations, the exhaust gas generated during ship operation (PTH) should be managed in a focused manner. Therefore, the amount of exhaust gas generated dur-ing operation is less than that of marine fuel, so it is considered to suitable for satisfying environmental regulations. However, more detailed comparisons are needed between engine efficiency and operating costs (price, storage costs, safety management costs, etc.) compared to diesel. Nevertheless, the emissions from WTP in LNG, which is higher than marine fuels, couldn’t ignore.
Acknowledgment
This research was financially supported by the EU Cooperation Promotion Project of National Research Foundation (NRF-2019K1A3A1A7911296711,
Technology for improvement energy efficiency and environmental footprint of inland waterway vessels).
References
1. Ministry of Land, Infrastructure, Transport, and Tourism of Japan, “Operation guidelines for truck to ship LNG transfer”, 2015. Retrieved from https://www.mlit.go.jp/
common/001173461.pdf.
2. Heywood JB, “Internal combustion engine fundamentals”, McGraw-Hill, USA, 1988.
3. Choi W and Song HH, “Well to wheel analysis on green-house gas emission and energy use with natural gas in Korea”, Int. J. Life Cycle Assess. Vol, 19, 2014, pp. 850-860,
doi: https://doi.org/10.1007/s11367-014-0704-7. 4. Argonne National Laboratory, “GREET® model: the
green-house gases, regulated emissions, and energy use in tech-nologies model”, U.S. Department of Energy Office of Science, 2018. Retrieved from https://greet.es.anl.gov/. 5. Jwa K and Lim O. “Compartive life cycle assessment of
lith-ium-ion battery electric bus and Diesel bus from well to wheel”, Energy Procedia, Vol. 145, 2018, pp. 223-227, doi:
https://doi.org/10.1016/j.egypro.2018.04.039.
6. National Energy Technology Laboratory, “Development of baseline data and analysis of life cycle greenhouse gas emissions of petroleum-based fuels”, 2008. Retrieved from
https://collections.lib.utah.edu/details?id=214745&page=