The Effects of Technological Capabilities and
Entrepreneurship on Technological Innovation of
Technology-based Start-ups in Korea
Seungku Ahn
*, Juil Kim
**, Kwang-Hoon Lee
***Abstract This paper analyses how technological capabilities and entrepreneurship of technology-based start-ups affect their performance. In this paper, a multiple regression analysis was conducted on 248 technology-based start-ups. The effects of indicators of technological capacity like R&D intensity, R&D organization, technology competitiveness, patents, and certification were analyzed. Factors affecting sales were R&D intensity and technological competitiveness. Technology competitiveness and patents were the significant factors influencing product competitiveness. The factor that positively influenced organizational performance, customer performance, and achievement of start-up goals was technological competitiveness. The results of such an analysis should be designed to discover and foster long-term innovation potential, rather than relying on short-term financial performance.
Keywords Technology-based start-ups; Technology competence; Start-up support; Firm performance, Technological innovation
I. Introduction
Korea’s economic growth rate is falling every year, and the rate of potential growth is expected to be the fastest among OECD countries (IMF, 2019). Since the low growth trend is expected to continue, start-ups attract attention as a source of new wealth and employment. This is because start-ups create new business models by affecting the structure of existing industries, resulting in the diversification of products and services and lower prices.
Submitted, March 13, 2021; 1st Revised, April 25, 2021; Accepted, April 28, 2021
* Senior Research Fellow & Director General, Office of Planning and Management, Korea Institute of S&T Evaluation and Planning, Seoul, Korea; [email protected]
** Administrative Staff, Korea Institute of S&T Evaluation and Planning, Seoul, Korea; [email protected]
*** Corresponding Author, Associate Professor, Department of Public Administration & Department of Integrated Energy and Infra System, Kangwon National University, Chun-Cheon, Korea; [email protected]
91
Technology-based start-ups produce high added value even during short business periods. They are highly likely to grow into high growth companies because of their high technology. Above all, even if a start-up has a lot of excellent technology, the ability to enable successful commercialization becomes more important.
As interest in technology start-ups has recently increased, and the government’s efforts to revitalize it are continuously strengthening, it is necessary to examine whether the government’s start-up support projects are affecting the performance of companies. The government’s fiscal investment to revitalize entrepreneurship is an inevitable measure to compensate for market failure. Like other economic sector investments, financial resources are limited; thus, the appropriate level must be maintained where necessary.
Thus, this study aims to examine the factors and required capabilities of technology-based start-ups by empirically analyzing their capabilities and management performance. In particular, this study attempts to analyze the overall relationship of the factors related to the performance of technology-based start-ups by analyzing the effects of technology capability and the moderating effects of industry. This analysis is expected to suggest important implications for the government’s policy direction on start-up support.
II. Literature review and hypothesis development
Start-up is the first stage in a firm’s life cycle, meaning that an entrepreneur starts a business for profit. This includes the steps from the actual start-up stage to its own self-sustaining power (Low and MacMillan, 1988). Technology-based start-ups can be categorized as enterprises with the business performance of seven years or less that correspond to the manufacturing and knowledge service industries(The Small and Medium Business Administration & Business Development Agency, 2016). This paper examines a technology-based start-up that creates new markets based on innovative technology among many types of business start-ups (Korea Business Incubation Association, 2015).
Technology competence is the basis for creating a sustainable competitive advantage as a capability to absorb and utilize external technical knowledge or to create new knowledge based on existing knowledge within the organization (Tushman and Anderson, 1986; Henderson and Clark, 1990; Bettis and Hitt, 1995; Lee et al., 2001). Technology start-ups, in particular, depend on technology because their success depends on their skills (Chandler and Hanks, 1994; Shrader and Simon, 1997). Rothwell and Zegveld (1982) explained that the flexibility of small firms, concentration in specific sectors, and active
92
internal communication have advantages over large firms in terms of increasing and leveraging technology capabilities.
Technology competence is generally difficult to imitate and replace from competitors because it exists in the form of patents or legal and institutional guarantees or intangible assets such as tacit inherent within the organization (Hamel and Prahalad, 1994; Kogut and Zander, 1995). Therefore, building technological competency is to lay the foundation for long-term competitive advantage for technology start-ups with scarce financial resources.
In this study, R&D intensity (Deeds, 2001; Deeds et al., 1998; Hall and Bagchi-Sen, 2002; Madanmohan et al., 2004), R&D organization (Kim, 1999), and technological competitiveness (Kwun and Jeong, 2012), patent (Archibugi and Pianta, 1996; Tsai, 2004; Coombs and Bierly, 2006), and whether or not they hold certification (Kim, 2014) were analyzed.
R&D intensity is a measure of R&D investment compared to sales. It represents the degree of commitment to technological innovation compared to the size of the company. R&D intensity is an indicator of how active an organization is in creating knowledge and the influx of external knowledge (Cohen and Levinthal, 1990) which has been found to be closely linked to the financial performance of a company (Deeds et al., 1998; Deeds, 2001). Schoenecker and Swanson (2002) suggested R&D intensity, patents, and new product launches as technical competencies. Their effects varied across different industries, but R&D intensity was analyzed as the most positive factor.
The R&D organization shows how the organization manages innovation activities. In general, most firms neither initially set up separate laboratories nor systematically operate R&D and management personnel. As the company grows, R&D personnel and departments are created; and after the growth period, a separate research institute is established to perform more specialized research. Firms with established R&D organizations reflect their top management’s commitment to technological innovation, and they produce better results in terms of sales and profits than those that do not (Reichert and Zawislak, 2014).
Technological competitiveness refers to a subjective judgment on the level of competitiveness of the company's technological capabilities compared to other companies. Technology capability can generally be measured objectively and subjectively and can be divided into proprietary and knowledge-based resources (Miller and Shamie, 1996). However, technological competitiveness refers to the competitiveness of knowledge-based resources measured subjectively. Kwun and Jeong (2012) argued that subjective evaluation indexes were needed because subjective technological competitiveness had more impact on corporate performance than objective technological capability.
Unlike technological competitiveness, patents can be measured objectively and are the most commonly used variables. Apart from the number of patents, the utilization and application of patents (Hall and Bagchi-Sen, 2002), the
93
influence of patents, and the life cycle of technology (Coombs and Bierly, 2006) are considered as technical capabilities related to patents. Lee et al. (2001) considered the number and quality of patents together as technical capabilities. They confirmed that the technology competencies of technology start-ups have a positive impact on their performance. Acha (2000) also confirmed that the technology capacity measured by patents has a positive effect on corporate performance.
Considering Korea’s special policy context, the government’s certification was considered as an element of technology capability. The certification system for Korean venture firms started in 1997, and in 2001, InnoBiz was introduced. Based on the ‘Comprehensive Measures for Strengthening Competitiveness of SMEs’ established in 2004, the Management Innovation SME Certification System was introduced in 2006. SMEs certified as innovative SMEs can benefit from applying for government-sponsored programs under the SME Technology Innovation Promotion Act and avail tax and financial benefits. In addition, the one-man creative company was first supported in 2009 and became legally based on the 2011 Act on the Promotion of One-man Creative Enterprises. Kim (2014) suggested the importance of differentiated innovation support policy according to government certification.
Based on the research results surveyed above, the following hypotheses regarding the relationship between technological capability and start-up performance were established.
H1. The R&D intensity of technology-based start-ups significantly impacts firm performance.
H2. The R&D organization of technology-based start-ups significantly impacts firm performance.
H3. The technological competitiveness of technology-based start-ups significantly impacts firm performance.
H4. The patents of technology-based start-ups significantly impact firm performance.
H5. The government certification of technology-based start-ups significantly impacts start-up performance.
A firm’s performance is influenced by various factors. Thus, technology-based start-ups in manufacturing and knowledge service industries have different value chains in the development, production, and delivery of products and services. Therefore, we hypothesized that firm performance would be affected by the different characteristics of entrepreneurs of manufacturing firms and knowledge service companies.
94
H7. The effect of R&D organization on the firm performance varies across industries.
H8. The effect of technological competitiveness on firm performance varies across industries.
H9. The effect of patents on firm performance varies across industries. H10. The effect of government certification on firm performance varies across
industries.
3. Research method
3.1 Research model and variables
The hypothesis in the research model of this study can be articulated by the following equation:
Y(𝑃)𝑖 = 𝛽0+ 𝛽1(RDI)𝑖+ 𝛽2(RDO)𝑖+ 𝛽3(TC)𝑖+ 𝛽4(IP)𝑖+ 𝛽5(GC)𝑖+
𝛽6(FA)𝑖+ 𝛽7(FS)𝑖+ 𝜖𝑖 (i=1~248)
𝐻𝑗) 𝐻0: 𝛽𝑗= 0 𝐻1: 𝛽𝑗≠ 0 ( 𝑗 = 1~7)
Here, P: performance, RDI: R&D intensity, RDO: R&D organization, TC: technological competitiveness, IP: patent, GC: government certification, FA: firm age, FS: firm size.
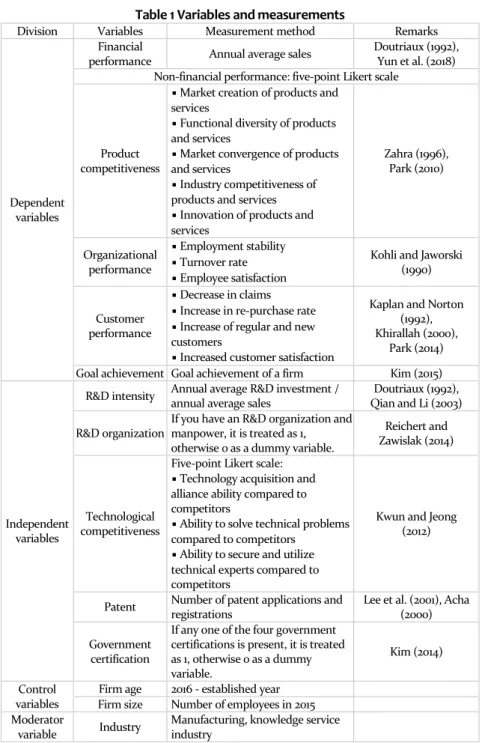
The firm performance as a dependent variable is measured by the financial and non-financial performance because the various performance indicators should be considered in a comprehensive manner (Romanelli, 1989; Steams et al., 1995; Phillips, 1996; Helms et al., 1997). The previous research agrees that using both measurements can alleviate the limitations of each subjective and objective nature of performance measurement (Cooper, 1971; Robinson and Pearce, 1986).
This study objectively measured financial performance constructs by using annual average sales (Shin, 2011; Doutriaux, 1992). A firm’s financial status of the three-year period from 2013 to 2015 was surveyed. Non-financial performance constructs were also measured by product competitiveness, organizational performance, customer performance, and goal achievement. The study used a five-point Likert-scale subjective measurement method for non-financial performance. The product competitiveness was measured by five questions with respect to the status and performance of products and services in the market (Zahra, 1996; Park, 2010). To capture the working environment and overall stability of a firm, the organizational performance was measured by three questions concerning employment stability, turnover rate, and employee satisfaction (Kohli and Jaworski, 1990). Customer performance was measured
95
by four questions about the increase of customers, a decrease of claims, and an increase in satisfaction (Park, 2014; Kaplan and Norton, 1996; Khirallah, 2000). To measure goal achievement, how much of the company’s goals or vision it had achieved was asked (Kim, 2015).
Regarding independent variables to measure technical competence, this study examined R&D intensity, R&D organization, technological competitiveness, patent, and government certification.
R&D organization is a department that engages in research and development. This study examined the R&D organization of a start-up as follows. There are ① companies with an affiliated research institute, ② companies that do not have an affiliated research institute but have an R&D department, ③ companies that do not have an affiliated research institute or R&D department but have R&D personnel, ④ companies that do not have an affiliated research institute, R&D department, or R&D personnel. The closer to ①, the higher the level of the R&D organization, while ④ is no form of R&D organization. In this study, the case of ④ is 0, and if it corresponds to ①~③, the dummy variable is 1. This study aimed to identify the effect of the presence of an R&D organization on firm performance by dividing it into a company with no R&D organization and at least an R&D manpower.
Technological competitiveness is a subjective evaluation, which corresponds to the company’s ability to acquire technology, partnership, and technical problem-solving. The questionnaire consisted of three questions, referring to Kwun and Jeong (2012).
Patients were defined as the number of patents held by a company to date. In addition to the patents for which patent registration has been completed due to the characteristics of a start-up, it also includes patents in which a patent application procedure is in progress.
This study examined whether start-ups have INNOBIZ, MAINBIZ, venture companies, and one-man creative companies. If any one of the four government certifications is present, it is treated as 1, otherwise 0 as a dummy variable.
The study examined the age and size of firms as control variables. The age of a firm is limited to the year of establishment in 2016, which is the period from the time of establishment to the time of the investigation. The size of the company was measured by the number of employees in 2015. This study also suggests the industry sector of the firm as a moderating variable. The company’s industry sector is set to 1 with manufacturing variables and 0 for knowledge services.
96
Table 1 Variables and measurements
Division Variables Measurement method Remarks
Dependent variables
Financial
performance Annual average sales
Doutriaux (1992), Yun et al. (2018) Non-financial performance: five-point Likert scale
Product competitiveness
▪ Market creation of products and services
▪ Functional diversity of products and services
▪ Market convergence of products and services
▪ Industry competitiveness of products and services ▪ Innovation of products and services Zahra (1996), Park (2010) Organizational performance ▪ Employment stability ▪ Turnover rate ▪ Employee satisfaction
Kohli and Jaworski (1990)
Customer performance
▪ Decrease in claims ▪ Increase in re-purchase rate ▪ Increase of regular and new customers
▪ Increased customer satisfaction
Kaplan and Norton (1992), Khirallah (2000),
Park (2014)
Goal achievement Goal achievement of a firm Kim (2015)
Independent variables
R&D intensity Annual average R&D investment /
annual average sales
Doutriaux (1992), Qian and Li (2003) R&D organization
If you have an R&D organization and manpower, it is treated as 1, otherwise 0 as a dummy variable.
Reichert and Zawislak (2014)
Technological competitiveness
Five-point Likert scale: ▪ Technology acquisition and alliance ability compared to competitors
▪ Ability to solve technical problems compared to competitors
▪ Ability to secure and utilize technical experts compared to competitors
Kwun and Jeong (2012)
Patent Number of patent applications and
registrations
Lee et al. (2001), Acha (2000) Government
certification
If any one of the four government certifications is present, it is treated as 1, otherwise 0 as a dummy variable.
Kim (2014) Control
variables
Firm age 2016 - established year
Firm size Number of employees in 2015
Moderator
variable Industry
Manufacturing, knowledge service industry
97
3.2 Data and estimation methods
This study conducted surveys of technology-based start-ups and obtained data for empirical analysis. The survey was limited to the companies that had been operating for at least seven years in the manufacturing and knowledge service industries.
The companies were compatible with the technology start-ups defined by the Small and Medium Business Administration. The detailed list is extracted from the corporate yearbook produced by the Korea Contents Media (Korea Content Media, 2016). This study distributed questionnaires to 9134 companies that correspond to technology start-ups in the corporate yearbook database as surveyed firms. We used clustered sampling, which proportionally derived companies from 17 regions and 71 industries. The survey questionnaire was distributed between September 26, 2016, and October 26, 2016, using the Internet, mobile, e-mail, etc. We collected a total of 251 responses, which was 2.7%. A total of 248 responses were used for the analysis. Regarding financial performance, 51 companies with no sales information for three years were excluded.
This study used the SPSS 20 software for calculating the mean, standard deviation, correlation coefficient, and other estimates. Then, to test the main hypotheses, Ordinary Least Square (OLS) regression analysis was performed on key factors influencing firm performance.
4. Empirical results
4.1 Basic descriptive statistics
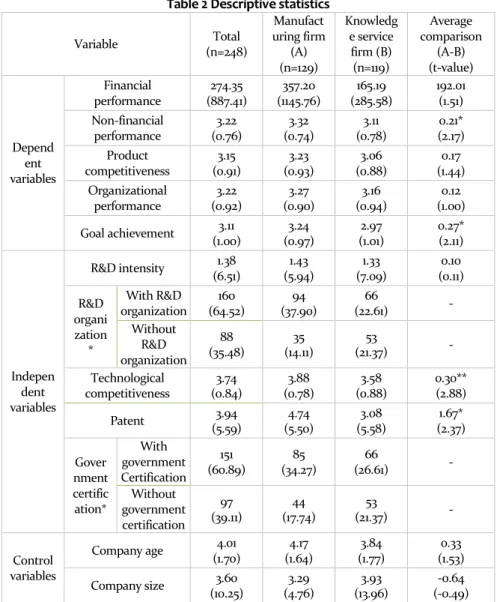
Basic statistics for each major variable are shown in Table 2. The average sales are around 274 million won. Regarding non-financial performances, customer performance (3.40) was the highest, and goal achievement (3.11) was the lowest. The average R&D intensity was 1.38, and the manufacturing industry was 1.43, higher than the average of the knowledge service industry (1.33). In the R&D organization, 35.5% of the respondents said that they had no research department or researchers. As it means that 64.5% of companies have at least R&D personnel, they are making their own efforts for technological innovation despite the small size of the organization. The government owned one or more certifications as a technology innovator, accounting for 60.9%.
The average age of a company is 4.01 years, and the average performance of the knowledge service industry is 3.84 years, which is lower than that of 4.17 years of the manufacturing industry. The company size (number of employees) was small at 3.6, and the service industry (3.93) was larger than the manufacturing industry (3.29). It is important to note that the job creation effect
98
of the knowledge service industry is greater than that of the manufacturing industry.
Table 2 Descriptive statistics
Variable Total (n=248) Manufact uring firm (A) (n=129) Knowledg e service firm (B) (n=119) Average comparison (A-B) (t-value) Depend ent variables Financial performance 274.35 (887.41) 357.20 (1145.76) 165.19 (285.58) 192.01 (1.51) Non-financial performance 3.22 (0.76) 3.32 (0.74) 3.11 (0.78) 0.21* (2.17) Product competitiveness 3.15 (0.91) 3.23 (0.93) 3.06 (0.88) 0.17 (1.44) Organizational performance 3.22 (0.92) 3.27 (0.90) 3.16 (0.94) 0.12 (1.00) Goal achievement (1.00) 3.11 (0.97) 3.24 (1.01) 2.97 0.27* (2.11) Indepen dent variables R&D intensity 1.38 (6.51) 1.43 (5.94) 1.33 (7.09) 0.10 (0.11) R&D organi zation * With R&D organization 160 (64.52) 94 (37.90) 66 (22.61) - Without R&D organization 88 (35.48) 35 (14.11) 53 (21.37) - Technological competitiveness 3.74 (0.84) 3.88 (0.78) 3.58 (0.88) 0.30** (2.88) Patent 3.94 (5.59) 4.74 (5.50) 3.08 (5.58) 1.67* (2.37) Gover nment certific ation* With government Certification 151 (60.89) 85 (34.27) 66 (26.61) - Without government certification 97 (39.11) 44 (17.74) 53 (21.37) - Control variables Company age 4.01 (1.70) 4.17 (1.64) 3.84 (1.77) 0.33 (1.53) Company size 3.60 (10.25) 3.29 (4.76) 3.93 (13.96) -0.64 (-0.49) Note: Basic statistics represent means, and () represents standard deviation. R&D organization and government certification (*) indicate the frequency (%) compared to 248
99
4.2 Correlation of key variables
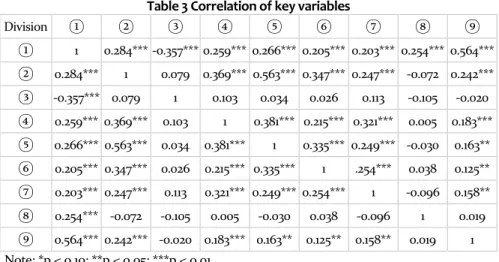
The correlation results between the main variables are shown in Table 3. Average sales and financial performance were significantly correlated with independent variables. A negative correlation was found between financial performance and R&D intensity. Independent variables except for firm age and R&D intensity were found to have a positive relationship with non-financial performance.
Table 3 Correlation of key variables
Division ① ② ③ ④ ⑤ ⑥ ⑦ ⑧ ⑨ ① 1 0.284*** -0.357*** 0.259*** 0.266*** 0.205*** 0.203*** 0.254*** 0.564*** ② 0.284*** 1 0.079 0.369*** 0.563*** 0.347*** 0.247*** -0.072 0.242*** ③ -0.357*** 0.079 1 0.103 0.034 0.026 0.113 -0.105 -0.020 ④ 0.259*** 0.369*** 0.103 1 0.381*** 0.215*** 0.321*** 0.005 0.183*** ⑤ 0.266*** 0.563*** 0.034 0.381*** 1 0.335*** 0.249*** -0.030 0.163** ⑥ 0.205*** 0.347*** 0.026 0.215*** 0.335*** 1 .254*** 0.038 0.125** ⑦ 0.203*** 0.247*** 0.113 0.321*** 0.249*** 0.254*** 1 -0.096 0.158** ⑧ 0.254*** -0.072 -0.105 0.005 -0.030 0.038 -0.096 1 0.019 ⑨ 0.564*** 0.242*** -0.020 0.183*** 0.163** 0.125** 0.158** 0.019 1 Note: *p < 0.10; **p < 0.05; ***p < 0.01
4.3 Hypothesis testing: technology competence factors affecting firm performance
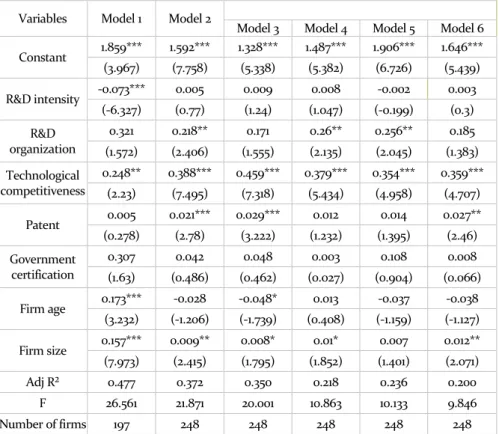
The results of the analysis of the technical competence factors affecting the start-up performance are shown in Table 4. This study analyzed the technology competence factors that influence the five types of start-up performances, namely sales, product competitiveness, organizational performance, customer performance, and goal achievement.
First, the factors influencing sales were R&D intensity and technological competitiveness. However, R&D intensity, which was confirmed as a positive factor of performance in studies on technology capability, was a negative influence on sales. This might be due to the characteristics of technology start-ups that invest a lot in R&D but do not immediately calculate their performance.
Second, technology competitiveness and patents had a significant influence on product competitiveness. This can be interpreted as the management’s efforts lead to the accumulation of intellectual property and technological competitiveness, thus forming product competitiveness in the market.
Third, R&D organization and technology competitiveness were significant factors that influenced organizational performance and customer performance.
100
Technological competitiveness and patents were found to have a positive effect on the achievement of the founding goals.
The factors that influenced non-financial performance are research organization, technological competitiveness, and patents. In particular, the effects of technological competitiveness on non-financial performance variables were all positive. This is a virtuous cycle of increasing the product competitiveness, employee and customer satisfaction of the start-up, and achieving the goal of the start-up as the ability to acquire and cooperate with the competitors, technical problem-solving ability, and secure and use technicians.
Table 4 Technology competence factors affecting firm performance
Variables Model 1 Model 2
Model 3 Model 4 Model 5 Model 6
Constant 1.859*** 1.592*** 1.328*** 1.487*** 1.906*** 1.646*** (3.967) (7.758) (5.338) (5.382) (6.726) (5.439) R&D intensity -0.073*** 0.005 0.009 0.008 -0.002 0.003 (-6.327) (0.77) (1.24) (1.047) (-0.199) (0.3) R&D organization 0.321 0.218** 0.171 0.26** 0.256** 0.185 (1.572) (2.406) (1.555) (2.135) (2.045) (1.383) Technological competitiveness 0.248** 0.388*** 0.459*** 0.379*** 0.354*** 0.359*** (2.23) (7.495) (7.318) (5.434) (4.958) (4.707) Patent 0.005 0.021*** 0.029*** 0.012 0.014 0.027** (0.278) (2.78) (3.222) (1.232) (1.395) (2.46) Government certification 0.307 0.042 0.048 0.003 0.108 0.008 (1.63) (0.486) (0.462) (0.027) (0.904) (0.066) Firm age 0.173*** -0.028 -0.048* 0.013 -0.037 -0.038 (3.232) (-1.206) (-1.739) (0.408) (-1.159) (-1.127) Firm size 0.157*** 0.009** 0.008* 0.01* 0.007 0.012** (7.973) (2.415) (1.795) (1.852) (1.401) (2.071) Adj R² 0.477 0.372 0.350 0.218 0.236 0.200 F 26.561 21.871 20.001 10.863 10.133 9.846 Number of firms 197 248 248 248 248 248
Note: Model 1: financial performance Model 2: non-financial performance—total
Model 3: non-financial performance—product competitiveness Model 4: non-financial performance—organizational performance Model 5: non-financial performance—customer performance Model 6: non-financial performance—goal achievement ( ) : t value; *p < 0.10; **p < 0.05; ***p < 0.01
101
4.4 Hypothesis testing: industry comparisons of technology competence factors affecting corporate performance
First, a model of the financial performance of the manufacturing industry was analyzed. R&D intensity was found to have a significant negative effect on sales in the manufacturing industry. The model of the non-financial performance of the manufacturing industry was analyzed. In manufacturing, technological competitiveness and patents were found to have a positive impact on non-financial performance. In detail, non-non-financial performance variables showed that R&D intensity, technological competitiveness, and patents had a positive effect on product competitiveness. Only technological competitiveness had a positive effect on organizational performance, customer performance, and goal achievement.
Table 5 technology competence factors influencing firm performance (manufacturing industry)
Variables Model 7 Model 8
Model 9 Model 10 Model 11 Model 12
Constant 2.341*** 1.35*** 1.073*** 1.405*** 1.644*** 1.278*** (3.825) (4.343) (2.731) (3.13) (3.856) (2.765) R&D intensity -0.102*** 0.01 0.023** 0.02 0.004 -0.008 (-6.555) (1.154) (2.176) (1.599) (0.342) (-0.614) R&D organization 0.321 0.221* 0.133 0.233 0.322* 0.195 (1.225) (1.74) (0.831) (1.271) (1.849) (1.036) Technological competitiveness 0.172 0.478*** 0.492*** 0.428*** 0.458*** 0.534*** (1.292) (6.906) (5.629) (4.283) (4.821) (5.186) Patent 0.012 0.022** 0.046*** 0.014 0.009 0.02 (0.666) (2.246) (3.703) (0.968) (0.64) (1.364) Government certification 0.233 -0.07 0.106 -0.173 0.023 -0.238 (0.989) (-0.602) (0.715) (-1.022) (0.142) (-1.367) Firm age 0.163** -0.041 -0.055 0.001 -0.049 -0.061 (2.533) (-1.302) (-1.392) (0.028) (-1.124) (-1.308) Firm size 0.166*** 0.016 0.017 0.016 0.006 0.024 (7.88) (1.377) (1.182) (0.991) (0.363) (1.403) Adj R² 0.575 0.416 0.412 0.182 0.236 0.251 F 22.417 14.003 13.806 5.074 6.635 7.142 Number of firms 112 129 129 129 129 129
Note: Model 7: financial performance Model 8: non-financial performance—total
102
Model 10: non-financial performance—organizational performance Model 11: non-financial performance—customer performance Model 12: non-financial performance—goal achievement ( ) : t value; *p < 0.10; **p < 0.05; ***p < 0.01
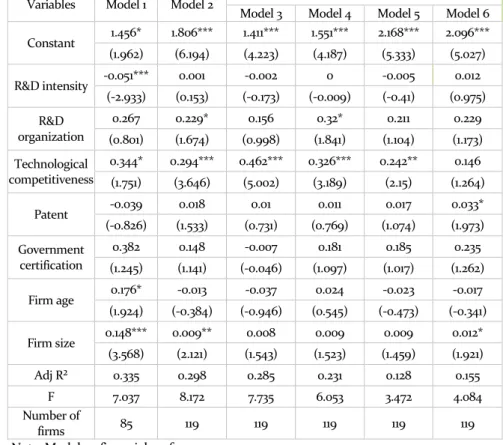
Next, we analyzed the model of financial performance of the service industry. R&D intensity was found to have a significant negative effect on sales in the service industry as in the manufacturing industry. The model of the non-financial performance of the service industry was analyzed. In the service industry, technological competitiveness was found to have a positive effect on non-financial performance. The results of the non-financial analysis showed that only technological competitiveness had a positive effect on product competitiveness, organizational performance, and customer performance. However, there was no significant effect on goal achievement.
Table 6 Technology competence factors influencing firm performance (service industry)
Variables Model 1 Model 2
Model 3 Model 4 Model 5 Model 6
Constant 1.456* 1.806*** 1.411*** 1.551*** 2.168*** 2.096*** (1.962) (6.194) (4.223) (4.187) (5.333) (5.027) R&D intensity -0.051*** 0.001 -0.002 0 -0.005 0.012 (-2.933) (0.153) (-0.173) (-0.009) (-0.41) (0.975) R&D organization 0.267 0.229* 0.156 0.32* 0.211 0.229 (0.801) (1.674) (0.998) (1.841) (1.104) (1.173) Technological competitiveness 0.344* 0.294*** 0.462*** 0.326*** 0.242** 0.146 (1.751) (3.646) (5.002) (3.189) (2.15) (1.264) Patent -0.039 0.018 0.01 0.011 0.017 0.033* (-0.826) (1.533) (0.731) (0.769) (1.074) (1.973) Government certification 0.382 0.148 -0.007 0.181 0.185 0.235 (1.245) (1.141) (-0.046) (1.097) (1.017) (1.262) Firm age 0.176* -0.013 -0.037 0.024 -0.023 -0.017 (1.924) (-0.384) (-0.946) (0.545) (-0.473) (-0.341) Firm size 0.148*** 0.009** 0.008 0.009 0.009 0.012* (3.568) (2.121) (1.543) (1.523) (1.459) (1.921) Adj R² 0.335 0.298 0.285 0.231 0.128 0.155 F 7.037 8.172 7.735 6.053 3.472 4.084 Number of firms 85 119 119 119 119 119
103
Model 14: non-financial performance—total
Model 15: non-financial performance—product competitiveness Model 16: non-financial performance—organizational performance Model 17: non-financial performance—customer performance Model 18: non-financial performance—goal achievement ( ) : t value; *p < 0.10; **p < 0.05; ***p < 0.01
5. Conclusion
This study analyzed how technology capabilities held by technology-based start-ups affect their performance. The effects of indicators of technological capacity like R&D intensity, R&D organization, technology competitiveness, patents, and certification were analyzed. Factors affecting sales were R&D intensity and technological competitiveness. Technology competitiveness and patents were the significant factors influencing product competitiveness. The factor that positively influenced organizational performance, customer performance, and achievement of start-up goals was technological competitiveness.
The results of the analysis of the technology capability factors affecting the start-up performance are as follows. R&D intensity has a significant negative impact on sales in both manufacturing and knowledge services. The results of the analysis in the manufacturing industry confirm that technological competitiveness and patents have a positive impact on non-financial performance, but in the knowledge service industry, only technological competitiveness has a positive influence on non-financial performance. In both manufacturing and service sectors, technological competitiveness has a positive impact on non-financial performance.
This study has the following implications through the analysis results. First, we need to support building a long-term R&D portfolio. As a result of the empirical analysis, R&D intensity decreased sales of technology start-ups. In the early stages, the expansion of sound technical capabilities is more important than that of R&D investments financially. Technological competitiveness has an even positive impact on sales and non-financial performance; hence, securing technological competitiveness is a driving force for corporate growth in the long term. Therefore, government policies for start-ups should be designed to identify and foster long-term innovation potential rather than short-term financial performance.
Second, support for strengthening the technical capacity of the knowledge service industry should be strengthened. As a result of analyzing the knowledge service industry, the relationship between technology competence and start-up performance was not statistically significant except technological competitiveness. Comparing simple figures, technological competitiveness and
104
patents are significantly lower than manufacturing, and 44.5% of service companies do not have R&D personnel. This means that the technology competency of service-related technology start-ups is low and that the technological skills they possess are not related to their performance. Therefore, there is a need for bold investment and deregulation that can help technology service firms to innovate.
Third, a technology-based start-up support policy should be prepared considering the characteristics of the start-up companies and managers. Various problems related to different attributes of start-up companies, namely, the industries to which they belong, their growth stage, and the performance of specific companies. In reality, the knowledge, experience, and demographic characteristics of founders, representatives, and executives of many tech start-ups are so diverse that it is virtually impossible to have a support policy that covers all of them. However, in the design and execution of technological innovation policies for start-up companies, it is necessary to take into account certain aspects such as personalized incubation, investment, and training for individual companies and managers.
Finally, the experience of Korea’s technology-based start-up analyzed in this study contributes to discovering the necessity of innovation capabilities and entrepreneurship for start-ups in developing countries who are striving to deal with limitations of scarce financial resources. The study also implies the importance of fostering long-term innovation potential rather than relying on short-term financial performance.
Acknowledgements
This article is based on the results of “A Study on the Factors Affecting the Performance of the Technology-based Start-ups” (KISTEP Research Report 2017-009).
105
References
Acha, V.(2000), “The Role of Technological Capabilities in Determining Performance: The Case of the Upstream Petroleum Industry”, The DRUID Conference on Industrial Dynamics, Hillerod.
Archibugi, D., and M. Pianta(1996), “Measuring Technological Change through Patents and Innovation Surveys”, Technovation, 16(9), 451-468.
Bettis, R. A., and M. A. Hitt(1995), “The New Competitive Landscape”, Strategic Management Journal, 16(S1), 7-20.
Chandler, G. N., and S. H. Hanks(1994), “Market Attractiveness, Resource-based Capabilities, Venture Strategies, and Venture Performance”, Journal of Business Venturing, 9(4), 331-349.
Cohen, W., and D. Levinthal(1990), “Absorptive Capacity: A New Perspective on Learning and Innovation”, Administrative Science Quarterly, 35(1), 128-152. Coombs, J. E., and P. E. Bierly(2006), “Measuring Technological Capability and
Performance”, R&D Management, 36(4), 421-438.
Cooper, A. C.(1971), The Founding of Technologically-based Firms, Milwaukee: The Center for Venture Management.
Deeds, D. L.(2001), “The Role of R&D Intensity, Technical Development and Absorptive Capacity in Creating Entrepreneurial Wealth in High Technology Start-ups”, Journal of Engineering and Technology Management, 18(1), 29-47.
Deeds, D. L., de Carolis, D. M., and J. E. Coombs(1998), “Firm-specific Resources and Wealth Creation in High-technology Ventures: Evidence from Newly Public Biotechnology Firms”, Entrepreneurship Theory and Practice, 22(3), 55-73.
Doutriaux, J.(1991), “High-Tech Start-Ups, Better Off with Government Contracts than with Subsidies: New Evidence in Canada”, IEEE Transaction on Engineering Management, 38(2), 127-135.
Global Entrepreneurship Monitor, GEM 2008 Global Report. Global Entrepreneurship Monitor, GEM 2013 Global Report. Global Entrepreneurship Monitor, GEM 2017/2018 Global Report.
Hall, L., and S. Bagchi-Sen(2002), “A Study of R&D, Innovation, and Business Performance in the Canadian Biotechnology Industry”, Technovation, 22(4), 231-244. Hamel, G., and C. K. Prahalad(1994), “The Core Competence of the Corporation”,
Harvard Business Review, Jul-Aug, 122-128.
Helms, M. M., Dibrell, C., and P. Wright(1997), “Competitive Strategies and Business Performance: Evidence from the Adhesives and Sealants Industry”, Management Decision, 35(9), 689-703.
Henderson, R. M., and K. B. Clark(1990), “Architectural Innovation: The Reconfiguration of Existing Product Technologies and the Failure of Established Firms”, Administrative Science Quarterly, 35(1), 9-31.
International monetary fund(2019), World Economic Outlook: Global Manufacturing Downturn, Rising Trade Barriers.
Kaplan, R. S., and D. P. Norton(1996), The Balanced Scorecard: Translating Strategy into Action, Boston: Harvard Business School Press.
106
Khirallah, K.(2000), “Customer Relation Management: How to Measure Success?”, Bank Accounting & Finance, 13(4), 21-28.
Kim, C.K. (2015). Analysis of factors influencing the early performance of technology-based start-ups. Korea Polytechnic University Doctoral Thesis.
Kim, Juil(2014), effect of innovation activity and governmental support on innovation performance : comparison between innovative SMEs and general companies, Konkuk University Master’s Thesis.
Kim, L.(1999), “Building Technological Capability for Industrialization: Analytical Frameworks and Korea’s Experience”, Industrial and Corporate Change, 8(1), 111-136.
Kogut, B., and U. Zander(1995), “What Firms Do? Coordination, Identity, and Learning”, Organization Science, 7(5), 502-518.
Kohli, A. K., and B. J. Jaworski(1990), “Market Orientation: The Construct, Research, Propositions, and Managerial Implications”, Journal of Marketing, 54(2), 1-18. Korea Business Incubation Association (2015). Technology-based start-up guide,
Daejeon.
Korea Content Media (2016). Korea SMTp 2017, Seoul.
Kwun, Mi Young, Jeong, Hae Joo(2012), The Effect of Entrepreneurs’ Characteristic, Technological Capabilities and Network on Firm Performance of Technology-based Start-ups, Asia-Pacific Journal of Business Venturing and Entrepreneurship 7(1), pp. 7-18.
Lee, C., Lee, K., and J. M. Pennings(2001), “Internal Capabilities, External Networks, and Performance: A Study on Tech. Based Ventures”, Strategic Management Journal, 22(6-7), 615-640.
Low, M. B., and I. C. MacMillan(1988), “Entrepreneurship: Past Research and Future Challenges”, Journal of Management, 14(2), 139-161.
Miller, D., and J. Shamise(1996), “The Resource-Based View of the Firm in Two Environments: The Hollywood Film Studios from 1936 to 1965”, Academy of Management Journal, 39(3), 519-543.
Park, S.G. (2014). The effects of the perceived usefulness of government SME R&D support policy on the technology innovation system. Kyungil University Doctoral Thesis.
Park, S.J. (2010). A study on determinants of the performance of technology venture. Chung-Ang University Master’s Thesis.
Phillips, P. A.(1996), “Strategic Planning and Business Performance in the Quoted UK Hotel Sector: Results of an Exploratory Study”, International Journal of Hospitality Management, 15(4), 347-362.
Reichert, F. M., and P. A. Zawislak(2014), “Technological Capability and Firm Performance”, Journal of Technology Management & Innovation, 9(4), 20-35. Robinson, R. B. Jr., and J. A. Pearce(1986), “Product Life-Cycle Considerations and the
Nature of Strategic Activities in Entrepreneurial Firms”, Journal of Business Venturing, 1(2), 207-224.
Romanelli, E.(1989), “Environments and Strategies of Organization Start-up: Effects on Early Survival”, Administrative Science Quarterly, 34(3), 369-387.
Rothwell, R., and W. Zegveld(1982), Innovation and the Small and Medium Sized Firm, London: Frances Pinter.
107
Schoenecker, T., and L. Swanson(2002), “Indicators of Firm Technological Capability: Validity and Performance Implications”, IEEE Transactions of Engineering Management, 49(1), 36-44.
Schumpeter, J. A.(1934), Capitalism, Socialism, and Democracy, New York: Harper & Row.
Shin, Y. (2011). Effects of technology based entrepreneur’s characteristics on business performance. Hanbat National University Master’s Thesis.
Shrader, R. C., and Simon, M.(1997), “Corporate Versus Independent New Ventures: Resource, Strategy and Performance Differences”, Journal of Business Venturing, 12(1), 47-66.
Small and Medium Business Administration, Business Development Agency, (2016), Survey on the Establishment of Establishment in 2015.
Stearns, T. M., Carter, N. M., Reynolds, P. D., and M. L. Williams(1995), “New Firm Survival: Industry, Strategy, and Location”, Journal of Business Venturing, 10(1), 23-42.
Tsai, K.(2004), “The Impact of Technological Capability on Firm Performance in Taiwan’s Electronics Industry”, Journal of High Technology Management Research, 15(2), 183-195.
Tushman, M. L., and P. Anderson(1986), “Technological Discontinuities and Organizational Environments”, Administrative Science Quarterly, 31(3), 439-465. Zahra, S. A.(1996), “Technology Strategy and New Venture Performance: A Study of
Corporate-sponsored and Independent Biotechnology Ventures”, Journal of Business Venture, 11(4), 289-321.