Research Article
Analysis of the Relationship between Risk Perception and
Willingness to Pay for Nuclear Power Plant Risk Reduction
Mirae Yun, Sang Hun Lee, and Hyun Gook Kang
Department of Nuclear and Quantum Engineering, KAIST, 291 Daehak-ro, Yuseong-gu, Daejeon 305-701, Republic of Korea
Correspondence should be addressed to Hyun Gook Kang; [email protected] Received 21 December 2015; Accepted 25 February 2016
Academic Editor: Eugenijus Uˇspuras
Copyright © 2016 Mirae Yun et al. This is an open access article distributed under the Creative Commons Attribution License, which permits unrestricted use, distribution, and reproduction in any medium, provided the original work is properly cited. With the adoption of new technologies, more risk is introduced into modern society. Important decisions about new technologies tend to be made by specialists, which can lead to a mismatch of risk perception between citizens and specialists, resulting in high social cost. Using contingent valuation methods, this paper analyzes the relationship between willingness to pay (WTP) and the factors expressed through people’s image of nuclear power plants (NPP), their perception of NPP safety, and how these can be affected by their scientific background level. Results indicate that groups with a high scientific background level tend to have low risk perception level, represented through their image and safety levels. Further, the results show that mean WTP is dependent on scientific background and image levels. It is believed that these results could help decision makers address the mismatch of trust between the public and specialists in terms of new policy.
1. Introduction
Society becomes more complex as new technologies are invented and interact with each other [1]. Many special inter-est groups come into conflict over their opposing goals; in particular, there exists a large divide between nuclear energy supporters and opponents in Korea [2]. In one case, the decision to build a radioactive waste processing facility in Gyeongju, Korea, took almost 20 years for the government and the nuclear operator to convince the public of its safety and necessity. Relatedly, public opinion for constructing new nuclear power plants (NPP) is divided into approval and dis-approval, and in situations like this there will be a substantial waste of time and money without public consensus about the issue [3, 4]. Studies about these controversies are conducted in various fields such as health communication, environmen-tal issues, and products and services [5].
Considering the complexity and exclusivity of the nuclear energy field, the role of its experts is essential to achieve public consensus by resolving the conflict induced by a mismatch of perception [6]. There is a difference between the experts’ and the public’s risk perception, in that the experts define risk according to its qualities, namely, its likelihood, while on the other hand the public defines it according to quantity, or in
other words its level of hazard and genetic heritability [7]. Risk communication is based on risk perception, a concept which is defined as a subjective value judgment, so a mis-match in risk perception causes problems in risk commu-nication between the two groups, leading to sharp division [8, 9].
It has been suggested that supplying suitable information through education may solve this problem by inducing perception change [10]. This can influence risk perception by affecting some characteristics of risk like necessity, safety, knowledge, and so on [11, 12]. In previous studies, the charac-teristics of risk have been categorized into two groups: dread and unknown [13, 14]. It was suggested that when a risk causes no fear and is well known, people will have low risk percep-tion.
The risk perception factors can affect willingness to pay (WTP), which refers here to the amount of money people would pay to reduce risk in nuclear power plants. WTP is a common measure of the value of goods or services to the indi-vidual in economics [15]. In addition, the value of statistical life (VSL) can be derived by dividing WTP by risk reduction. Also, this VSL can be used for calculation of external cost of NPP reflecting individual’s risk perception [16].
Volume 2016, Article ID 6293758, 9 pages http://dx.doi.org/10.1155/2016/6293758
These risk perception factors have also been researched outside the nuclear field. It was found that a group of factors including benefit, public exposure, and dread, called the effect of risk, was the dominant factor analyzed by the contingent valuation method (CVM) and psychometric paradigm meth-ods [17]. Furthermore, previous research showed that risk perception affects people’s WTP [18]; however, the specific factors of risk perception that can affect WTP and their relationship have not been discussed.
This study examines how the representative risk factors affect perception level, finds a mean WTP according to levels of risk perceptions, and analyzes their relationships. Three risk perception factors are addressed regarding people’s perception of NPPs: their image of NPPs, their perception of NPP safety, and their scientific background level. According to previous studies, image and scientific background levels represent the dread and the unknown groups, respectively [13, 14]. Safety is included, which can be influenced by infor-mation supplied [11]. Through these factors, risk perception is estimated and the relationship between it and WTP is also verified. Mean WTP is analyzed by the CVM-DBDC model for estimating the value of nonmarket products. All of the basic information for analysis is obtained from a question-naire.
Based on the results, if a specific group needs to be considered in the calculations of external costs for NPPs, mean WTP, making up the largest portion of external costs, can be estimated by existing image or safety scores which have already been investigated for that group [19]. This study can provide insight on verifying how risk communication affects external costs by finding the relationship between risk per-ception and mean WTP.
2. Methods
2.1. Design Survey Questionnaire for DBDC Model. A spe-cially designed questionnaire is necessary for the investiga-tion of risk percepinvestiga-tion with percepinvestiga-tion factors and the CVM. General data like gender and age is first asked to respondents. Perception of NPP image and safety is then asked to verify the relationship between them and WTP. In this step, a 5-point Likert scale is applied, being the most common [20], with a 1 response indicating a bad image or highly unsafe and 5 indicating a good image or highly safe.
Samples are then divided into three groups according to the participants’ scientific knowledge level. Group 1 consists of people currently majoring in nuclear engineering. Group 2 is made up of current science or engineering majors. Ran-domly selected people from the general population in Korea make up group 3, with a variety of dwellings, income, and education. As groups 1 and 2 are made up of students, the age range is from 18 to 29 and half of them have very low incomes. As dependents, they may not consider their own income, which may be advantageous as they may judge mean WTP neutrally. However, it is hard to compare these group’s WTP with that of others’ considering the differing values they may assign to any money amount. However, it is hard to compare this group’s WTP with that of others’ considering the differing values they may assign to any money amount. For consistency
in comparing the groups, group 3 samples were restricted to a similar age range. The survey method is different according to the group. For groups 1 and 2, face-to-face surveys were selected, while internet surveys were employed for group 3 to obtain data independent of the distance between the researchers and respondents. Data from various respondents with different genders, ages, dwellings, and education levels is beneficial.
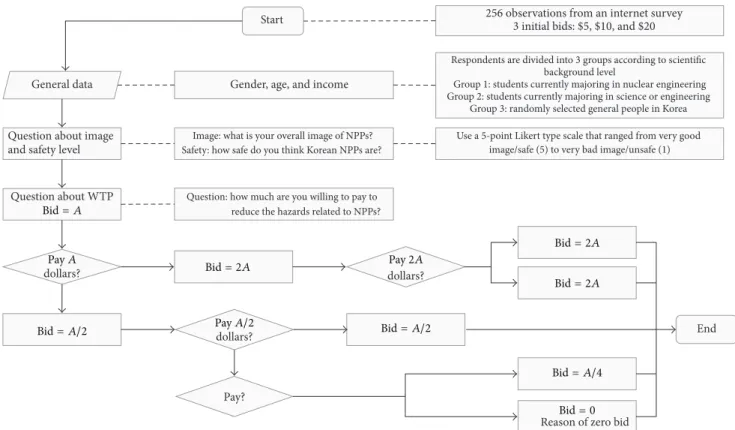
For eliciting WTP, there were three questionnaires with different initial bids, each with three questions about WTP as the double-bounded dichotomous choice (DBDC) model was applied. There are several means of paying for NPP risk reduction, such as through income tax or additional electric-ity fees, and in this study additional electricelectric-ity fees were cho-sen. Therefore, “How much are you willing to pay to reduce the hazards related to NPPs?” was the first question with an initial bid⟨𝐴⟩ suggested. These bids were decided by a pilot survey. Then, according to the respondent’s answer, the sec-ond question’s bid changes to double or half the amount of the initial bid. The third question is for No-No respondents and investigates whether they are willing to pay or not, regardless of the amount of money, and the reasons for their zero bid. All these processes are described in Figure 1.
2.2. Contingent Valuation Method. A CVM is an analytical technique used to estimate the value of nonmarket goods. Estimation data from a hypothetical market is used instead of that from a real market. Therefore, researchers need to create a hypothetical market and use specially designed question-naires to investigate responses under several conditions [20]. There are several methods of CVMs, for example, bidding game, open-ended, payment card, and dichotomous choice [18, 21]. The open-ended method allows the respondent to write down their WTP, and the payment card method induces WTP about target goods by supplying an average payment list about other kinds of goods. In the bidding game and the dichotomous methods, the respondents answer questions which ask for their payment intention about a certain amount of money. Their WTP converges to a specific point with con-tinuous questioning in the bidding game and is determined with several yes-or-no questions in the dichotomous method. The specific type of CVM can make a significant difference for unfamiliar public goods like NPPs [22]. This study utilizes the dichotomous method as it can mimic payment in real markets and has been generally used [21]. Researchers can design questionnaires for the dichotomous method to include one or a series of questions. When the questionnaire asks just one question, it is known as a single-bounded dichotomous choice (SBDC), and if it asks two questions it can be catego-rized as a DBDC. The research goal determines the proper method to apply. DBDC is used in this study to obtain high statistical efficiency of the data. Data from the DBDC ques-tionnaire is used to find mean WTP and the utility difference model is applied in the data processing.
2.2.1. Utility Difference Model. Binary responses from the questionnaire can be processed by the utility difference model. Related parameters are estimated by maximum
Start 256 observations from an internet survey3 initial bids: $5, $10, and $20
Respondents are divided into 3 groups according to scientific background level
Group 1: students currently majoring in nuclear engineering Group 2: students currently majoring in science or engineering
Group 3: randomly selected general people in Korea Use a 5-point Likert type scale that ranged from very good
image/safe (5) to very bad image/unsafe (1) Gender, age, and income
Image: what is your overall image of NPPs? Safety: how safe do you think Korean NPPs are?
Question: how much are you willing to pay to reduce the hazards related to NPPs? General data
Question about image and safety level
Question about WTP
dollars?
Reason of zero bid Pay? dollars? dollars? End Bid= 2A Bid= A/4 Bid= 2A Bid= A/2 Pay2A Bid= 2A PayA/2 Bid= 0 Bid= A/2 PayA Bid= A
Figure 1: Logical process of the questionnaire used for the CVM survey.
likelihood estimation (MLE). Mean WTP can be assessed according to the distribution’s characteristics [23].
The utility function refers to whether a respondent is willing to pay or not. It has three variables𝑗, 𝑚, and 𝑆. Each individual’s utility function is expressed as follows:
𝑢 = 𝑢 (𝑗, 𝑚; 𝑆) , (1)
where𝑗 is the state of the nonmarket resource (𝑗 = 0: no access to the resource,𝑗 = 1: access to the resource), 𝑚 is the individual’s income, and𝑆 is a vector of other observable attributes which might affect the utility function (e.g., the individual’s sex and age).
However, this function contains some components that are unobservable to the econometric investigator, such as the factors which affect the respondent’s reasoning behind their answer. These unobservable components are separated from the direct utility function as shown in
𝑢 (𝑗, 𝑚; 𝑆) = V (𝑗, 𝑚; 𝑆) + 𝜀𝑗. (2) Here,𝜀𝑗is the unobservable components represented as a random and stochastic variable with zero mean andV(𝑗, 𝑚; 𝑆) is an indirect utility function which depends on observable characteristics of the individual such as income (𝑚) and the individual’s characteristics (𝑆). A crucial assumption is that each individual knows their utility function with certainty and they want to maximize their utility. Then, when presented
with an amount of money𝐴, called the bid, the respondent will agree to pay the amount if
Pr{“yes”} = Pr [V (1, 𝑚 − 𝐴; 𝑆) + 𝜀1≥ V (0, 𝑚; 𝑆) + 𝜀0] = Pr [ΔV ≥ 𝜂] ,
ΔV ≡ V (1, 𝑚 − 𝐴; 𝑆) − V (0, 𝑚; 𝑆) , 𝜂 ≡ 𝜀0− 𝜀1.
(3)
Then, it can be expressed by using the logistic cumulative density function (CDF):
Pr{“yes”} = Pr (𝑗 = 1) = Pr [ΔV ≥ 𝜂] = 𝐹𝜂[ΔV] ,
Pr{“no”} = Pr (𝑗 = 0) = Pr [ΔV ≤ 𝜂] = 1 − 𝐹𝜂[ΔV] , (4) where𝐹𝜂[ΔV] is the cumulative distribution function of 𝜂.
To convert this equation using WTP and𝐴, Pr{“yes”} = Pr (𝑗 = 1) = Pr (WTP ≥ 𝐴) = 1 − 𝐺WTP(𝐴) , Pr{“no”} = Pr (𝑗 = 0) = Pr (WTP < 𝐴) = 𝐺WTP(𝐴) , (5) where𝐺WTP(𝐴) is a CDF of WTP. 1 − 𝐺WTP(𝐴) = 𝐹𝜂[ΔV] =1 + 𝑒1−V. (6)
For easy analysis, the indirect utility function can be converted to an equation using𝛼 and 𝛽 as it is supposed to be a linear function:
V (𝑗, 𝑚; 𝑆) = 𝑎𝑗+ 𝛽𝑚. (7)
The difference between the indirect utility functions is ∴ ΔV = V (1, 𝑚 − 𝐴; 𝑆) − V (0, 𝑚; 𝑆) = [𝑎1+ 𝛽 (𝑚 − 𝐴)] − [𝑎0+ 𝛽𝑚] = 𝛼 − 𝛽𝐴, 𝐺WTP(𝐴) = 1 − 𝐹𝜂[ΔV] = 1 1 + 𝑒𝛼−𝛽𝐴. (8)
By using this difference, mean WTP can be calculated as follows: WTPmean= ∫ ∞ 0 [1 − 𝐺WTP(𝐴)] 𝑑𝐴 − ∫0 −∞𝐺WTP(𝐴) 𝑑𝐴 = 𝛼 𝛽. (9)
2.2.2. Maximum Likelihood Estimation. As seen in (9), mean WTP is found and expressed using𝛼 and 𝛽. Therefore, an MLE will be used to find𝛼 and 𝛽. The unknown probability density function 𝑝(𝑋; 𝜃) and its joint density function is defined as 𝑝 (𝑋; 𝜃) = 𝐿 (𝑥1, 𝑥2, . . . , 𝑥𝑁; 𝜃 ) = 𝑝 (𝑥1; 𝜃 ) 𝑝 (𝑥2; 𝜃 ) ⋅ ⋅ ⋅ 𝑝 (𝑥𝑁; 𝜃 ) =∏𝑁 𝑖=1 𝑝 (𝑥𝑖; 𝜃 ) . (10)
In the DBDC model, if the respondent answers “yes” when the suggested bid is𝐴𝑖, the following question’s bid will be𝐴𝑢𝑖 which is double𝐴𝑖. If the respondent answers “no” when the suggested bid is𝐴𝑖, the following question’s bid will be half of𝐴𝑖and𝐴𝑑𝑖.
There are four kinds of answers: Yes-Yes, Yes-No, No-Yes, and No-No. The probability of each case is indicated as𝜋. For example,𝜋𝑌𝑌means that the respondent’s WTP is higher than𝐴𝑖and even higher than𝐴𝑢𝑖. Then, it can be derived as
𝜋𝑌𝑌(𝐴𝑖, 𝐴𝑢𝑖) = 1 − 𝐺WTP(𝐴𝑢𝑖).
The log likelihood function of WTP in the DBDC model is expressed as ln𝐿 = 𝑁 ∑ 𝑖=1(𝐼 𝑌𝑌 𝑖 ln𝜋𝑌𝑌+ 𝐼𝑖𝑌𝑁ln𝜋𝑌𝑁+ 𝐼𝑖𝑁𝑌ln𝜋𝑁𝑌 + 𝐼𝑖𝑁𝑁ln𝜋𝑁𝑁) = 𝑁 ∑ 𝑖=1 (𝐼𝑖𝑌𝑌ln[1 − 𝐺WTP(𝐴𝑢𝑖)] + 𝐼𝑖𝑌𝑁ln[𝐺WTP(𝐴𝑢𝑖) − 𝐺WTP(𝐴𝑖)] + 𝐼𝑖𝑁𝑌 ⋅ ln [𝐺WTP(𝐴𝑖) − 𝐺WTP(𝐴𝑑𝑖)] +𝐼𝑁𝑁𝑖 ⋅ ln [𝐺WTP(𝐴𝑑𝑖)]) ,
𝐼𝑖𝑌𝑌= 1 (𝑖th respondent’s response is “yes-yes”) ,
𝐼𝑖𝑌𝑁= 1 (𝑖th respondent’s response is “yes-no”) , 𝐼𝑖𝑁𝑌= 1 (𝑖th respondent’s response is “no-yes”) , 𝐼𝑁𝑁
𝑖 = 1 (𝑖th respondent’s response is “no-no”) . (11) Therefore,𝜃 = (𝛼, 𝛽), which maximizes the personal log likelihood function. By using𝜃, 𝐺WTP(𝐴; 𝜃) can be derived, as well as mean WTP as follows:
𝜃 = (𝛼, 𝛽) , 𝐺WTP(𝐴𝑖; 𝜃 ) = 1 1 + 𝑒𝑎−𝛽𝐴𝑖, WTPmean= ∫ ∞ 0 [1 − 𝐺WTP(𝐴; 𝜃)] 𝑑𝐴 − ∫0 −∞𝐺WTP(𝐴; 𝜃) 𝑑𝐴 = 𝛼 𝛽. (12)
As there are no negative WTP values, a truncated mean which considers only positive values was used to estimate WTP:
WTPmean= 1
𝛽ln[1 + 𝑒𝛼] . (13)
3. Results
3.1. General Statistical Data. There were 224 observations from the survey. The observations can be categorized accord-ing to the demographics of gender, education, and income, expressed in Table 1. The percentage of male respondents was slightly higher than female. In addition, over four-fifths of the respondents had an education level higher than college graduation. Regarding income, because they were young and students, more than half of them had an income far below the national average (average Korean worker’s salary was $3235/month in 2014 from KOSIS). Except for the lowest income, most other income levels were quite evenly dis-tributed.
For each group, three questionnaires with different bid amounts were randomly supplied to participants. Table 2 is a summary of questionnaire distribution.
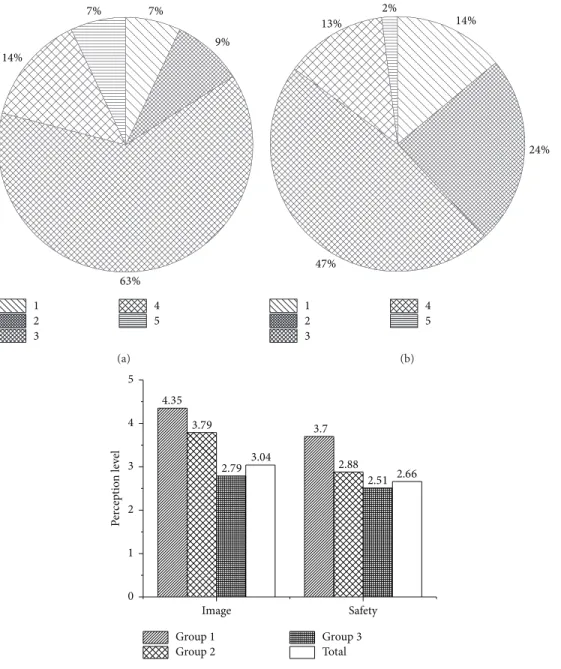
These raw data were analyzed according to the three fac-tors of scientific knowledge level, image level, and safety level. As the groups were already divided according to scientific knowledge level, the respondents’ perception about image and safety level is analyzed and compared in the next section. 3.2. Perception about Image and Safety Level. Figures 2(a) and 2(b) present the various image and safety level responses. In both cases, almost half of the respondents are found in the middle. Considering image, the number of people with a positive image about NPPs, who responded by 4 or 5, was larger than that of people who have a negative image on NPPs, who responded by 1 or 2. However, this is reversed for safety level, as almost 40 percent of respondents thought that NPPs are unsafe, while only 15 percent of respondents thought
Table 1: Basic demographics of respondents. Characteristics Observations [people] Percentage[%] Gender Male 118 52.68 Female 106 47.32 Education High school 7 14.07 College 199 73.24 Graduate school 18 12.69 Income [$/month] Below 500 123 54.91 500–1000 19 8.48 1000–1500 31 13.84 1500–2000 31 13.84 Above 2000 20 8.93
Table 2: Designed questionnaire divided by scientific background level (group number) and bid.
Group Questionnaire type Bid [$] Observations (obs.) [people] Total obs. 1 A 5 6 20 B 10 10 C 20 4 2 A 5 10 24 B 10 3 C 20 11 3 A 5 54 180 B 10 68 C 20 58
that NPPs are safe. Figure 2(c) aggregates the three factors, describing the average values of image and safety levels according to group. Similar to previous findings, the more scientific background they had, the lower their risk percep-tion was [7]. In addipercep-tion, it was observed that the dominant region (bold and italic numbers in Table 3) moves according to the group number; image level decreases with decreasing scientific background knowledge. This supports the previous statement.
3.3. Mean WTP and Its Relationship with the Factors
3.3.1. Mean WTP according to Scientific Background Level. Mean WTP was assessed with a DBDC model in this study, with raw data from the questionnaire processed by STATA/SE 13.1.
In this process, people who did not want to pay were excluded from the samples. There were 32 people who selected “No” for all three questions. These zero bids can be categorized into true zero bids and protest bids. True zero bids reflect the respondents’ true preference about the goods [24]. For example, they make a zero bid because of economic reasons. Protest bids are biased answers which can be further categorized as strategic bias or starting-point bias, among others [25].
Table 3: The most frequently observed (bold) and second-most frequently observed (italic) regions.
Group 1 Group 2 Group 3
Image 1 0 0 8.89
Image 2 0 0 11.67
Image 3 5.00 37.50 72.22
Image 4 55.00 45.83 5.56
Image 5 40.00 16.67 1.67
∗Every value of this table represents percentage (%) of each sample
compar-ing with total sample number of each group.
Table 4: Mean WTP estimation according to scientific background level (group number).
Category DBDC model 𝛼 𝛽 Group 1 Coefficient 1.666684a 0.0001962b 𝑧 1.59 4.73 Mean WTP [$] 9.379 95% confidence interval [$] 5.719∼13.039 Group 2 Coefficient 2.17656b 0.0001809b 𝑧 3.31 5.40 Mean WTP [$] 12.629 95% confidence interval [$] 8.835∼16.423 Group 3 Coefficient 1.750892b 0.0001005b 𝑧 10.44 13.45 Mean WTP [$] 19.013 95% confidence interval [$] 16.393∼21.634 Total Coefficient 1.735719b 0.0001116b 𝑧 11.84 16.12 Mean WTP [$] 17.014 95% confidence interval [$] 14.975∼19.054
aUnder 10% confidence level;bUnder 1% confidence level.
In this research, the most common reason why group 1 did not want to pay was that there was not enough informa-tion to decide. Therefore, it can be presumed that they make decisions very carefully, even if they have greater scientific background knowledge than the others. Group 2 believed that taxes already paid should be used to reduce the hazards of NPPs, and the zero bids from group 3 resulted from their opinion that the government and the nuclear operator made this problem on their own. It is interesting to note the minor-ity opinions. In group 1, the minorminor-ity opinion was that NPPs are fully safe. However, in groups 2 and 3, minority opinions involved distrust of the government and nuclear operators. They felt that the government would not use their taxes for proper purposes. Most of these reasons for zero bids make them protest bids rather than true bids. Therefore, as most were biased, the zero bids were removed from the final result analysis.
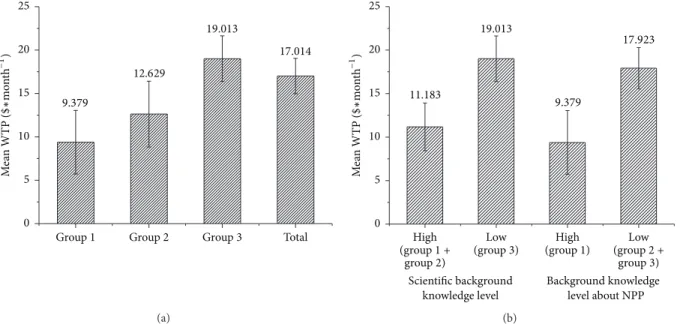
As expected, people who have a higher scientific back-ground level had a low mean WTP as verified in Table 4
1 2 3 4 5 9% 7% 7% 14% 63% (a) 1 2 3 4 5 2% 14% 24% 47% 13% (b) 4.35 3.79 2.79 3.04 3.7 2.88 2.51 2.66 0 1 2 3 4 5 P er cep tio n le ve l Image Safety Group1 Group2 Group3 Total (c)
Figure 2: (a) Image level responses from 1 = very bad image to 5 = very good image, (b) safety level responses from 1 = highly unsafe to 5 = highly safe, and (c) average levels of image and safety according to group.
and Figure 3(a). This data supports the idea that people who have low risk perception had lower WTP. Multiple studies have researched WTP amounts regarding NPPs with a range of results: $4.18/month [20], $10.56/month [26], and $23.85/month [27]. Considering this broad range of mean WTP stems from differing initial bids and applied models of research, the results shown in Figure 3(a) are reasonable.
The effects of the type of scientific knowledge, general or NPP-specific, were found by combining two groups and com-paring with the remaining group. By combining groups 1 and 2 and comparing it with group 3, the effect of general scientific knowledge can be analyzed. On the other hand, if groups 2 and 3 are combined, the effect of scientific knowledge about NPPs can be analyzed. Similar to the previous results,
the more scientific knowledge the respondents had, the lower the amount of money they wanted to pay, irrespective of the type of knowledge. However, as shown in Figure 3(b), the gap between the two types of scientific knowledge is different, at $7.83 and $8.54, respectively. Therefore, it can be said that specific knowledge has a slightly higher effect than that of general knowledge.
3.3.2. Mean WTP according to Image Level. In the case of image level, as shown in Figure 4(a), mean WTP roughly decreased with increasing image level. The solid line repre-sents the mean WTP of each image level, and the dotted line is a regression line. It can be said that the people who have
9.379 12.629 19.013 17.014 0 5 10 15 20 25 M ea n W TP ( $ ∗ mo n th −1 )
Group2 Group3 Total
Group1 (a) (group3) (group2 + group3) (group1) Scientific background knowledge level Background knowledge level about NPP 11.183 19.013 9.379 17.923 0 5 10 15 20 25 M ea n W TP ( $ ∗ mo n th −1 ) High
High Low Low
(group1 +
group2)
(b)
Figure 3: Mean WTP comparison according to (a) scientific knowledge level (group number) and (b) type of scientific knowledge (group number).
Mean WTP
Exponential fit of mean WTP 17.353 22.708 17.566 15.029 11.256 6 8 10 12 14 16 18 20 22 24 26 28 30 32 34 M ea n W TP ( $ ∗ mo n th −1) 2 3 4 5 1 Image (a) Mean WTP
Linear fit of mean WTP
2 3 4 5 1 Safety 18.921 22.313 14.962 11.049 27.521 5 10 15 20 25 30 35 40 45 50 M ea n W TP ( $ ∗ mo n th −1) (b)
Figure 4: (a) Mean WTP of each image level and its trend line with coefficient of determination (𝑅2) according to increasing image level. (b)
Mean WTP of each safety level and its trend line with coefficient of determination (𝑅2) according to increasing safety level.
a good image about NPPs tend to have a lower WTP than the people who have a bad image.
However, the results of image levels 1 and 2 are out of the regression range. This is believed to be due to the small sample size, as there were smaller samples of levels 1 and 2 than those of levels 4 and 5. Moreover, there were unusually large differences between the respondents’ bids in levels 1 and 2. For image 1, many respondents wanted to pay only a small amount of money (a quarter of the initial bid) while image 2 respondents wanted to pay a large amount of money (double the initial bid). Such variation can happen on a small scale on
account of each person’s different preferences. These differ-ences can be calibrated by a model with large sample sizes.
To find the best fit regression of the function between the image levels and mean WTP, various regression functions were applied, as shown in Table 5. The exponential function was able to describe the trend of mean WTP and image level quite well.
3.3.3. Mean WTP according to Safety Level. The mean WTP by safety level is shown in Figure 4(b). Results show no clear trend between safety level and mean WTP. Mean WTP
Table 5: Various regression lines of WTP and coefficient of determination (𝑅2) according to function type for image level and safety level.
Type Image level Safety level
Function 𝑅2 Function 𝑅2
Exponential 𝑦 = 24.003𝑒−0.128𝑥 0.6214 𝑦 = 17.807𝑒0.0047𝑥 0.0004
Linear 𝑦 = −1.9873𝑥 + 22.744 0.567 𝑦 = −2.9540𝑥 + 24.187 0.0216
Logarithm 𝑦 = −3.935 ln (𝑥) + 20.55 0.3591 𝑦 = 0.4809 ln (𝑥) + 18.492 0.0023
Power 𝑦 = 20.896𝑥−0.256 0.4019 𝑦 = 18.746𝑥−0.0.039 0.0049
roughly decreases according to increasing safety level. How-ever, there is a big outlier on level 5 which has a broad confidence interval because of the small sample size. This may be addressed with a large sample size.
As with the image level, the best fit regression function analysis is described in Table 5, although the coefficient of determination value (𝑅2) was too small for every function except linear. Although the linear function gave a relatively good description for the safety level case, 𝑅2 of the linear function was also quite small. Therefore, it can be said that safety level has no significant effect on mean WTP.
4. Conclusion
In this research, the factors which can affect WTP regarding NPP hazard reduction were investigated and the relationship between them and mean WTP was verified by using a specially designed questionnaire. Image level, safety level, and scientific background level were selected as the factors, with survey data analyzed by the CVM-DBDC model and pro-cessed by statistical software.
As a result, the people who have more scientific back-ground knowledge tended to have a good image about NPPs and thought that they are safe. Coincidently, their WTP was lower than the others’. In this analysis, the type of knowledge had a small effect on mean WTP. When mean WTP was analyzed according to image level, the trend was inversely proportional. That is, the people who have a better image on NPPs showed a lower WTP. It is natural to interpret this result by considering that the people who have a low image level might feel that they are being threatened by NPPs, so their WTP to reduce risk tends to be higher.
It is notable that in this research most of the zero bids were protest bids, and the reason for two-thirds of the zero bids was that the government and nuclear operator need to reduce NPP hazard by using paid taxes without outside help. Along with the minority opinions, this reason leads to the belief that mistrust of the government and the nuclear operator influenced why people chose “No” for the WTP questions. This may imply that the public’s distrust on authority might affect their preferences. If policy makers want to use WTP to assess the external costs of NPPs, this misbelief needs to be considered as one of the factors that can affect cost estimation. Following this study’s results, mean WTP can be esti-mated by using image and scientific background levels from existing data. In the case of residents near an NPP, there are many data which indicate their perception about NPPs. When compensation needs to be appropriated for them,
mean WTP from their image level can be used as a reference value and the compensation standard can be subdivided. This study shows that for NPP operators and builders, external costs can be reduced by supplying specific knowledge about NPPs.
This study can be improved in three ways. First of all, the effects of age can also be analyzed if the age range of target respondents is enlarged. In this research, as groups 1 and 2 were made up of students, group 3 needed to be restricted to a similar age range. Data from specialists and graduates are required to enlarge research targets from the 20s age range to all ages. For example, in future studies, if group 1 is composed of people working in research institutes instead of nuclear engineering students and group 2 is engineering graduates, then the analysis of all age groups will be possible. In addition, as researchers have more knowledge than students, they would be more proper for group 1. Secondly, this study utilized three out of nine elements to analyze the relation between risk perception and WTP. In future studies, other factors which affect risk perception need to be considered to discover the overall relationship between them and mean WTP. Finally, a bigger sample size is recommended for further studies to obtain clear trends in image level and to find the relationship between safety perception and mean WTP. A large sample size will also reduce the confidence interval of each level. Because of the broad confidence interval of image levels 1 and 2 and safety level 5, the coefficient of determina-tion was low and it was hard to find a fitting funcdetermina-tion.
Competing Interests
The authors declare that they have no competing interests.
Acknowledgments
This work was supported by the “Valuation and Socioeco-nomic Validity Analysis of Nuclear Power Plants In Low Carbon Energy Development Era” of the Korea Institute of Energy Technology Evaluation and Planning (KETEP), granted by the Ministry of Trade, Industry & Energy of the Republic of Korea. 20131520000040.
References
[1] U. Beck, Risk Society—Towards a New Modernity, Sage, Thou-sand Oaks, Calif, USA, 1992.
[2] S. H. Jin, “An analysis of cognition gap between nuclear experts and general citizen,” Korea Association for Policy Sciences, vol. 18, no. 4, pp. 149–173, 2014.
[3] K. S. Park, “Reexamination of nuclear safety legislation,”
Admin-istrative Law Journal, vol. 33, pp. 169–190, 2012.
[4] G. H. Heo, The Issue and Problem of Nuclear Power Plant’s Cost, National Assembly Budget Office, 2014.
[5] H. O. Cho and B. H. Kim, “Investigating the relative persua-siveness of different types of obesity-prevention advertisement,”
Korean Journal of Advertising, vol. 11, pp. 165–185, 2000.
[6] Y. J. Kang, “Comparison of risk governance between Korea and Germany,” ECO, vol. 17, no. 1, pp. 45–75, 2013.
[7] P. Slovic, “Perception of risk,” Science, vol. 236, no. 4799, pp. 280–285, 1987.
[8] O. Renn, Risk Governance: Towards an Integrative Approach, International Risk Governance Council (IRGC), Geneva, Switzerland, 2005.
[9] Nuclear Safety and Security Commission. Korea Institute of Nuclear Safety, Korea Institute of Nuclear Nonproliferation, and Control, 2012 Nuclear Safety Yearbook, 2013.
[10] E. O. Han, J. R. Kim, and Y. S. Choi, “Educational effects of radiation work-study activities for elementary, middle, and high school students,” Nuclear Engineering and Technology, vol. 46, no. 3, pp. 447–460, 2014.
[11] E. O. Han, J. R. Kim, and Y. S. Choi, “Korean students’ behavioral change toward nuclear power generation through education,”
Nuclear Engineering and Technology, vol. 46, no. 5, pp. 707–718,
2014.
[12] E. O. Han and B. S. Park, “Knowledges, consciousnesses, and attitudes of some university students on the use of radiations,”
Journal of Radiological Protection, vol. 30, no. 4, pp. 221–230,
2005.
[13] P. Slovic, B. Fischhoff, and S. Lichtenstein, “Behavioral decision theory perspectives on risk and safety,” Acta Psychologica, vol. 56, no. 1–3, pp. 183–203, 1984.
[14] P. Slovic, The Perception of Risk, Taylor & Francis, 2000. [15] A. Gafni, “Willingness to pay: what’s in a name?”
PharmacoEco-nomics, vol. 14, no. 5, pp. 465–470, 1998.
[16] K. Itaoka, A. Saito, A. Krupnick, W. Adamowicz, and T. Taniguchi, “The effect of risk characteristics on the willingness to pay for mortality risk reductions from electric power gener-ation,” Environmental & Resource Economics, vol. 33, no. 3, pp. 371–398, 2006.
[17] L. Huang, Z. Shao, W. Bao, B. Duan, J. Bi, and Z. Yuan, “The influencing factors of the WTP for the risk reduction of chem-ical industry accidents in China,” Frontiers of Environmental
Science & Engineering, vol. 6, no. 6, pp. 860–868, 2012.
[18] Y. J. Cha, “Model of risk perception and nuclear energy risk,”
Korea Association for Policy Sciences, vol. 21, no. 1, pp. 285–312,
2012.
[19] OECD Nuclear Energy Agency, Nuclear Electricity Generation:
What Are the External Costs? OECD/NEA, 2003.
[20] S. Jamieson, “Likert scales: how to (ab)use them,” Medical
Education, vol. 38, no. 12, pp. 1217–1218, 2004.
[21] C. H. Lee, M. S. Lee, G. J. Cho et al., External Costs of Nuclear
Energy in Korea, Korea Environment Institute, Seoul, Republic
of Korea, 2013.
[22] J. S. Park, S. C. Moon, and S. H. Yoo, Estimation of Social Value
of Network of Post Office Using CVM, Korea Information Society
Development Institute, 2011.
[23] M. J. Kealy and R. W. Turner, “A test of the equality of closed-ended and open-closed-ended contingent valuations,” American
Jour-nal of Agricultural Economics, vol. 75, no. 2, p. 321, 1993.
[24] W. M. Hanemann, “Welfare evaluations in contingent valuation experiments with discrete responses,” American Journal of
Agricultural Economics, vol. 66, no. 3, pp. 332–341, 1984.
[25] M. C. Thorne, “Actions to protect the public in an emergency due to severe conditions at a light water reactor: emergency preparedness and response report,” Journal of Radiological
Protection, vol. 33, no. 3, pp. 709–710, 2013.
[26] J. M. Halstead, A. E. Luloff, and T. H. Stevens, “Protest bidders in contingent valuation,” Northeastern Journal of Agricultural and
Resource Economics, vol. 21, no. 2, pp. 160–169, 1992.
[27] P. Zweifel, Y. Schneider, and C. Wyss, Spatial Effects in
Tribology
Advances in
Hindawi Publishing Corporation
http://www.hindawi.com Volume 2014
International Journal of
Aerospace
Engineering
Hindawi Publishing Corporationhttp://www.hindawi.com Volume 2014
Fuels
Journal ofHindawi Publishing Corporationhttp://www.hindawi.com Volume 2014
Journal of
Petroleum Engineering
Hindawi Publishing Corporation
http://www.hindawi.com Volume 2014
Industrial EngineeringJournal of
Hindawi Publishing Corporation
http://www.hindawi.com Volume 2014
Power Electronics
Hindawi Publishing Corporation
http://www.hindawi.com Volume 2014
Advances in
Combustion
Journal ofHindawi Publishing Corporation
http://www.hindawi.com Volume 2014
Journal of
Hindawi Publishing Corporation
http://www.hindawi.com Volume 2014
Renewable Energy
Submit your manuscripts at
http://www.hindawi.com
Hindawi Publishing Corporation
http://www.hindawi.com Volume 2014
Structures
Journal ofMachinery
Hindawi Publishing Corporation
http://www.hindawi.com Volume 2014 Hindawi Publishing Corporation
http://www.hindawi.com Volume 2014
Hindawi Publishing Corporation http://www.hindawi.com
Journal of
Engineering
Volume 2014
Hindawi Publishing Corporation
http://www.hindawi.com Volume 2014
International Journal of
Photoenergy
Hindawi Publishing Corporation
http://www.hindawi.com Volume 2014
Nuclear Installations
Science and Technology of
Hindawi Publishing Corporation
http://www.hindawi.com Volume 2014
Solar Energy
Journal ofHindawi Publishing Corporation
http://www.hindawi.com Volume 2014
Hindawi Publishing Corporation
http://www.hindawi.com Volume 2014
Nuclear Energy
International Journal ofHindawi Publishing Corporation
http://www.hindawi.com Volume 2014
High Energy PhysicsAdvances in
![Table 1: Basic demographics of respondents. Characteristics Observations [people] Percentage[%] Gender Male 118 52.68 Female 106 47.32 Education High school 7 14.07 College 199 73.24 Graduate school 18 12.69 Income [$/month] Below 500 123 54.91500–1000198.](https://thumb-ap.123doks.com/thumbv2/123dokinfo/5080619.74340/5.900.76.437.133.370/demographics-respondents-characteristics-observations-percentage-education-college-graduate.webp)