R E S E A R C H A R T I C L E
Open Access
Modifying effects of education on the
association between lifestyle behaviors and
the risk of obesity: evidence from South
Korea
Woojin Chung
1, Sunmi Lee
2, Seung-ji Lim
2and Jaeyeun Kim
2,3*Abstract
Background: No previous study has explored the interactions between education and lifestyle in relation to obesity. This study hypothesized that education may be obesogenic through its interplay with lifestyle behaviors.
Methods: Data for a nationally representative sample (6937 men and 9333 women) from the Korea National Health and Nutrition Examination Survey (2010–2012) were analyzed. Multivariate logistic regressions were performed for three education levels and six lifestyle behaviors, each of which comprised two groups.
Results: Interactions between education and lifestyle behaviors in relation to obesity were observed for all lifestyle behaviors in women (p for interaction <0.001) and for three lifestyle behaviors in men. Education appeared obesogenic for three groups of lifestyle behaviors in men (p for trend <0.05), but was protective against obesity for 11 groups in women. Each one-unit increase in education level in men increased the odds of obesity by 1.29-fold among under-reported energy intake groups (95 % confidence interval: 1.16, 1.44).
Conclusions: Education may be a risk factor for obesity through its interplay with lifestyle behaviors. Further research is required to examine these findings in different socio-cultural settings.
Keywords: Obesity, Education, Lifestyle behavior, Interaction, Sex, South Korea
Background
Obesity is becoming a serious global health issue. Obesity can lead to premature death due to coronary heart disease, high cholesterol, hypertension, diabetes, gallbladder dis-ease, or asthma, in addition to a decreased quality of life [1]. On a societal level, obesity can cause increased med-ical spending as well as decreased productivity in labor markets [2].
A number of studies, conducted from both academic and policy perspectives, have attempted to identify factors related to increased risk of obesity. Among them, many studies have paid special attention to the importance of lifestyle behaviors in relation to obesity [3–8]. Lifestyle
behaviors commonly recognized to favor health have been shown to reduce obesity risk [9]. Other studies have emphasized the role of increased education in lower-ing obesity risk. In general, higher levels of education are thought to have a protective effect against obesity [10, 11]. However, the other study have suggested that greater educational attainment have a obesogenic effect against obesity [12].
Unfortunately, no study to date has performed a multi-dimensional analysis of the associations between lifestyle behaviors and education in relation to obesity. This lack leaves studies of obesity far behind those of other health outcomes or of risk factors in exploring the interplay between or among various influencing factors [13, 14], and may also be a barrier to developing theories and designing appropriate policies for reducing obesity.
This study analyzed data for a nationally representative South Korean adult sample aged over 25 years, who had
* Correspondence:[email protected]
2
Health Insurance Policy Research Institute, National Health Insurance Service, 32 Geongang-ro, Wonju-si, Gangwon-do 26464, Republic of Korea
3Department of Public Health, Graduate School, Yonsei University, 50-1
Yonsei-ro, Seodaemun-gu, Seoul 03722, Republic of Korea Full list of author information is available at the end of the article
© The Author(s). 2016 Open Access This article is distributed under the terms of the Creative Commons Attribution 4.0 International License (http://creativecommons.org/licenses/by/4.0/), which permits unrestricted use, distribution, and reproduction in any medium, provided you give appropriate credit to the original author(s) and the source, provide a link to the Creative Commons license, and indicate if changes were made. The Creative Commons Public Domain Dedication waiver (http://creativecommons.org/publicdomain/zero/1.0/) applies to the data made available in this article, unless otherwise stated.
most likely completed their education, in order to inves-tigate the interaction between education level and six types of lifestyle behaviors, i.e., smoking, drinking alco-hol, physical exercise activity, daily sleep duration, daily energy intake, and level of stress in relation to obesity. This study postulated that education level might modify the association between lifestyle behaviors and obesity. It was also hypothesized that through its interplays with lifestyle behaviors, education might exert a protective ef-fect against obesity in regard to certain lifestyle behav-iors, but might also have an obesogenic effect in regard to other lifestyle behaviors.
Methods
Study population
This study used data from the Fifth Korea National Health and Nutrition Examination Survey (KNHANES V, 2010–2012), conducted by the Korea Centers for Dis-ease Control and Prevention [15]. Representative data on the non-institutionalized, general population of South Korea were collected through a stratified, multistage prob-ability sampling design. To assure an equal probprob-ability of be-ing sampled, weightbe-ings were assigned to each respondent.
Of 25,534 (8958, 8518, and 8058 in 2010, 2011, and 2012, respectively) randomly selected individuals, 24,173 were interviewed. Of these, 17,534 individuals aged 25 years or more were chosen for this study because they had most likely already completed their education [10]. Fi-nally, this study analyzed 16,270 (92.8 %) participants (6937 men and 9333 women) with complete information.
Measures
The body mass index for every participant was calcu-lated based on height and body weight measured during the physical examination. According to the guidelines proposed by the World Health Organization indicating that Asians have a lower average body mass index [16], this study defined obesity as a body mass index of 25 or higher.
Education level, defined as the highest level of formal education completed as of the interview date, comprised three levels: junior high school or less (≤9 years of edu-cation), senior high school (10–12 years of eduedu-cation), and college or higher (≥ 13 years of education). This study examined six lifestyle behaviors: smoking, drinking alcohol, physical exercise activity, daily sleep duration, daily energy intake, and level of stress. Each lifestyle be-havior was categorized into two groups as follows: current smoking status (smoking or non-smoking); risk from drinking alcohol (no or low risk, or, medium or higher risk, according to the sex-specific guidelines of the World Health Organization for risk of acute problems from drinking alcohol) [17]; physical exercise activity (active or inactive, where inactive was defined as the lack of
participation in either moderate-intensity physical exercise activity for at least 30 min at a time per day for at least 5 days per week or vigorous-intensity physical exercise ac-tivity for at least 20 min at a time per day for at least 3 days per week [18]; daily sleep duration (short or long, ac-cording to whether a participant sleeps for 7 or more hours per day); daily energy intake (under-reported or not under-reported); and the level of stress (stressful or not stressful). Thus, a total of 12 groups of lifestyle be-haviors were considered. Daily energy intake was obtained from 24-hour dietary recalls and a 63-item, open-ended food frequency questionnaire composed of foods that were regarded as key sources of energy for our population [19]. Energy intake was categorized as“under-reported” if it was lower than the estimated energy requirement obtained from the Institute of Medicine’s predictive equations [20, 21].
The analysis incorporated a variety of potential con-founders: sex (male or female), age (25–44, 45–54, 55–64, or 65 years and older), marital status (married or non-married), residential area (urban or rural), employment status (employed or unemployed), and income (below me-dian income, or meme-dian income or higher). Non-married included never married, separated, widowed, or divorced. An equivalized household income was used to adjust for household size. A chronic disease variable was included for participants with hypertension, dyslipidemia, and dia-betes mellitus at the time of the survey. Variables indicat-ing survey year were included to control for time-fixed effects. For each multivariate model focusing on the asso-ciation of education level and each lifestyle behavior with obesity, the remaining lifestyle behaviors were added as potential confounders.
Statistical analysis
Each lifestyle behavior for each sex was compared across education levels usingχ2tests. The estimated prevalence of obesity for each group of a lifestyle behavior was com-pared across education levels for each sex, usingχ2tests. Before examining the hypothesis that education level modifies the association between lifestyle behaviors and obesity, this study first examined whether the association between each lifestyle behavior and obesity differed be-tween men and women by constructing a simple logistic regression model with an interaction term between sex and each lifestyle behavior in relation to obesity. Because the p-values for all of the interaction terms were highly significant (p for interaction <0.001), the remaining ana-lyses were performed separately for each sex.
This study then examined the hypothesis using both unadjusted and adjusted models. For the former, the inter-action terms between education and each lifestyle be-havior were fitted in the logistic regression models without any potential confounders. For the latter, the
logistic regression models were adjusted for all studied confounders, where potential multicollinearity between independent variables was not a concern because the variance inflation factors ranged between 1.0 and 3.6.
The adjusted odds ratios (ORs) of obesity and 95 % confidence intervals (CIs) were estimated for the inter-action terms between education and each lifestyle behavior. The significance of the interaction terms were examined separately for each combination of lifestyle behavior groups and education level, and jointly for all combinations. In the case of significance jointly considering all combinations, the null hypothesis was that the interaction terms in the regression models were all equal to zero. In doing so, this study could test whether education level modi-fied the association between each lifestyle behavior and obesity after adjusting for all studied confounders.
In addition, using the education variable in its continu-ous form ranging from 1 to 3 (junior high school or less = 1, senior high school = 2, and college or higher = 3), the education trend effect for each lifestyle behavior in rela-tion to obesity was estimated separately for each group of lifestyle behaviors, after adjusting for all studied con-founders. In examining the significance of the interaction terms between education and each group of lifestyle be-havior, this study could test whether education level obesogenically or protectively modified the association between each group of lifestyle behaviors and obesity. Finally, the interactions were fully illustrated on a graph, plotting the ORs of obesity calculated for each combin-ation of educcombin-ation level and a group of lifestyle behaviors relative to their referent (Additional file 1).
All analyses were conducted considering the complex survey design, and the statistical significance was set at an alpha level of 0.05. To examine the significance of interaction terms, this study used the Wald test to adjust for the design effect, rather than a likelihood ratio test, because estimation procedures of logistic regression adjusting for the design effect use quasi-likelihoods rather than true likelihoods. Data were analyzed using SAS 9.2 (SAS Institute, Cary, NC, USA) and STATA 12 software (StataCorp, College Station, TX, USA).
Results
Participant characteristics and obesity prevalence
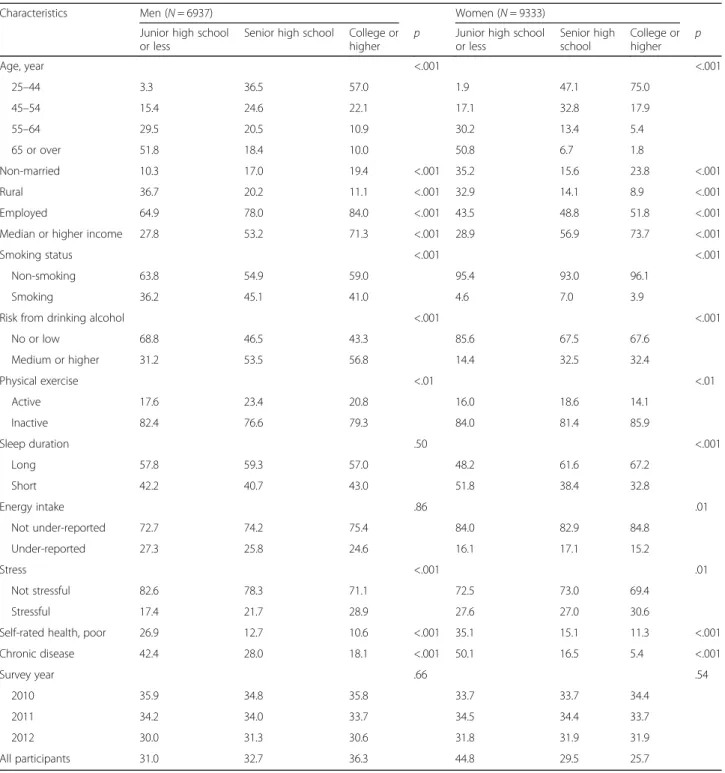
The overall prevalence of obesity was 37.5 % (standard error, 0.8) in men and 30.2 % (0.7) in women with a sig-nificant difference between sexes (p < .001). Table 1 shows that the participant characteristics were differen-tially distributed across education levels for each sex, ex-cept for sleep duration (p = .50), energy intake (p = .86) and survey year (p = .66) in men and survey year (p = .54) in women.
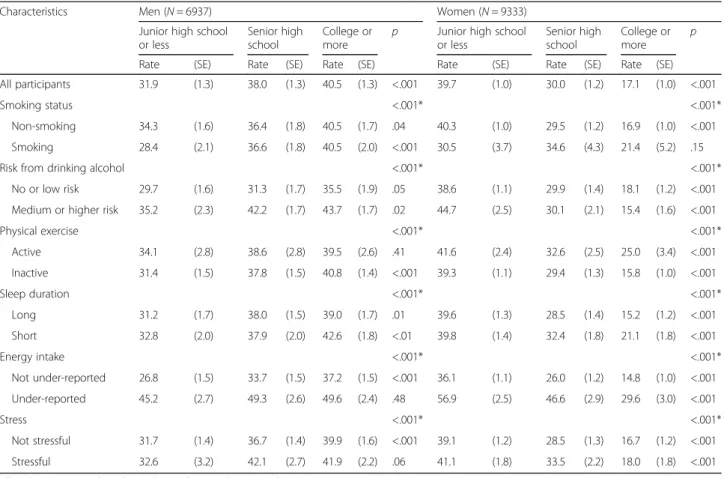
Table 2 shows that the obesity prevalence differed across education levels for each sex. In addition, the
obesity prevalence for each group of lifestyle behaviors varied across education levels except for no- or low-risk from drinking alcohol (p = .05), active physical exercise (p = .41), under-reporting of energy intake (p = .48) and being stressed (p = .06) in men and smoking (p = .15) in women.
Interaction between education and each lifestyle behavior in relation to obesity
Table 2 shows the results of the Wald tests of interaction terms between education and each lifestyle behavior in relation to obesity, without adjusting for potential con-founders. The interaction terms were highly significant both in men and women (p for interaction < .001), which suggests that, before adjustment, education level modi-fied the association between each lifestyle behavior and obesity both in men and in women.
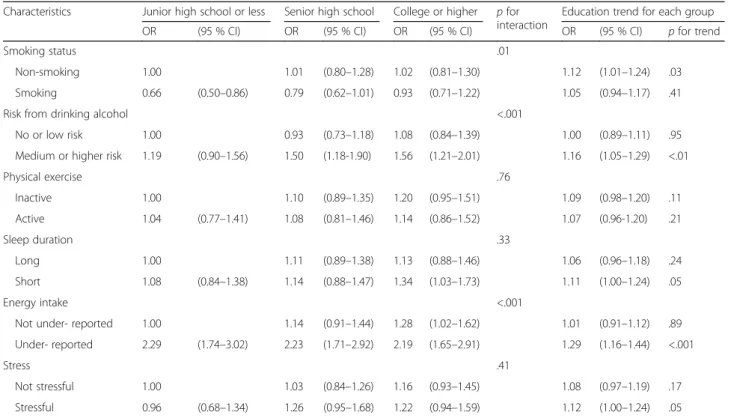
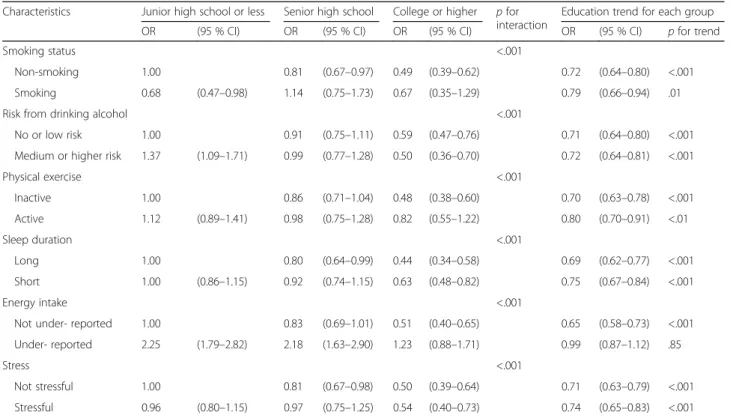
The results after adjustments are shown in Table 3 for men and Table 4 for women. In men, interaction terms between education and each lifestyle behavior in rela-tion to obesity were jointly significant for smoking sta-tus (p for interaction = .01), risk from drinking alcohol (p for interaction < .001), and energy intake (p for inter-action < .001). In contrast, education in women interacted significantly with all six lifestyle behaviors in relation to obesity (p for interaction < .001).
Education trend effect for each lifestyle behavior: protective or obesogenic?
Analysis of the interaction terms between education level and each lifestyle behavior, where education level was in its continuous form, are shown in Table 3 for men and Table 4 for women. In men, interaction terms with the continuous form of education level were signifi-cantly positive in three of the 12 groups of lifestyle behav-iors (non-smoking, medium or higher risk from drinking alcohol, and under-reporting of energy intake). For each one-unit increase education level, the odds of obesity increased by 1.29-fold in the group with under-reported energy intake (95 % CI: 1.16, 1.44) and by 1.12-fold in the non-smoking group (95 % CI: 1.01, 1.24). These findings suggest that education may be obesogenic in men through its interplay with a certain group of life-style behaviors, including non-smoking, medium or higher risk from drinking alcohol, and under-reporting of energy intake.
In contrast, except under-reporting of energy intake, the interaction terms between the continuous form of education level and each group of lifestyle behaviors in women were significantly negative. For example, for each one-unit increase in education level, the odds of obesity diminished by 0.69-fold in those who slept for 7 h or more per night (95 % CI: 0.62, 0.77) and by 0.71-fold in those with no or low risk from drinking alcohol
(95 % CI: 0.64, 0.80). These findings suggest that educa-tion appears to have a protective effect against obesity in women through its interplay with every group of life-style behaviors, except for under-reporting of energy intake.
Discussion
The findings of this study suggest that education level may modify the association between lifestyle behaviors and obesity in a nationally representative sample of adults in South Korea. Before adjustment, models revealed that
Table 1 Distribution (%) of study sample characteristics according to educational level and sex: Korea National Health and Nutrition Examination Survey, 2010–2012
Characteristics Men (N = 6937) Women (N = 9333)
Junior high school or less
Senior high school College or higher
p Junior high school
or less Senior high school College or higher p Age, year <.001 <.001 25–44 3.3 36.5 57.0 1.9 47.1 75.0 45–54 15.4 24.6 22.1 17.1 32.8 17.9 55–64 29.5 20.5 10.9 30.2 13.4 5.4 65 or over 51.8 18.4 10.0 50.8 6.7 1.8 Non-married 10.3 17.0 19.4 <.001 35.2 15.6 23.8 <.001 Rural 36.7 20.2 11.1 <.001 32.9 14.1 8.9 <.001 Employed 64.9 78.0 84.0 <.001 43.5 48.8 51.8 <.001
Median or higher income 27.8 53.2 71.3 <.001 28.9 56.9 73.7 <.001
Smoking status <.001 <.001
Non-smoking 63.8 54.9 59.0 95.4 93.0 96.1
Smoking 36.2 45.1 41.0 4.6 7.0 3.9
Risk from drinking alcohol <.001 <.001
No or low 68.8 46.5 43.3 85.6 67.5 67.6 Medium or higher 31.2 53.5 56.8 14.4 32.5 32.4 Physical exercise <.01 <.01 Active 17.6 23.4 20.8 16.0 18.6 14.1 Inactive 82.4 76.6 79.3 84.0 81.4 85.9 Sleep duration .50 <.001 Long 57.8 59.3 57.0 48.2 61.6 67.2 Short 42.2 40.7 43.0 51.8 38.4 32.8 Energy intake .86 .01 Not under-reported 72.7 74.2 75.4 84.0 82.9 84.8 Under-reported 27.3 25.8 24.6 16.1 17.1 15.2 Stress <.001 .01 Not stressful 82.6 78.3 71.1 72.5 73.0 69.4 Stressful 17.4 21.7 28.9 27.6 27.0 30.6
Self-rated health, poor 26.9 12.7 10.6 <.001 35.1 15.1 11.3 <.001
Chronic disease 42.4 28.0 18.1 <.001 50.1 16.5 5.4 <.001 Survey year .66 .54 2010 35.9 34.8 35.8 33.7 33.7 34.4 2011 34.2 34.0 33.7 34.5 34.4 33.7 2012 30.0 31.3 30.6 31.8 31.9 31.9 All participants 31.0 32.7 36.3 44.8 29.5 25.7
For the sake of brevity, the descriptive statistics were shown as % and unweighted P-values were obtained by the χ2 test considering the complex survey design N number, Obesity body mass index ≥25
education level was an effect modifier in both men and women for all lifestyle behaviors. In adjusted models, the results differed between men and women. In men, education level was an effect modifier for three lifestyle behaviors: smoking status, risk from drinking alcohol, and energy intake. In contrast, in women, the modify-ing effects of education were observed in each of the six lifestyle behaviors assessed in this study. Based on these findings, it appears that the modifying effects of education level on the associations between lifestyle be-haviors and obesity depends on both sex and lifestyle behavior.
This study also reports that education may have an obesogenic, protective, or no effect at all on obesity, de-pending on sex and lifestyle behavior. In men, education appears to have an obesogenic effect through its interplay with three groups of lifestyle behaviors: non-smoking, medium or higher risk from drinking alcohol, and under-reporting of energy intake. However, education appears to have no effect on obesity in the remaining nine groups of lifestyle behaviors. In contrast, education appears to have a protective effect against obesity in women, through its
interplay with 11 of the 12 groups of lifestyle behaviors. However, education had no effect on obesity through its interplay with a group of under-reporting of energy intake.
Comparisons to previous studies
Previous studies of associations of lifestyle behaviors and education level with obesity have mainly focused on main effects [22, 23]. With respect to the relationship between lifestyle behaviors and obesity, many studies suggest that individual lifestyles may influence obesity risk, in a way that unhealthy lifestyle behaviors increase obesity risk, though the effects may differ by sex. These lifestyle behav-iors include smoking [4, 24]; drinking alcohol [5, 25]; leisure-time physical activity [6, 26]; sleep duration [7, 27]; energy intake [8, 28]; and psychosocial stress [3, 29].
A great deal of attention has been paid to the relation-ship between education level and obesity. These studies could be categorized into several groups according to a level of socioeconomic development and sex [22, 23]. In societies with high levels of socioeconomic development, the relationship between education and obesity in men
Table 2 Obesity prevalence rate (%) by educational level and sex: Korea National Health and Nutrition Examination Survey, 2010–2012
Characteristics Men (N = 6937) Women (N = 9333)
Junior high school or less
Senior high school
College or
more p
Junior high school or less
Senior high school
College or
more p
Rate (SE) Rate (SE) Rate (SE) Rate (SE) Rate (SE) Rate (SE)
All participants 31.9 (1.3) 38.0 (1.3) 40.5 (1.3) <.001 39.7 (1.0) 30.0 (1.2) 17.1 (1.0) <.001
Smoking status <.001* <.001*
Non-smoking 34.3 (1.6) 36.4 (1.8) 40.5 (1.7) .04 40.3 (1.0) 29.5 (1.2) 16.9 (1.0) <.001
Smoking 28.4 (2.1) 36.6 (1.8) 40.5 (2.0) <.001 30.5 (3.7) 34.6 (4.3) 21.4 (5.2) .15
Risk from drinking alcohol <.001* <.001*
No or low risk 29.7 (1.6) 31.3 (1.7) 35.5 (1.9) .05 38.6 (1.1) 29.9 (1.4) 18.1 (1.2) <.001
Medium or higher risk 35.2 (2.3) 42.2 (1.7) 43.7 (1.7) .02 44.7 (2.5) 30.1 (2.1) 15.4 (1.6) <.001
Physical exercise <.001* <.001* Active 34.1 (2.8) 38.6 (2.8) 39.5 (2.6) .41 41.6 (2.4) 32.6 (2.5) 25.0 (3.4) <.001 Inactive 31.4 (1.5) 37.8 (1.5) 40.8 (1.4) <.001 39.3 (1.1) 29.4 (1.3) 15.8 (1.0) <.001 Sleep duration <.001* <.001* Long 31.2 (1.7) 38.0 (1.5) 39.0 (1.7) .01 39.6 (1.3) 28.5 (1.4) 15.2 (1.2) <.001 Short 32.8 (2.0) 37.9 (2.0) 42.6 (1.8) <.01 39.8 (1.4) 32.4 (1.8) 21.1 (1.8) <.001 Energy intake <.001* <.001* Not under-reported 26.8 (1.5) 33.7 (1.5) 37.2 (1.5) <.001 36.1 (1.1) 26.0 (1.2) 14.8 (1.0) <.001 Under-reported 45.2 (2.7) 49.3 (2.6) 49.6 (2.4) .48 56.9 (2.5) 46.6 (2.9) 29.6 (3.0) <.001 Stress <.001* <.001* Not stressful 31.7 (1.4) 36.7 (1.4) 39.9 (1.6) <.001 39.1 (1.2) 28.5 (1.3) 16.7 (1.2) <.001 Stressful 32.6 (3.2) 42.1 (2.7) 41.9 (2.2) .06 41.1 (1.8) 33.5 (2.2) 18.0 (1.8) <.001
All analyses were conducted considering the complex survey design P-values were obtained by the χ2 test
N number, SE standard error, Obesity body mass index ≥25
*P-values were obtained by the Wald test for the interaction terms between education and each lifestyle behavior fitted in the logistic regression models without any potential confounders
has been mostly reported as nonsignificant; however, this relationship in women has been observed as mostly negative, according to a study performed in Luxembourg [11]. In societies with medium levels of development, the relationship is largely nonsignificant or positive in men, but mainly negative in women [30, 31]. Finally, in societies with low levels of development, the relationship appears to be positive in both men and women [32].
To date, no studies of obesity have assessed the modi-fying effect of education on the associations between lifestyle behaviors and obesity. Previous studies have ex-amined the role of education as an effect modifier in the association of wealth or occupation with obesity only in women in developing countries. For example, analysis of a sample of women of reproductive age showed that edu-cation protected against the obesogenic effect of wealth in Egypt [33]. Another study examined the interaction between education and wealth on obesity in women aged 15–49 years in low- and middle-income countries [34]. While no effect was observed in three countries (India, Nigeria, and Benin), an interaction was found in four countries (Colombia, Peru, Jordan, and Egypt). In these countries, wealth was associated with increased
obesity risk in women with primary education or less, whereas it either decreased or did not influence obesity risk in women with higher levels of education.
Another study of women aged 60 years or more in four provinces in China provided evidence of the inter-action between education and occupation on abdominal obesity. In women with no education, the odds of ab-dominal obesity in the sedentary occupation group were more than double compared to those of the agricultural occupation group, despite the lack of evidence for such a relationship among women with any education [35].
Plausible mechanisms
Several potential reasons may explain the finding that education level may modify the association between life-style behaviors and obesity. First, it is possible that a for-ward causal link exists between or among three variables; i.e., education level, lifestyle behavior, and obesity, such that higher levels of education predict a healthy lifestyle behavior, which in turn predicts reduced obesity [36]. Second, there might be a reverse causal link such that being obese may cause an unhealthy lifestyle behavior, thereby resulting in a lower education level [10]. Third,
Table 3 Interaction effect of education and each lifestyle behavior on obesity in men (N = 6937): Korea National Health and Nutrition Examination Survey, 2010–2012
Characteristics Junior high school or less Senior high school College or higher p for interaction
Education trend for each group
OR (95 % CI) OR (95 % CI) OR (95 % CI) OR (95 % CI) p for trend
Smoking status .01
Non-smoking 1.00 1.01 (0.80–1.28) 1.02 (0.81–1.30) 1.12 (1.01–1.24) .03
Smoking 0.66 (0.50–0.86) 0.79 (0.62–1.01) 0.93 (0.71–1.22) 1.05 (0.94–1.17) .41
Risk from drinking alcohol <.001
No or low risk 1.00 0.93 (0.73–1.18) 1.08 (0.84–1.39) 1.00 (0.89–1.11) .95
Medium or higher risk 1.19 (0.90–1.56) 1.50 (1.18-1.90) 1.56 (1.21–2.01) 1.16 (1.05–1.29) <.01
Physical exercise .76 Inactive 1.00 1.10 (0.89–1.35) 1.20 (0.95–1.51) 1.09 (0.98–1.20) .11 Active 1.04 (0.77–1.41) 1.08 (0.81–1.46) 1.14 (0.86–1.52) 1.07 (0.96-1.20) .21 Sleep duration .33 Long 1.00 1.11 (0.89–1.38) 1.13 (0.88–1.46) 1.06 (0.96–1.18) .24 Short 1.08 (0.84–1.38) 1.14 (0.88–1.47) 1.34 (1.03–1.73) 1.11 (1.00–1.24) .05 Energy intake <.001
Not under- reported 1.00 1.14 (0.91–1.44) 1.28 (1.02–1.62) 1.01 (0.91–1.12) .89
Under- reported 2.29 (1.74–3.02) 2.23 (1.71–2.92) 2.19 (1.65–2.91) 1.29 (1.16–1.44) <.001
Stress .41
Not stressful 1.00 1.03 (0.84–1.26) 1.16 (0.93–1.45) 1.08 (0.97–1.19) .17
Stressful 0.96 (0.68–1.34) 1.26 (0.95–1.68) 1.22 (0.94–1.59) 1.12 (1.00–1.24) .05
All analyses were conducted considering the complex survey design P value was obtained by the Wald test
All estimates for all the interaction terms between education each health behavior were obtained from the multivariate logistic regression models, adjusted for age, marital status, residential area, employment status, equivalized household income, self-rated health, chronic disease, survey year, and the other lifestyle behaviors
notwithstanding the three variables, a fourth variable such as peer group, taste, and genetics might be associated with at least one of these three variables. Fourth, an individual may seek not only to have better health but also to con-sume more goods for personal enjoyment [36]. For ex-ample, if a lifestyle behavior, which tends to increase obesity risk, allows an individual to earn more, and thus consume more goods, the individual might prefer such lifestyle behaviors to others that may protect against obesity. Finally, higher education may lead to increased knowledge on nutrition, which has been previously shown to be associated with lower body mass index and lower rates of obesity [37, 38]. Moreover, knowledge on nutrition could explain the observed sex differences, as women may be more health conscious than men, irrespective of their education. This is especially true in regard to certain un-healthy behaviors, such as overeating and smoking [39, 40]. If we consider these five potential reasons collectively, a cross-sectional, two-way association between education level, a lifestyle behavior, or obesity may reflect a complex set of multi-faceted interactions between or among educa-tion level, lifestyle behaviors, obesity, and various fourth variables. As a result, depending on demographic group,
time, and society, education may be obesogenic, be pro-tective against obesity, or exert no effect at all, in the association between lifestyle behaviors and obesity. In particular, sex-based differences in the modifying effect of education may derive from sex-based differences in unobserved fourth variables. In countries undergoing rapid socioeconomic transitions, such as China, India, and South Korea [41], cultural or religious norms are likely to impose higher costs for obesity on women than on men in both the labor and marriage markets [42, 43].
Public health implications
To the best of our knowledge, this is the first study to report a multi-dimensional analysis of the associations between education and lifestyle behaviors in relation to obesity. Though caution is necessary when making pol-icy suggestions based on findings from cross-sectional data, the findings of the current study suggest that in-creased education may reduce, increase, or have no ef-fect on obesity risk based on the interplay with various lifestyle behaviors, depending on sex.
Increased education in women could protect against obesity through its interplays with most lifestyle behaviors
Table 4 Interaction effect of education and each lifestyle behavior on obesity in women (N = 9333): Korea National Health and Nutrition Examination Survey, 2010–2012
Characteristics Junior high school or less Senior high school College or higher p for interaction
Education trend for each group
OR (95 % CI) OR (95 % CI) OR (95 % CI) OR (95 % CI) p for trend
Smoking status <.001
Non-smoking 1.00 0.81 (0.67–0.97) 0.49 (0.39–0.62) 0.72 (0.64–0.80) <.001
Smoking 0.68 (0.47–0.98) 1.14 (0.75–1.73) 0.67 (0.35–1.29) 0.79 (0.66–0.94) .01
Risk from drinking alcohol <.001
No or low risk 1.00 0.91 (0.75–1.11) 0.59 (0.47–0.76) 0.71 (0.64–0.80) <.001
Medium or higher risk 1.37 (1.09–1.71) 0.99 (0.77–1.28) 0.50 (0.36–0.70) 0.72 (0.64–0.81) <.001
Physical exercise <.001 Inactive 1.00 0.86 (0.71–1.04) 0.48 (0.38–0.60) 0.70 (0.63–0.78) <.001 Active 1.12 (0.89–1.41) 0.98 (0.75–1.28) 0.82 (0.55–1.22) 0.80 (0.70–0.91) <.01 Sleep duration <.001 Long 1.00 0.80 (0.64–0.99) 0.44 (0.34–0.58) 0.69 (0.62–0.77) <.001 Short 1.00 (0.86–1.15) 0.92 (0.74–1.15) 0.63 (0.48–0.82) 0.75 (0.67–0.84) <.001 Energy intake <.001
Not under- reported 1.00 0.83 (0.69–1.01) 0.51 (0.40–0.65) 0.65 (0.58–0.73) <.001
Under- reported 2.25 (1.79–2.82) 2.18 (1.63–2.90) 1.23 (0.88–1.71) 0.99 (0.87–1.12) .85
Stress <.001
Not stressful 1.00 0.81 (0.67–0.98) 0.50 (0.39–0.64) 0.71 (0.63–0.79) <.001
Stressful 0.96 (0.80–1.15) 0.97 (0.75–1.25) 0.54 (0.40–0.73) 0.74 (0.65–0.83) <.001
All analyses were conducted considering the complex survey design P value was obtained by the Wald test
All estimates for all the interaction terms between education each health behavior were obtained from the multivariate logistic regression models, adjusted for age, marital status, residential area, employment status, equivalized household income, self-rated health, chronic disease, survey year, and the other lifestyle behaviors
except for under-reporting of energy intake, whereas in-creased education in men could be obesogenic through its interplays with non-smoking, medium or higher risk from drinking alcohol, and under-reporting of energy intake. This study offers empirical evidence to support studies that have cautioned against unintended consequences of obesity reduction programs through enhanced education [44].
Strengths and limitations
This study assessed data from sample of nationally rep-resentative South Korean adults. The sample provided abundant information about anthropometric measures, socio-demographic status, lifestyle behaviors, psychological factors, and diagnosed diseases. The sample also provided detailed information on energy intake. Above all, this study is the first to address the modifying effects of education on the associations between various lifestyle behaviors and obesity.
This study has several limitations. The cross-sectional study design does not allow causal inference to be made about the relationships among education level, lifestyle behaviors, and obesity. Moreover, this study may be sub-ject to a selection bias due to the choice of education level. Some information based on self-reporting could lead to measurement errors and recall bias. Certain charac-teristics, such as social network, parental obesity status, tastes, genetics, and diet quality, were omitted because of data limitations.
Conclusion
In summary, depending on lifestyle behaviors and sex, education level may modify the association between life-style behaviors and the risk of obesity. In South Korea, education appears to offer protection against obesity in women through its interplay with most lifestyle behav-iors except for under-reporting of energy intake. In con-trast, education appears to work obesogenically in men through its interplay with certain lifestyle behaviors. This is the first study to explore the importance of interac-tions between education level and lifestyle behaviors in relation to obesity. Future research on increasing adipos-ity levels should consider complex interactions between or among education level, lifestyle behaviors, obesity, and various fourth variables as well as examine the dif-ferences in these interactions according to a level of so-cioeconomic development and sex.
Additional file
Additional file 1: Figure S1. Interaction effect of education and each lifestyle behavior on obesity in men and in women: Korea National Health and Nutrition Examination Survey, 2010–12 (DOCX 81 kb)
Abbreviations
CIs:95 % confidence intervals; ORs: Adjusted odds ratios
Acknowledgements
The authors thank Drs. Stefano Petti, Luis Pereira-da-Silva and Stefano Marventano for their invaluable comments. They also thank Professors Mark Mongomery, Warren Sanderson, Han Joong Kim, and Woo Hyun Cho for their encouragements.
Funding
There was no funding source. Availability of data and materials
Detailed information on the survey design and characteristics are provided at https://knhanes.cdc.go.kr.
Authors’ contributions
W. Chung conceptualized, designed, and supervised the study; performed the statistical analysis; and led the writing. J. Kim assisted with the data analysis. All authors contributed to writing the article. All authors read and approved the final manuscript.
Competing interests
The authors declare that they have no competing interests. Consent for publication
Not applicable.
Ethics approval and consent to participate
All KNHANES participants provided written consent to participate in the survey and for their personal data to be used. This study used publicly available data, and ethical approval was given by the institutional review board of Yonsei University Graduate School of Public Health, Seoul, Korea (IRB No. 2-1040939-AB-N-01-2016-157).
Author details
1Department of Health Policy, Graduate School of Public Health, Institute of
Health Services Research, Yonsei University, 50-1 Yonsei-ro, Seodaemun-gu, Seoul 03722, Republic of Korea.2Health Insurance Policy Research Institute,
National Health Insurance Service, 32 Geongang-ro, Wonju-si, Gangwon-do 26464, Republic of Korea.3Department of Public Health, Graduate School,
Yonsei University, 50-1 Yonsei-ro, Seodaemun-gu, Seoul 03722, Republic of Korea.
Received: 19 August 2016 Accepted: 15 October 2016
References
1. McTigue K, Larson JC, Valoski A, Burke G, Kotchen J, Lewis CE, Stefanick ML, Van Horn L, Kuller L. Mortality and cardiac and vascular outcomes in extremely obese women. JAMA. 2006;296(1):79–86.
2. Andreyeva T, Sturm R, Ringel JS. Moderate and severe obesity have large differences in health care costs. Obes Res. 2004;12(12):1936–43. 3. Isasi CR, Parrinello CM, Jung MM, Carnethon MR, Birnbaum-Weitzman O,
Espinoza RA, Penedo FJ, Perreira KM, Schneiderman N, Sotres-Alvarez D, et al. Psychosocial stress is associated with obesity and diet quality in Hispanic/Latino adults. Ann Epidemiol. 2015;25(2):84–9.
4. Dare S, Mackay DF, Pell JP. Relationship between smoking and obesity: a cross-sectional study of 499,504 middle-aged adults in the UK general population. PLoS One. 2015;10(4):e0123579.
5. Shelton NJ, Knott CS. Association between alcohol calorie intake and overweight and obesity in English adults. Am J Public Health. 2014;104(4):629–31. 6. Gomez LM, Hernandez-Prado B, Morales Mdel C, Shamah-Levy T. Physical
activity and overweight/obesity in adult Mexican population: the Mexican national health and nutrition survey 2006. Salud Publica Mex. 2009;51 Suppl 4:S621–629.
7. Meyer KA, Wall MM, Larson NI, Laska MN, Neumark-Sztainer D. Sleep duration and BMI in a sample of young adults. Obesity (Silver Spring). 2012;20(6):1279–87.
8. Hill JO, Wyatt HR, Peters JC. Energy balance and obesity. Circulation. 2012;126(1):126–32.
9. Lantz PM, Golberstein E, House JS, Morenoff J. Socioeconomic and behavioral risk factors for mortality in a national 19-year prospective study of U.S. adults. Soc Sci Med. 2010;70(10):1558–66.
10. Cutler D, Lleras-Muney A. Education and health: evaluating theories and evidence. Cambridge: National Bureau of Economic Research; 2006. 11. Tchicaya A, Lorentz N. Socioeconomic inequality and obesity prevalence
trends in Luxembourg, 1995-2007. BMC Res Notes. 2012;5:467. 12. Fernald LC. Socio-economic status and body mass index in low-income
Mexican adults. Soc Sci Med. 2007;64(10):2030–42.
13. Robinson JC, Wyatt SB, Dubbert PM, May W, Sims M. The impact of neighborhood on physical activity in the Jackson heart study. Prev Med. 2016;90:216–22.
14. Prada D, Colicino E, Power MC, Weisskopf MG, Zhong J, Hou L, Spiro Iii A, Vokonas P, Brenan K, Herrera LA, et al. APOEε4 allele modifies the association of lead exposure with age-related cognitive decline in older individuals. Environ Res. 2016;151:101–5.
15. The Fifth Korea National Health and Nutrition Examination Survey (KNHANES V), 2010–2012 [http://knhanes.cdc.go.kr]
16. International Association for the Study of Obesity Task Force. The Asia-Pacific perspective: redefining obesity and its treatment. Sydney: World Health Organization Western Pacific Region; 2000.
17. World Health Organization. International guide for monitoring alcohol consumption and related harm. Geneva: World Health Organization; 2000. 18. Haskell WL, Lee IM, Pate R, Powell KE, Blair SN, Franklin BA, Macera CA,
Heath GW, Thompson PD, Bauman A. Physical activity and public health: updated recommendation for adults from the American College of Sports Medicine and the American Heart Association. Med Sci Sports Exerc. 2007;39(8):1423–34.
19. Kweon S, Kim Y, Jang M-j, Kim Y, Kim K, Choi S, Chun C, Khang Y-H, Oh K. Data resource profile: the Korea national health and nutrition examination survey (KNHANES). Int J Epidemiol. 2014;43(1):69–77.
20. Institute of Medicine. Report of the panel on macronutrients: dietary reference intakes for energy, carbohydrate, fiber, Fat, fatty acids, cholesterol, protein, and amino acids (macronutrients). Washington D.C: The National Academies Press; 2005.
21. FAO/WHO/UNU. Energy and protein requirements. In: Technical report series No 724. Geneva: World Health Organization; 2007.
22. Sobal J, Stunkard AJ. Socioeconomic status and obesity: a review of the literature. Psychol Bull. 1989;105(2):260–75.
23. Dinsa GD, Goryakin Y, Fumagalli E, Suhrcke M. Obesity and socioeconomic status in developing countries: a systematic review. Obes Rev. 2012;13(11):1067–79. 24. Plurphanswat N, Rodu B. The association of smoking and demographic characteristics on body mass index and obesity among adults in the U.S., 1999-2012. BMC Obesity. 2014;1:18.
25. Colditz GA, Giovannucci E, Rimm EB, Stampfer MJ, Rosner B, Speizer FE, Gordis E, Willett WC. Alcohol intake in relation to diet and obesity in women and men. Am J Clin Nutr. 1991;54(1):49–55.
26. Bernstein MS, Costanza MC, Morabia A. Association of physical activity intensity levels with overweight and obesity in a population-based sample of adults. Prev Med. 2004;38(1):94–104.
27. Magee CA, Iverson DC, Caputi P. Sleep duration and obesity in middle-aged Australian adults. Obesity (Silver Spring). 2010;18(2):420–1.
28. Abbot JM, Thomson CA, Ranger Moore J, Teixeira PJ, Lohman TG, Taren DL, Cussler E, Going SB, Houtkooper LB. Psychosocial and behavioral profile and predictors of self-reported energy underreporting in obese middle-aged women. J Am Diet Assoc. 2008;108(1):114–9.
29. Fowler-Brown AG, Bennett GG, Goodman MS, Wee CC, Corbie-Smith GM, James SA. Psychosocial stress and 13-year BMI change among blacks: the Pitt county study. Obesity (Silver Spring). 2009;17(11):2106–9.
30. Yoon YS, Oh SW, Park HS. Socioeconomic status in relation to obesity and abdominal obesity in Korean adults: a focus on sex differences. Obesity. 2006;14(5):909–19.
31. Pei L, Cheng Y, Kang Y, Yuan S, Yan H. Association of obesity with socioeconomic status among adults of ages 18 to 80 years in rural Northwest China. BMC Public Health. 2015;15:160.
32. Nematy M, Sakhdari A, Ahmadi-Moghaddam P, Aliabadi M, Kimiagar M, Ilaty A, Azimi-Nezhad M, Shakeri M, Ghayour-Mobarhan M, Sahebkar A. Prevalence of obesity and its association with socioeconomic factors in elderly Iranians from Razavi-Khorasan province. Sci World J. 2009;9:1286–93. 33. Aitsi Selmi A, Chandola T, Friel S, Nouraei R, Shipley MJ, Marmot MG.
Interaction between education and household wealth on the risk of obesity in women in Egypt. PLoS One. 2012;7(6):e39507.
34. Aitsi Selmi A, Bell R, Shipley MJ, Marmot MG. Education modifies the association of wealth with obesity in women in middle-income but not
low-income countries: an interaction study using seven national datasets, 2005-2010. PLoS One. 2014;9(3):e90403.
35. Aitsi-Selmi A, Chen R, Shipley M, Marmot M. Education is associated with lower levels of abdominal obesity in women with a non-agricultural occupation: an interaction study using China’s four provinces survey. BMC Public Health. 2013;13(1):769.
36. Grossman M: On the concept of health capital and the demand for health. J. Polit. Econ. 1972:223-255
37. Grosso G, Mistretta A, Turconi G, Cena H, Roggi C, Galvano F. Nutrition knowledge and other determinants of food intake and lifestyle habits in children and young adolescents living in a rural area of Sicily, South Italy. Public Health Nutr. 2013;16(10):1827–36.
38. De Vriendt T, Matthys C, Verbeke W, Pynaert I, De Henauw S. Determinants of nutrition knowledge in young and middle-aged Belgian women and the association with their dietary behaviour. Appetite. 2009;52(3):788–92. 39. Jones AM, Zidenberg-Cherr S. Exploring nutrition education resources and
barriers, and nutrition knowledge in teachers in California. J Nutr Educ Behav. 2015;47(2):162–9.
40. McLeod ER, Campbell KJ, Hesketh KD. Nutrition knowledge: a mediator between socioeconomic position and diet quality in Australian first-time mothers. J Am Diet Assoc. 2011;111(5):696–704.
41. Das Gupta M, Zhenghua J, Bohua L, Zhenming X, Chung W, Bae HO. Why is son preference so persistent in east and south Asia? A cross-country study of China, India and the Republic of Korea. J Dev Stud. 2003;40(2):153–87. 42. Mukhopadhyay S. Do women value marriage more? The effect of obesity
on cohabitation and marriage in the USA. Rev Econ Househ. 2008;6(2):111–26. 43. Morris S. The impact of obesity on employment. Labour Econ.
2007;14(3):413–33.
44. Huang TT, Cawley JH, Ashe M, Costa SA, Frerichs LM, Zwicker L, Rivera JA, Levy D, Hammond RA, Lambert EV, et al. Mobilisation of public support for policy actions to prevent obesity. Lancet (London, England). 2015;385(9985):2422–31.
• We accept pre-submission inquiries
• Our selector tool helps you to find the most relevant journal • We provide round the clock customer support
• Convenient online submission • Thorough peer review
• Inclusion in PubMed and all major indexing services • Maximum visibility for your research
Submit your manuscript at www.biomedcentral.com/submit