ARTICLE
Haplotype structure and association to Crohn’s disease
of CARD15 mutations in two ethnically divergent
populations
Peter JP Croucher
1, Silvia Mascheretti
1, Jochen Hampe
1, Klaus Huse
2, Henning Frenzel
1,
Monika Stoll
1, Tim Lu
1, Susanna Nikolaus
1, Suk-Kyun Yang
3, Michael Krawczak
4,
Won Ho Kim
5and Stefan Schreiber*
,11
1st Department of Medicine, Christian-Albrechts-University, Kiel, Germany;
2Institute for Molecular Biotechnology,
Beutenberg Strasse 11, 07745 Jena, Germany;
3Department of Internal Medicine, University of Ulsan College of
Medicine, Asan Medical Center, Seoul, Korea;
4Institue for Medical Informatics and Statistics,
Christian-Albrechts-University, Kiel, Germany;
5Department of Internal Medicine, Yonsei University College of Medicine, Seoul, Korea
Current debate focuses on the relevance of linkage disequilibrium (LD), ethnicity and underlying
haplotype structure to the search for genes involved in complex disorders. The recently described
association between single nucleotide polymorphisms (SNPs) of the CARD15 (NOD2) gene and Crohn’s
disease (CD) in populations of north-European descent provides a test case that we have subjected to
detailed SNP haplotype based analyses. We examined 23 SNPs spanning 290 kb, including CARD15, in
large North-European and Korean samples of patients with Crohn’s disease and normal controls. In
Europeans we confirmed that the three disease-associated SNPs occur independently but share a
common background haplotype. This suggests a common origin and the possibility of an undiscovered
more strongly predisposing mutation. Korean CD patients present a phenotype identical to the European
patients and have not previously been screened for CARD15. The three disease-associated SNPs were
absent and there was no evidence of association between CARD15 and CD. Consequently, the
disease-associated mutations in the Europeans, which are rare, have arisen recently (after the Asian – European
split). Our results highlight important issues relevant to mapping the genes that predispose to complex
disorders. First, although ethnically divergent populations may present identical phenotypes they do not
necessarily share the same set of predisposing genes. Second, although single-locus tests of association
showed consistent association with markers throughout the gene, pair-wise LD between markers (r
2and
D’) yielded very little information about actual disease-association. Third, a population comparative
approach allowed refining of the marker set through the examination of shared polymorphisms and
common LD-groups. This approach, in conjunction with the examination of the mutational steps in a
haplotype network, allows unambiguous identification of the potentially causative mutations.
European Journal of Human Genetics (2003) 11, 6 – 16. doi:10.1038/sj.ejhg.5200897
Keywords: Crohn’s disease; CARD15; haplotype analysis; SNP
Introduction
Considerable attention is currently being focused on the genotyping of single-nucleotide polymorphisms (SNPs), and on their utility for linkage disequilibrium (LD) mapping studies that hope to identify susceptibility genes for complex diseases. In the context of LD mapping, it would be important to identify regions of conserved LD
Received 19 April 2002; revised 22 August 2002; accepted 26 August 2002 *Correspondence: Professor Stefan Schreiber; 1st Department of Medi-cine, Christian-Albrechts-Universita¨t Kiel, Schittenhelmstrasse 12, D-24105 Kiel, Germany. Tel: +49-431-597-2350; Fax: +49-431-597-1842; E-mail: [email protected]
or, alternatively, of high recombination and gene conver-sion throughout the human genome. One goal here is to detect the common haplotypes such that the number of SNPs that need to be genotyped for a gene mapping study can be reduced.1,2,3 – 5However, not only do recombination rates vary greatly across the genome6 but differences in population history and structure cause the extent of LD and mutational load at different genes to be population specific.1,2,4,7Furthermore, in the case of complex diseases –
where many loci may confer susceptibility – ethnically divergent populations may exhibit the same phenotype but this phenotype may not necessarily be caused by the same set of susceptibility loci. This assumption has been largely hypothetical; the recently described association of Crohn’s disease with CARD15 provides an ideal test case.
Crohn’s disease (CD; MIM 2666600) and ulcerative colitis (UC; MIM 191390) represent the two major forms of inflammatory bowel disease (IBD; MIM 601458). These diseases are characterized by chronic relapsing inflamma-tion of the gastrointestinal tract.8,9The prevalence of IBD in some western countries is as high as 0.5%.10,11 Consis-tent evidence for familial clustering,12 an increased concordance of the IBD phenotype in monozygotic twins13,14 and consistently positive results from genetic
linkage studies have repeatedly confirmed the involvement of complex genetic factors in the etiology of these condi-tions.
Genome-wide linkage analyses have detected several susceptibility regions on different chromosomes and the linkage region on chromosome 16, IBD1.15 This has been
replicated in several independent Caucasian popula-tions.16 – 25 Recently, mutations in the leucine rich region (LRR) of the CARD15 (NOD2) (MIM 605956) gene on chro-mosome 16q12 have been discovered. These mutations are strongly associated with CD in populations of European descent.26 – 28
CARD15 is a member of the APAF-1/CED-4 family of genes. Genes from this family show some structural simila-rities to plant NOD resistance genes, and have been implicated in pro-inflammatory cytokine induction and apoptosis pathways involving TNFa and NFkB, with CARD15 exhibiting monocyte-specific expression.28,29 Pre-liminary functional evidence has suggested that the LRR regions of CARD15 may play a role in the response to bacterial lipopolysaccharides by altering the activation of NFkB.28,30 However, the exact functional and molecular
role of CARD15 in the immune response remains unclear.31
Three mutations in the LRR have been implicated in CD. Two of these, C14772T (R702W) in exon 4 and G25386C (G908R) in exon 8 (labelled SNP8 and SNP12, by Hugot et al;27from here on referred to as o8 and o12) cause amino
acid substitutions. The insertion of a C in exon 11, 32629insC (1007insC) (labelled SNP13, here=o13) causes truncation of the protein. It has been suggested that the three mutations could alter activation of NFkB through
inefficient CARD15 dimerization or impaired recognition of microbial components.27,28
Hugot et al.27 indicated that the CARD15 mutations
never occur on the same chromosome and identified three haplotypes that show markedly distorted transmission in affected nuclear families. These three haplotypes are identi-cal except that each carries one of the three mutations. Although, the three mutations are present on other haplo-types these are too rare to allow detection of disease-association.
Three independent causative mutations occurring on the same haplotype background does not appear parsimonious and suggests that a further, truly causative or more strongly predisposing mutation may exist that is in some LD with the three LRR mutations. Presence of the haplotype carry-ing this unknown mutation would thus be a prerequisite for any other variation to be classified as disease-associated. It was decided, therefore, to perform a detailed study of the genetic variation in and around the entire CARD15 gene. The aim was twofold. First, to determine whether CARD15 confers susceptibility to CD in an ethnically and historically distinct Asian population – susceptibility that has previously been demonstrated for several populations of predominantly European descent. To this end, data from a South Korean cohort are presented and patterns of LD and underlying haplotype structure are compared between Europeans and Asians. Second, the possibility of a common mutation in LD with the previously described, putatively causative LRR mutations is explored.
Subjects and methods
Subjects
British families (75 CD-affected pedigrees containing 162 CD-affected individuals and 72 affected sib-pairs (ASPs)) and German families (144 CD-pedigrees; 265 CD-indivi-duals, 124 ASPs) were recruited by an international group of IBD investigators at the Charite´ University Hospital (Berlin, Germany), the Department of General Internal Medicine at Christian-Albrechts-University (Kiel, Germany), St Mark’s, Guy’s and King’s College Hospitals (London, UK) and other German centres. These cohorts have been described in previous studies.16,26 Additionally, German trios (307 patients with sporadic CD and two unaffected parents) were recruited. Normal controls (370 individuals) of German origin were obtained through the Department of Transfusion Medicine at the Kiel University Hospital. South Korean sporadic CD cases (126 individuals) and unre-lated healthy controls (116 individuals) were recruited at the Department of Internal Medicine, University of Ulsan College of Medicine, Asan Medical Center, Seoul and the Department of Internal Medicine, Yonsei University College of Medicine, Seoul.
The diagnosis of CD was confirmed by clinical, radio-logical and endoscopic (type of lesions, distribution) analyses.32,33 Additionally, histological findings had to be
confirmative or complementary with this diagnosis. The diagnosis in the Korean patients was additionally controlled by an observational visit from the Kiel group. EDTA blood was obtained from all study participants. Informed, written consent was obtained from all study participants and recruitment protocols were approved by ethics committees at participating centres before commencing the cohort assemblies.
Methods
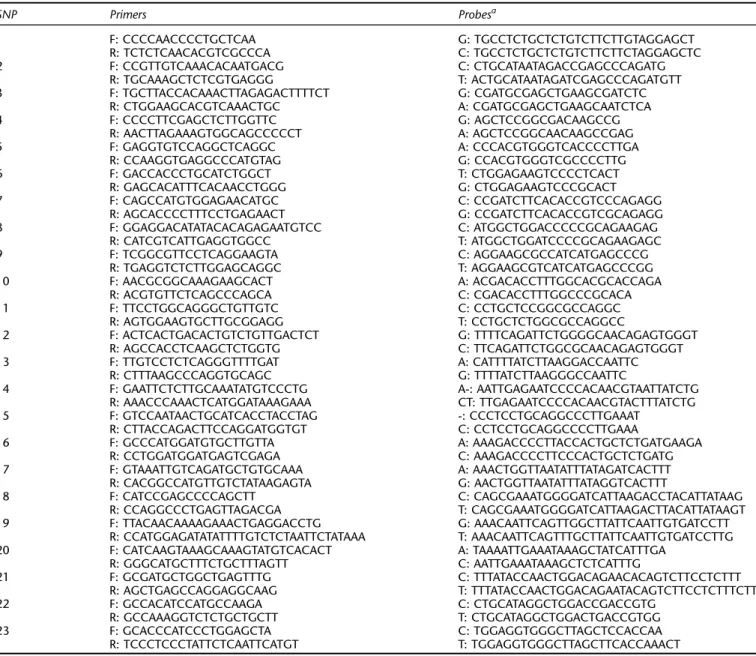
The CARD15 gene was screened for SNPs by genomic and cDNA resequencing in 47 IBD affected German patients (24 CD, 23 UC). Searching for new SNPs only in affected individuals maximizes the likelihood of finding disease associated mutations (however, we note that putative protective polymorphisms may be overlooked, on occasion, using this strategy). Mutation detection focused on the exons, exon – intron boundaries and on 1 kb regions flank-ing the gene at approximately 50, 100, 150 and 200 kb up and downstream of the ATG. Primers for PCR amplification were designed on the basis of GenBank sequences NT_027173 and XM_012541). In total, 23 polymorphisms are reported. These include those previously reported as associated with CD susceptibility (accession numbers to dbSNP: ss2978533, ss2978538, ss2978540-43, ss2992220-24, ss2992238-39, ss2992242, and ss4383587-95).
The SNPs were genotyped using Allelic Discrimination by Taqman Technology with an ABI 7700 Sequence Detector (Applera, Foster City, CA, USA) using the primers and probes as outlined in Table 1.
The same regions were screened for mutations in 47 Korean CD patients by genomic resequencing with geno-typing and confirmation of sequencing results using the Taqman assays established in the European samples.
The data were checked and managed by means of an integrated database system.34
Statistical analyses
Each marker was tested for Hardy – Weinberg equilibrium in the control populations using a w2 test. Genetic
analyses were then performed at several levels. To confirm the association with CD, each marker was first subjected to single-locus tests for linkage as follows. The UK families, German families and German trios were exam-ined for distorted transmission using the TRANSMIT program35,36 with significance levels verified using 1000
bootstrap replicates for each test. A case – control analysis was performed against unrelated controls on the Korean dataset, and also on the European data after randomly extracting a single affected offspring from each family or trio. In all analyses, the UK and German data were pooled into a single European cohort. The validity of such pool-ing was verified by comparpool-ing the allele frequencies at each marker in the random cases using w2 statistics or Fisher’s exact test, as appropriate (data not shown).
Geno-type-based odds ratios (OR) were calculated and association tested similarly.
Pair-wise LD between each marker pair was calculated as D=pij– pipj, where pijis the frequency of haplotype carrying
allele i at the first locus and allele j at the second locus, and piand pjare the frequencies of alleles i and j. This was
trans-formed into the two standardized LD coefficients, r2and D’.
Here, r is the allelic correlation coefficient given by D/ (pipj[1-pi][1-pj])1/2.37 D’ was computed as Dij/Dij,max, where
Dij,maxis the maximum LD possible for two markers with
allele frequencies piand pj, calculated as min (pipj, [1-pi
][1-pj]) if Dij 50 or min ([1-pi]pj, pi[1-pj]) if Dij 40.38
Haplotypes frequencies were estimated from phase-unknown and phase-known genotypic data using the Expectation Maximisation (EM) algorithm.39All individuals with incomplete genotypes were removed from the analy-sis. The haplotype frequency estimates from the EM algorithm were cross-checked against the European family and trio data, using the program GENEHUNTER 2.
The EM algorithm uses maximum likelihood approaches to estimate haplotype frequencies from partially phase-unknown genotypic data. Large numbers of markers gener-ate prohibitively intensive searches and therefore subsets of informative markers had to be selected. This choice was based both on the comparison of the two populations and the patterns of LD observed between the markers (see Results).
The null-hypothesis that there is no difference in overall estimated haplotype frequencies between cases and controls could be tested using a likelihood ratio test. However, esti-mated haplotype frequencies cannot be treated as observed data and therefore no valid statistical test exists for evaluat-ing the possible contribution of individual haplotypes to any deviation from this null-hypothesis. Consequently, a robust permutation test for haplotype association was performed. Pseudo-w2 statistics were calculated both for the overall
haplotype tables (global test) and the individual haplotypes in the tables. The significance of these statistics was evalu-ated by shuffling-together and repartitioning the case and control individuals, re-estimating the haplotype frequencies and then re-calculating the pseudo-w2statistics 10 000 times.
Evaluating the contribution of individual haplotypes is only strictly relevant if the null-hypothesis of no difference in overall estimated haplotype frequencies between cases and controls (the global test) is rejected; this evaluation does not represent a new statistical hypothesis and therefore correction for multiple-testing is not necessary.
The NETWORK 3.0 program was used to infer the likely genealogical history between the most frequent haplotypes using the Median – Joining (MJ) algorithm.40 In an MJ
network, circles represent distinct haplotypes and are scaled to reflect the frequency of these haplotypes. The branches connect the haplotypes and indicate the mutational steps between the haplotypes. The MJ network was generated for the set of European case and control haplotypes.
Results
CARD15 diversity at the nucleotide level
The CARD15 gene consists of 12 exons spanning 35.9 kb of genomic sequence and encoding an mRNA transcript of 4486 bp. All exons and exon – intron boundaries of the CARD15 gene, plus 1 kb regions flanking either side of the gene at 50, 100, 150 and 200 kb intervals, were screened in 47 patients (94 chromosomes) each, from both the European and Korean CD samples. In the European patients, a total of 23 SNPs, spanning 290 kb, were confirmed and genotyped, giving a mean density of one SNP per 12.6 kb (one SNP per 2.3 kb in the CARD15 coding
region). Only 10 of these SNPs were present in the Korean samples, and no additional variants were identified in this population. The absence of variants on sequencing was further confirmed using the TaqMan assays, previously established in the European population. Most notably absent were SNPs R702W, G908R, and 1007insC, which correspond to the disease-associated SNPs (o8, o12, o13) as outlined by Hugot et al.27Indeed, only two of the SNPs
described by Hugot et al.27 were present in the Korean
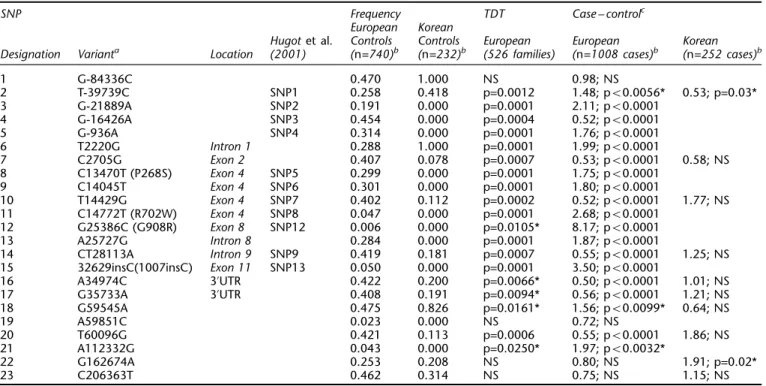
sample – SNPs 10 and 14 (o7 and o9). The SNPs with their positions, nomenclature, coding status and frequencies are summarized in Table 2.
Table 1 TaqMan assay primer and probe sets
SNP Primers Probesa 1 F: CCCCAACCCCTGCTCAA G: TGCCTCTGCTCTGTCTTCTTGTAGGAGCT R: TCTCTCAACACGTCGCCCA C: TGCCTCTGCTCTGTCTTCTTCTAGGAGCTC 2 F: CCGTTGTCAAACACAATGACG C: CTGCATAATAGACCGAGCCCAGATG R: TGCAAAGCTCTCGTGAGGG T: ACTGCATAATAGATCGAGCCCAGATGTT 3 F: TGCTTACCACAAACTTAGAGACTTTTCT G: CGATGCGAGCTGAAGCGATCTC R: CTGGAAGCACGTCAAACTGC A: CGATGCGAGCTGAAGCAATCTCA 4 F: CCCCTTCGAGCTCTTGGTTC G: AGCTCCGGCGACAAGCCG R: AACTTAGAAAGTGGCAGCCCCCT A: AGCTCCGGCAACAAGCCGAG 5 F: GAGGTGTCCAGGCTCAGGC A: CCCACGTGGGTCACCCCTTGA R: CCAAGGTGAGGCCCATGTAG G: CCACGTGGGTCGCCCCTTG 6 F: GACCACCCTGCATCTGGCT T: CTGGAGAAGTCCCCTCACT R: GAGCACATTTCACAACCTGGG G: CTGGAGAAGTCCCGCACT 7 F: CAGCCATGTGGAGAACATGC C: CCGATCTTCACACCGTCCCAGAGG R: AGCACCCCTTTCCTGAGAACT G: CCGATCTTCACACCGTCGCAGAGG 8 F: GGAGGACATATACACAGAGAATGTCC C: ATGGCTGGACCCCCGCAGAAGAG R: CATCGTCATTGAGGTGGCC T: ATGGCTGGATCCCCGCAGAAGAGC 9 F: TCGGCGTTCCTCAGGAAGTA C: AGGAAGCGCCATCATGAGCCCG R: TGAGGTCTCTTGGAGCAGGC T: AGGAAGCGTCATCATGAGCCCGG 10 F: AACGCGGCAAAGAAGCACT A: ACGACACCTTTGGCACGCACCAGA R: ACGTGTTCTCAGCCCAGCA C: CGACACCTTTGGCCCGCACA 11 F: TTCCTGGCAGGGCTGTTGTC C: CCTGCTCCGGCGCCAGGC R: AGTGGAAGTGCTTGCGGAGG T: CCTGCTCTGGCGCCAGGCC 12 F: ACTCACTGACACTGTCTGTTGACTCT G: TTTTCAGATTCTGGGGCAACAGAGTGGGT R: AGCCACCTCAAGCTCTGGTG C: TTCAGATTCTGGCGCAACAGAGTGGGT 13 F: TTGTCCTCTCAGGGTTTTGAT A: CATTTTATCTTAAGGACCAATTC R: CTTTAAGCCCAGGTGCAGC G: TTTTATCTTAAGGGCCAATTC
14 F: GAATTCTCTTGCAAATATGTCCCTG A-: AATTGAGAATCCCCACAACGTAATTATCTG
R: AAACCCAAACTCATGGATAAAGAAA CT: TTGAGAATCCCCACAACGTACTTTATCTG 15 F: GTCCAATAACTGCATCACCTACCTAG -: CCCTCCTGCAGGCCCTTGAAAT R: CTTACCAGACTTCCAGGATGGTGT C: CCTCCTGCAGGCCCCTTGAAA 16 F: GCCCATGGATGTGCTTGTTA A: AAAGACCCCTTACCACTGCTCTGATGAAGA R: CCTGGATGGATGAGTCGAGA C: AAAGACCCCTTCCCACTGCTCTGATG 17 F: GTAAATTGTCAGATGCTGTGCAAA A: AAACTGGTTAATATTTATAGATCACTTT R: CACGGCCATGTTGTCTATAAGAGTA G: AACTGGTTAATATTTATAGGTCACTTT 18 F: CATCCGAGCCCCAGCTT C: CAGCGAAATGGGGATCATTAAGACCTACATTATAAG R: CCAGGCCCTGAGTTAGACGA T: CAGCGAAATGGGGATCATTAAGACTTACATTATAAGT 19 F: TTACAACAAAAGAAACTGAGGACCTG G: AAACAATTCAGTTGGCTTATTCAATTGTGATCCTT R: CCATGGAGATATATTTTGTCTCTAATTCTATAAA T: AAACAATTCAGTTTGCTTATTCAATTGTGATCCTTG 20 F: CATCAAGTAAAGCAAAGTATGTCACACT A: TAAAATTGAAATAAAGCTATCATTTGA R: GGGCATGCTTTCTGCTTTAGTT C: AATTGAAATAAAGCTCTCATTTG 21 F: GCGATGCTGGCTGAGTTTG C: TTTATACCAACTGGACAGAACACAGTCTTCCTCTTT R: AGCTGAGCCAGGAGGCAAG T: TTTATACCAACTGGACAGAATACAGTCTTCCTCTTTCTT 22 F: GCCACATCCATGCCAAGA C: CTGCATAGGCTGGACCGACCGTG R: GCCAAAGGTCTCTGCTGCTT T: CTGCATAGGCTGGACTGACCGTGG 23 F: GCACCCATCCCTGGAGCTA C: TGGAGGTGGGCTTAGCTCCACCAA R: TCCCTCCCTATTCTCAATTCATGT T: TGGAGGTGGGCTTAGCTTCACCAAACT a
Table 2 also outlines the results of the single-locus tests of association for each SNP. In the European samples, the TDT and case – control results are complementary, with non-significant results obtained for the most distal flanking markers (SNPs 1, 22, 23) and also for SNP 19, but consis-tently significant association for all other markers within, or close to, the gene. In the Koreans, none of the markers exhibits any significant association to CD as assessed by a case – control design. Only SNP 2 and SNP 22 suggest marginal significance, which dissipates on correction for multiple testing and is not supported by two-marker haplo-type analysis (data not shown).
LD in CARD15
LD was studied between CD associated SNPs 1007insC, G908R and R702W (o13, o12, o8 respectively) and the remaining SNPs. These results (Figure 1) clearly highlight the problems inherent to LD metrics r2 and D’. According
to r2, SNPs 1007insC, G908R and R702W are not in linkage
disequilibrium with each other, nor with any other markers. The low r2 values most likely result from the low frequency of the rare allele of each SNP (see Table 2); r2 is known to be highly sensitive to skewed allele-frequen-cies.7,41 The values of D’ are, however, also problematic.
For many combinations, D’ values of 1.0 result and these again are mainly due to the low frequencies of SNPs 1007insC, G908R and R702W. By definition, the presence
of only three of four possible haplotypes results in D’ being equal to unity. Measures of marker – marker LD, as employed here, are therefore not helpful for deciding if rare disease-associated variants such as SNPs 1007insC, G908R and P268S (SNP8) are co-segregating with other (perhaps causative) mutations.
LD was also calculated between other pairs of markers. Figure 2 shows how D’ and r2values decrease with distance
between markers in the European samples. A value of r240.1 has been suggested as a criterion for meaningful LD7,42 whereas a cut-off of r240.5 is perhaps more useful for visualizing LD-groups.7 Examining Figure 2 from this
perspective suggests that useful LD in CARD15 declines sharply with distance and extends maximally to between 50 and 100 kb. Overall, LD in the European sample and the Korean sample appeared similar (mean pair-wise r2 between markers: European=0.18+0.03, Korean=0.24+ 0.09; mean pair-wise D’ between markers: European= 0.68+0.05, Korean=0.65+0.11).
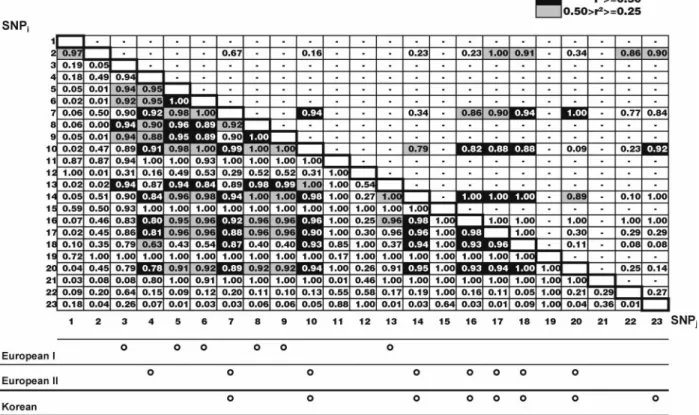
Figure 3 illustrates pair-wise LD between all marker pairs for the European (lower diagonal) and Korean (upper diag-onal) control populations. D’ values are explicitly presented whilst, r2 values 40.5 are indicated in black,
and r2values between 0.25 and 0.5 are highlighted in grey.
Following the methodology of Nakajima et al,7 r2 values
40.5 were used to identify LD-groups (Figure 3, bottom). With the exception of SNP2, all SNPs present in the Korean
Table 2 SNPs and association statistics in Europeans and Koreans
SNP Frequency TDT Case – controlc
European Korean
Hugot et al. Controls Controls European European Korean
Designation Varianta Location (2001) (n=740)b (n=232)b (526 families) (n=1008 cases)b (n=252 cases)b
1 G-84336C 0.470 1.000 NS 0.98; NS 2 T-39739C SNP1 0.258 0.418 p=0.0012 1.48; p50.0056* 0.53; p=0.03* 3 G-21889A SNP2 0.191 0.000 p=0.0001 2.11; p50.0001 4 G-16426A SNP3 0.454 0.000 p=0.0004 0.52; p50.0001 5 G-936A SNP4 0.314 0.000 p=0.0001 1.76; p50.0001 6 T2220G Intron 1 0.288 1.000 p=0.0001 1.99; p50.0001 7 C2705G Exon 2 0.407 0.078 p=0.0007 0.53; p50.0001 0.58; NS 8 C13470T (P268S) Exon 4 SNP5 0.299 0.000 p=0.0001 1.75; p50.0001 9 C14045T Exon 4 SNP6 0.301 0.000 p=0.0001 1.80; p50.0001 10 T14429G Exon 4 SNP7 0.402 0.112 p=0.0002 0.52; p50.0001 1.77; NS 11 C14772T (R702W) Exon 4 SNP8 0.047 0.000 p=0.0001 2.68; p50.0001 12 G25386C (G908R) Exon 8 SNP12 0.006 0.000 p=0.0105* 8.17; p50.0001 13 A25727G Intron 8 0.284 0.000 p=0.0001 1.87; p50.0001 14 CT28113A Intron 9 SNP9 0.419 0.181 p=0.0007 0.55; p50.0001 1.25; NS 15 32629insC(1007insC) Exon 11 SNP13 0.050 0.000 p=0.0001 3.50; p50.0001 16 A34974C 3’UTR 0.422 0.200 p=0.0066* 0.50; p50.0001 1.01; NS 17 G35733A 3’UTR 0.408 0.191 p=0.0094* 0.56; p50.0001 1.21; NS 18 G59545A 0.475 0.826 p=0.0161* 1.56; p50.0099* 0.64; NS 19 A59851C 0.023 0.000 NS 0.72; NS 20 T60096G 0.421 0.113 p=0.0006 0.55; p50.0001 1.86; NS 21 A112332G 0.043 0.000 p=0.0250* 1.97; p50.0032* 22 G162674A 0.253 0.208 NS 0.80; NS 1.91; p=0.02* 23 C206363T 0.462 0.314 NS 0.75; NS 1.15; NS
aVariant position counted from the A in the ATG initiator codon. bn=number of chromosomes.cGenotype odds-ratio precedes the P-value. *=Non-significant (NS) after Bonferroni correction for multiple testing. Dunn-Sˇida´k Pcritical=0.0022; 23 tests (European); Pcritical=0.0051; 10 tests (Korean).
controls fell into one LD-group. In the European sample, two LD-groups were apparent – one coinciding almost exactly with the Korean markers and one containing the other markers, except SNPs R702W G908R, 1007insC, 21, 1, 2, 22, 23 (the latter four, which are the most distal, showed little overall linkage disequilibrium with the other SNPs).
Haplotype analysis
Haplotypes were constructed using an EM algorithm with two sets of SNPs; those shared between Europeans and Koreans (set 1), and those exclusively found in Europeans (set 2). SNPs 1, 2, 22 and 23 were eliminated from the haplotype analysis on the grounds of too little LD. Only haplotypes with estimated frequencies greater than 1% in Figure 1 Pair-wise LD between 1007insC (A), G908R (B), and R702W (C) and other CARD15 SNPs. Both r2(dotted line, triangle) and D’
the combined cases and controls were considered. Haplo-type frequencies for SNP set 1 were analysed for a difference between cases and controls in both the Korean and European samples. The estimated haplotypes and corre-sponding statistics are given in Table 3. For both populations, the global permutation test indicated no asso-ciation with CD. Furthermore, and in agreement with this, no individual haplotypes indicated significant association with CD. Given the lack of association in either population for haplotypes inferred from the shared LD-group (SNP set 1), plus the lack of single point association for these SNPs in the Korean sample, it seems unlikely that any of these SNPs are directly involved in the aetiology of CD.
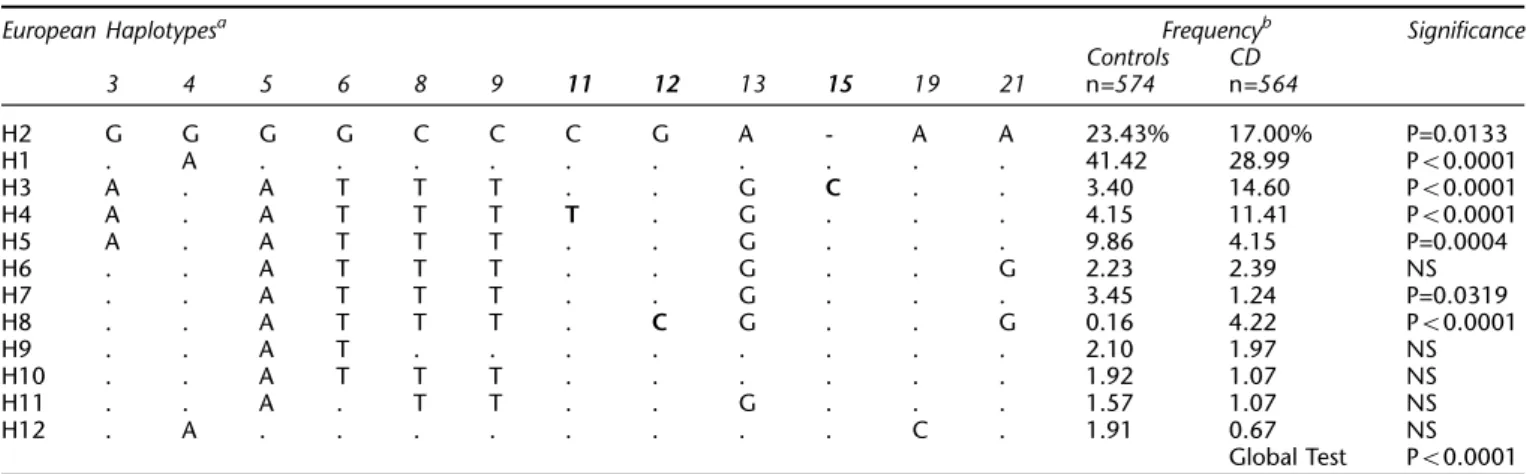
Haplotype frequencies were also estimated for the European case and control samples using only the markers unique to Europeans (set 2; Table 4). The global permuta-tion test was highly significant. Four haplotypes, designated H1, H2, H5 and H7, were negatively associated with CD (combined OR=0.295; Wald 95% CI=0.228 – 0.382; ORs are haplotype ORs derived from the estimated
haplotype frequencies). H2, the second most common haplotype, represents the Korean haplotype and is therefore probably ancestral. Three haplotypes, H3, H4, and H8, were positively associated with CD (H3: OR=4.857, Wald 95% CI=2.923 – 8.075; H4: OR=2.975, Wald 95% CI=1.831 – 4.834; H8: OR=27.493, Wald 95% CI=3.409 – 221.750). H3 carried the mutant form of SNP15 (o13, 1007insC), H4 carried SNP11 (o8, R702W) and H8 carried SNP12 (o12, G908R). Taken together these three haplotypes account for 30.2% of the chromosomes in the CD sample and only 7.7% of the chromosomes in the control sample. The over-all OR was 5.186 (Wald 95% CI=3.635 – 7.400).
Figure 4 shows the MJ network for the 12 most frequent haplotypes occurring in the European (set 2) combined case and control sample (92% of the chromosomes). The topol-ogy was identical if only the controls (or cases) were analysed. The squared box represents the ancestral haplo-type shared between the Korean and European population. The mutational steps (SNPs) between each node are marked and the nodes are scaled relative to the count of the haplotype. SNP3 was rejected from the analysis as uninformative due to homoplasy (recombination). This resulted in the identity of haplotypes H5 and H7 (indicated as H5 in Figure 4). Overall, the MJ network placed the haplotypes into two groups. The putatively ancestral haplo-type H2, shared between the Korean and European populations, along with the common H1 dominated one half of the network. Most other haplotypes, including all the positively and negatively associated haplotypes fell into a complex grouping distinct from these common haplo-types. If the mutational steps across the network are examined then it is apparent that the only mutations unique to the positively disease-associated haplotypes H3, H4 and H8 are SNPs 1007insC, R702W and G908R respec-tively. All other mutations are shared by other haplotypes not positively associated with CD (see Table 4). Therefore it seems unlikely that any of the SNPs examined, other than SNPs R702W, G908R and 1007insC, is strongly impli-cated in CD susceptibility.
Discussion
Although the exact nature of the molecular role of CARD15 (NOD2) in mediating the immune response remains unclear,31the fact that it is involved in inflammatory disor-ders seems unequivocal. Not only have mutations in the LRR of the CARD15 gene been repeatedly reported in asso-ciation with CD26 – 28but mutations in the nuclear binding
domain (NBD) have now been implicated in Blau syndrome (BS; MIM 186580),43another granulomatous disorder with histological similarities to sarcoidosis (MIM 181000). However, the NBD mutations appear to be restricted to familial BS and have not so far been observed in the general population.43
The results presented here illustrate a number of impor-tant points pertinent to the mapping and characterization Figure 2 Pair-wise LD and distance (kilobases) between 23
SNP markers in Europeans. LD declines sharply with increasing distance. (A) Absolute values of D’. (B) r2.
of disease genes, not only for CD but for complex disorders in general. The single locus tests of association for the European samples (Table 2) highlight that, given a suffi-ciently large sample, consistent association between CD and variation in the CARD15 gene can be detected through-out the length of the gene and in the surrounding area (in the case of CARD15 a region of around 100 kb). This result implies that in a well-designed experiment, one would be unlikely to overlook the association with CD. On the basis of association alone, however, it is impossible to ascertain which, if any, of the SNPs may be causative.
Measuring pair-wise LD between markers may also not be particularly informative. The values of D’ and r2 between SNPs R702W, G908R and 1007insC and all other SNPs yielded very little information about actual disease-associa-tion. For example, if association had initially been detected to SNP 3 during an SNP based genome scan, subsequent assessment of pair-wise LD using r2values would have failed to find linkage disequilibrium to SNP R702W, G908R and 1007insC. LD therefore, does not provide a short-cut; full genotyping of patients is required at each marker. As previously mentioned, the values of r2 may have been so
low because the predisposing mutations are rare. For similar reasons, D’ values often attain their maximum value of 1.0. This happens whenever one or more of the four possible Figure 3 Pair-wise LD of SNPs in CARD15 as measured by D’ (numbers) and r2(shading). Top diagonal: Korean. Bottom diagonal: European. LD-groups defined by markers with r2values 40.5 are illustrated below.
Table 3 Haplotypes from the shared SNP set 1.
Korean Haplotypesa Frequencyb Significance Controls CD 7 10 14 16 17 18 20 n=146 n=196 C T CT A G A T 79.37% 73.33% NS . G A – C A G G 5.41% 10.11% NS . . . G . 4.18% 3.13% NS G . A – C A G . 4.79% 2.00% NS . . . C A G . 1.38% 1.94% NS . G A – . A G G 0.00% 2.14% NS Global Test=NS European Haplotypesa Frequencyb Significance
Controls CD 7 10 14 16 17 18 20 n=146 n=196 C T CT A G A T 45.97% 56.50% NS G G A – C A G G 36.88% 23.54% NS . . . G . 8.01% 10.65% NS G G A – C . G G 1.60% 1.77% NS . . A – C A G G 1.75% 1.25% NS G . . . 1.05% 1.07% NS . . . G G 1.23% 0.74% NS Global Test=NS aIdentify with the most frequent haplotype is indicated by a period. b
Only haplotypes with estimated frequencies 41% in the combined case and controls are included.
haplotypes between two markers is absent. One reason that a marker allele may be rare is because it has arisen recently – this means that there has been no time for the fourth haplotype to appear. Hence D’ is not a sensitive measure of LD to recent and/or rare mutations.7
Allowing for the limitations given above, pair-wise measures of LD were quite high between all SNPs. Figure 3 illustrates how substantial LD in European CARD15 genes appears to extend between about 50 and 100 kb. This fits with the apparent average range of 60 kb ‘typical’ for genes in populations of northern European descent.1
Use of r2 revealed two LD-groups in the Europeans (excluding a number of apparently unlinked markers – notably the rare SNPs R702W, G908R, 1007insC and 19, and the distantly flanking markers). One LD-group reflected the set of SNPs and the LD-group observed in the Korean population, a result that makes intuitive sense. These markers were generally of moderate to high polymorphism and no doubt represent relatively ancient and ethnically shared variation. The ORs of less than 1.0 shown by most of these markers in the Europeans, in addition to the lack of single-point association with CD in the Korean popula-tion and the lack of associapopula-tion in both populapopula-tions at the haplotype level, argues strongly against their involve-ment in CD. This result demonstrates the value of a population comparative approach to identifying the causa-tive variations in susceptibility genes for complex disease.
The analysis of the European population using the set of markers not shared with the Koreans yielded few haplo-types. The results corroborated those of Hugot et al.27 in
that the three putatively causative mutations did not occur together on a single haplotype but shared a common back-ground haplotype. From these results, it is still not feasible to distinguish between causality of these mutations and of others on the same background haplotype. However, a genealogical network approach, placing the haplotypes into a network, allowed exclusion of all other markers except SNPs R702W, G908R and 1007insC as predisposing to CD. Consequently, from our set of 23 SNPs no evidence was found for a further causative variant that unites SNPs
Table 4 Final European haplotypes (SNP set 2)
European Haplotypesa Frequencyb Significance
Controls CD 3 4 5 6 8 9 11 12 13 15 19 21 n=574 n=564 H2 G G G G C C C G A - A A 23.43% 17.00% P=0.0133 H1 . A . . . 41.42 28.99 P50.0001 H3 A . A T T T . . G C . . 3.40 14.60 P50.0001 H4 A . A T T T T . G . . . 4.15 11.41 P50.0001 H5 A . A T T T . . G . . . 9.86 4.15 P=0.0004 H6 . . A T T T . . G . . G 2.23 2.39 NS H7 . . A T T T . . G . . . 3.45 1.24 P=0.0319 H8 . . A T T T . C G . . G 0.16 4.22 P50.0001 H9 . . A T . . . 2.10 1.97 NS H10 . . A T T T . . . 1.92 1.07 NS H11 . . A . T T . . G . . . 1.57 1.07 NS H12 . A . . . C . 1.91 0.67 NS Global Test P50.0001 a
Identity with the most putatively ancestral (reference)haplotype H2 is indicated by a period. Indel marked by a dash. Predisposing mutations in bold font.bOnly haplotypes with estimated frequencies 41% in the combined case and controls are included. Haplotypes numbered in order of decreasing overall frequency.
Figure 4 MJ network of the 12 most common haplotypes in the European case and control samples. Arrows link the unique haplotypes and indicate the mutational relationships between them. H5 includes H5 and H7. The size of a node is approxi-mately proportional to the frequency of that haplotype in the total sample (the most frequent haplotypes have been down-scaled for clarity). Mutational steps are indicated on the branches (variants numbered as in Table 2). The squared box indicates the shared ‘ancestral’ European and Korean haplotype.
R702W, G908R and 1007insC within a common back-ground haplotype. Therefore it is not possible to discount the argument that these three SNPs truly are the causative variants. However, it still appears plausible that such a variant may exist as yet undetected, perhaps in an upstream promoter element. Indeed, in an exhaustive re-sequencing of the CARD15 coding region of 457 CD patients, 159 UC patients and 103 unaffected unrelated individuals, Hugot et al27 found a large number of additional but extremely
rare missense variants that may also be associated to CD. If an unique causative variant remains to be discovered then the search may be targeted at individuals carrying the common background haplotype for SNPs R702W, G908R and 1007insC.
The fact that SNPs R702W, G908R and 1007insC are asso-ciated with a common background haplotype has probably been fortunate since the presence of several disease-predis-posing alleles within a susceptibility locus, each in association with a different background haplotype can seriously compromise the ability to locate the susceptibility locus by LD mapping.7,44 If the apparently causative SNPs R702W, G908R and 1007insC had not shared a common background haplotype then association may have been much harder to detect. The mutant alleles of all three mutations are rare (in the control sample 4.70, 0.60 and 5.00% respectively). If they had unconnected origins and resided on unrelated haplotypes then they may have obfus-cated each other in the single locus association tests. Although haplotype analyses would have resolved this, the likelihood of not observing the association to CARD15 in the first place would have been much greater.
The lack of disease-association of CARD15 in an Asian population which experiences CD of equivalent phenotype and incidence as the European population highlights the importance of ethnic comparisons in identifying the susceptibility genes for complex disorders. The combination of examining ethnically shared variants and genealogical reconstruction of haplotypes can be a powerful tool in narrowing the search for causative mutations.
Electronic-database information
Accession numbers and URLs for data in this article: GenBank, http://www.ncbi.nlm.nih.gov/Genbank; Online Mendelian Inheritance in Man (OMIM), http:// www.ncbi.nlm.nih.gov/Omim/ (for CD (MIM 2666600), for UC (MIM 191390), for IBD (MIM 601458), for BS (MIM 186580) and for CARD15 (MIM 605956)); dbSNP, http://www.ncbi.nlm.nih.gov/SNP/; NETWORK 3.0, http:// www.fluxus-engineering.com
Acknowledgements
The authors of this manuscript contributed as follows. PJP Croucher: experimental design, mutation detection, genotyping, principle analy-sis and draft of manuscript; S Mascheretti: experimental design,
mutation detection, genotyping; K Huse, H Frenzel: mutation detec-tion and sequencing; J Hampe, S Schreiber: experimental design, cohort assembly and clinical characterization, manuscript revision; M Krawczak, M Stoll, T Lu: statistical and computing assistance, manuscript revision; S Nikolaus, S-K Yang, WH Ko,: cohort assembly and clinical characterization. The authors particularly wish to thank Dr Christopher G Mathew (GKT School of Medicine, Guy’s Hospital London), Dr Andrew Macpherson (GKT School of Medicine, King’s College Hospital, London), and Dr John E Lennard-Jones (St. Mark’s Hospital, Harrow, UK) and Dr Jochen Grebe for their role in patient recruitment. Thank you also to the cooperating clinical centres, their physicians, the families and patients with IBD and the German Crohn’s and colitis foundation (DCCV e.V.) for support and partici-pation in this study. We especially our clinicians (Raedler, Kruis, Theuer, Meckler, Lochs, Wedel, Herrmann, Herchenbach, Scheurlen, Demharter, Simon, Purrmann, Jessen, Zehnter, Lu¨bke, Weismu¨ller, Eiche, Scho¨nfelder, Fleig, Wewalka, Knofloch, Hodgson, Sanderson, Pounder, Forgacs, Bird, Hines, Cairns, Ireland, Barrison and Smith-Lang). We acknowledge the expert technical help from, Anja Hassel-meyer, Tanja Wesse, Tam Ho Kim and Birte Ko¨pke and the rest of our technical staff. Grant support: Deutsche Forschungsgemeinschaft (For 423), an TMR Network grant of the European Union (ERB-4061-PL-97-0389), a competence network ‘Chronisch-entzu¨ndliche Darmerkrankungen’, the German Human Genome Project (DHGP) and the National Genome Research Network.
References
1 Reich DE, Cargill M, Bolk S et al: Linkage disequilibrium in the human genome. Nature 2001; 411: 199 – 204.
2 Stephens JC, Schneider JA, Tanguay DA et al: Haplotype variation and linkage disequilibrium in 313 human genes. Science 2001; 293: 489 – 493.
3 Patil N, Berno AJ, Hinds DA et al: Blocks of limited haplotype diversity revealed by high-resolution scanning of human chro-mosome 21. Science 2001; 294: 1719 – 1723.
4 Goldstein DB: Islands of linkage disequilibrium. Nat Genet 2001; 29: 109 – 111.
5 Johnson GC, Esposito L, Barratt BJ et al: Haplotype tagging for the identification of common disease genes. Nat Genet 2001; 29: 233 – 237.
6 Yu A, Zhao C, Fan Y et al: Comparison of human genetic and sequence-based physical maps. Nature 2001; 409: 951 – 953. 7 Nakajima T, Jorde LB, Ishigami T et al: Nucleotide diversity and
haplotype structure of the human angiotensinogen gene in two populations. Am J Hum Genet 2002; 70: 108 – 123.
8 Hamilton SR: The differential diagnosis of idiopathic inflamma-tory disease by colorectal biopsy. Int J Colorectal Dis 1987; 2: 113 – 117.
9 Podolsky DK: Inflammatory Bowel Disease. N Engl J Med 1991; 325: 928 – 937.
10 Shivananda S, Lennard Jones J, Logan R et al: Incidence of inflam-matory bowel disease across Europe: is there a difference between north and south? Results of the European Collaborative Study on Inflammatory Bowel Disease (EC-IBD). Gut 1996; 39: 690 – 697. 11 Probert CS, Jayanthi V, Rampton DS, Mayberry JF: Epidemiology
of inflammatory bowel disease in different ethnic and religious groups: limitations and aetiological clues. Int J Colorectal Dis 1996; 11: 25 – 28.
12 Orholm M, Munkholm P, Langholz E, Nielsen OH, Sorensen IA, Binder V: Familial occurrence of inflammatory bowel disease. N Engl J Med 1991; 324: 84 – 88.
13 Thompson NP, Driscoll R, Pounder RE, Wakefield AJ: Genetics versus environment in inflammatory bowel disease: results of a British twin study. BMJ 1996; 312: 95 – 96.
14 Tysk C, Lindberg E, Jarnerot G, Floderus Myrhed B: Ulcerative colitis and Crohn’s disease in an unselected population of mono-zygotic and dimono-zygotic twins. A study of heritability and the influence of smoking. Gut 1988; 29: 990 – 996.
15 Hugot JP, Laurentpuig P, Gower-Rousseau C et al: Mapping of a susceptibility locus for Crohn’s disease on chromosome 16. Nature 1996; 379: 821 – 823.
16 Curran ME, Lau KF, Hampe J et al: Genetic analysis of inflamma-tory bowel disease in a large European cohort supports linkage to chromosomes 12 and 16. Gastroenterology 1998; 115: 1066 – 1071. 17 Brant SR, Fu Y, Fields CT et al: American families with Crohn’s disease have strong evidence for linkage to chromosome 16 but not chromosome 12. Gastroenterology 1998; 115: 1056 – 1061. 18 Annese V, Latiano A, Bovio P et al: Genetic analysis in Italian
families with inflammatory bowel disease supports linkage to the IBD1 locus-a GISC study. Eur J Hum Genet 1999; 7: 567 – 573. 19 Cavanaugh J, Consortium TIIG: International collaboration provides convincing linkage replication in complex disease through analysis of a large pooled data set: Crohn disease and chromosome 16. Am J Hum Genet 2001; 68: 1165 – 1171. 20 Ohmen JD, Yang HY, Yamamoto KK et al: Susceptibility locus for
inflammatory bowel disease on chromosome 16 has a role in Crohn’s disease, but not in ulcerative colitis. Hum Mol Genet 1996; 5: 1679 – 1683.
21 Brant SR, Nicolae D, LaBuda MC et al: A genome wide screen of Crohn’s disease in a large pedigree shows evidence for linkages to chromosomes11, 16, 8 and 15. Gastroenterology 1998; 114 (suppl): A3600.
22 Parkes M, Satsangi J, Lathrop GM, Bell JI, Jewell DP: Susceptibility loci in inflammatory bowel disease. Lancet 1996; 348: 1588. 23 Cho JH, Nicolae DL, Gold LH et al: Identification of novel
susceptibility loci for inflammatory bowel disease on chromo-somes 1p, 3q, and 4q: Evidence for epistasis between 1p and IBD1. PNAS 1998; 95: 7502 – 7507.
24 Zouali H, Chamaillard M, Lesage S et al: Genetic refinement and physical mapping of a chromosome 16q candidate region for inflammatory bowel disease. Eur J Hum Genet 2001; 9: 731 – 742. 25 Brant SR, Panhuysen CI, Bailey-Wilson JE et al: Linkage heteroge-neity for the IBD1 locus in Crohn’s disease pedigrees by disease onset and severity. Gastroenterology 2000; 119: 1483 – 1490. 26 Hampe J, Cuthbert A, Croucher PJ et al: Association between
insertion mutation in NOD2 gene and Crohn’s disease in German and British populations. Lancet 2001; 357: 1925 – 1928. 27 Hugot JP, Chamaillard M, Zouali H et al: Association of NOD2
leucine-rich repeat variants with susceptibility to Crohn’s disease. Nature 2001; 411: 599 – 603.
28 Ogura Y, Bonen DK, Inohara N et al: A frameshift mutation in NOD2 associated with susceptibility to Crohn’s disease. Nature 2001; 411: 603 – 606.
29 Inohara N, Nunez G: The NOD: a signaling module that regulates apoptosis and host defense against pathogens. Oncogene 2001; 20: 6473 – 6481.
30 Ogura Y, Inohara N, Benito A, Chen FF, Yamaoka S, Nunez G: Nod2, a Nod1/Apaf-1 family member that is restricted to mono-cytes and activates NF-kappaB. J Biol Chem 2001; 276: 4812 – 4818.
31 Beutler B: Autoimmunity and Apoptosis: The Crohn’s Connec-tion. Immunity 2001; 15: 5 – 14.
32 Lennard-Jones JE: Classification of inflammatory bowel disease. Scand J Gastroenterol 1989; 170 (suppl), 2 – 6.
33 Truelove SC, Pena AS: Course and prognosis of Crohn’s disease. Gut 1976; 17: 192 – 201.
34 Hampe J, Wollstein A, Lu T, Frevel HJ, Will M, Schreiber S: An integrated database for Taqman based high throughput SNP genotyping. Bioinformatics 2001, in press.
35 Clayton D, Jones H: Transmission/disequilibrium tests for extended marker haplotypes. Am J Hum Genet 1999; 65: 1161 – 1169.
36 Clayton D: A generalization of the transmission/disequilibrium test for uncertain-haplotype transmission. Am J Hum Genet 1999; 65: 1170 – 1177.
37 Hill WG, Robertson A: Linkage disequilibrium in finite popula-tions. Theor Applied Genet 1968; 38: 226 – 231.
38 Lewontin RC: The interaction of selection linkage. I. General considerations; heterotic models. Genetics 1964; 49: 67 – 67. 39 Excoffier L, Slatkin M: Maximum-likelihood estimation of
mole-cular haplotype frequencies in a diploid population. Mol Biol Evolu 1995; 12: 921 – 927.
40 Bandelt HJ, Forster P, Rohl A: Median-joining networks for infer-ring intraspecific phylogenies. Mol Biol Evol 1999; 16: 37 – 48. 41 Devlin B, Risch N: A comparison of linkage disequilibrium
measures for fine-scale mapping. Genomics 1995; 29: 311 – 322. 42 Kruglyak L: Prospects for whole-genome linkage disequilibrium
mapping of common disease genes. Nat Genet 1999; 22: 139 – 144.
43 Miceli-Richard C, Lesage S, Rybojad M et al: CARD15 mutations in Blau syndrome. Nat Genet 2001; 29: 19 – 20.
44 Xiong M, Guo SW: The power of linkage detection by the trans-mission/disequilibrium tests. Hum Hered 1998; 48: 295 – 312.