저작자표시-비영리-변경금지 2.0 대한민국 이용자는 아래의 조건을 따르는 경우에 한하여 자유롭게 l 이 저작물을 복제, 배포, 전송, 전시, 공연 및 방송할 수 있습니다. 다음과 같은 조건을 따라야 합니다: l 귀하는, 이 저작물의 재이용이나 배포의 경우, 이 저작물에 적용된 이용허락조건 을 명확하게 나타내어야 합니다. l 저작권자로부터 별도의 허가를 받으면 이러한 조건들은 적용되지 않습니다. 저작권법에 따른 이용자의 권리는 위의 내용에 의하여 영향을 받지 않습니다. 이것은 이용허락규약(Legal Code)을 이해하기 쉽게 요약한 것입니다. Disclaimer 저작자표시. 귀하는 원저작자를 표시하여야 합니다. 비영리. 귀하는 이 저작물을 영리 목적으로 이용할 수 없습니다. 변경금지. 귀하는 이 저작물을 개작, 변형 또는 가공할 수 없습니다.
Inhibition of Glioblastoma Tumorsphere
by Combination of 2-Deoxyglucose and
Metformin
Eui Hyun Kim
Department of Medicine
Inhibition of Glioblastoma Tumorsphere
by Combination of 2-Deoxyglucose and
Metformin
Directed by Professor Sun Ho Kim
The Doctoral Dissertation
submitted to the Department of Medicine,
the Graduate School of Yonsei University
in partial fulfillment of the requirements for the degree
of Doctor of Philosophy
Eui Hyun Kim
This certifies that the Doctoral
Dissertation of Eui Hyun Kim is
approved.
---Thesis Supervisor: Sun Ho Kim
---Thesis Committee Member: Seok Gu Kang
---Thesis Committee Member: Kyung Sup Kim
---Thesis Committee Member: Ho Shin Kwak
---Thesis Committee Member: Pilnam Kim
The Graduate School
Yonsei University
ACKNOWLEDGEMENTS
First, I would like to express my sincere gratitude to my
supervisor Prof. Sun Ho Kim for the continuous support of my
research, for his patience, motivation, enthusiasm. Also, I
thank Prof. Seok Gu Kang for his guidance which helped me
in all the time of research and writing of this thesis.
I also would like to thank thesis committee: Prof. Ho Shin
Kawk, Kyung-Sup Kim and Pilnam Kim for their
encouragement, insightful comments, and hard questions.
Last but not the least, I would like to thank my family: my
wife Jiyoun Kim, and my lovely daughters Yuna Kim, Gina
Kim and Lena Kim for their endless and priceless support. I
also thank my parents for giving birth to me at the first place
and supporting me spiritually throughout my life. Lastly, I
would like to express my special thanks to my parents-in-law
for their strong support for me.
<TABLE OF CONTENTS>
ABSTRACT ··· 1
I. INTRODUCTION ··· 3
II. MATERIALS AND METHODS··· 4
1. Single cell isolation from glioma patients ··· 4
2. Lentiviral vector transfection and expression ··· 4
3. Cell viability assay ··· 5
4. Protein extraction and Western blot assay ··· 5
5. GBM TS formation assay ··· 6
6. Three-dimensional invasion assay model ··· 6
7.
18F-fluorodeoxyglucose PET ··· 7
8. Gene expression microarray and class comparison ··· 8
9. Orthotopic xenograft animal model ··· 8
10. Statistical analysis ··· 9
III. RESULTS ··· 10
1. 2DG, metformin and their combination do not inhibit proliferation
of GBM TS ···10
2. Combination of 2DG and metformin decreases stemness of GBM TS ··11
3. Combination of 2DG and metformin inhibits invasiveness of GBM
TS ···12
4. Cellular metabolism; 18F-FDG uptake ···13
5. Gene expression microarray and class comparison ···14
6. Effects of 2DG and metformin in orthotopic xenograft model ···19
IV. DISCUSSION ···20
V. CONCLUSION ···27
REFERENCES ···28
LIST OF FIGURES
Figure 1. Anti-proliferative effect of 2-deoxyglucose and
metformin ···10
Figure 2. Combination of 2-deoxyglucose and metformin
decreases stemness of glioblastoma tumorsphere ···11
Figure 3. Combination of 2-deoxyglucose and metformin
regulates invasiveness in glioblastoma tumorsphere ···13
Figure 4.
18F-fluorodeoxyglucose uptake was measured with
positron emission tomography ···14
Figure 5. Gene expression microarray and class comparison ·15
Figure 6. Effect of the combination of 2-deoxyglucose and
metformin in an orthotopic xenograft model ···19
Figure 7. Sphere formation assay with high dose of metformin
···23
Figure 8. Viability of glioblastoma tumorsphere in collagen
matrix with drugs ···24
Figure 9. Anti-invasion effect of metformin single treatment
with the comparison of high concentration and low
concentration of metformin ···25
LIST OF TABLES
Table 1. Gene ontology groups of genes with significantly
changed expression in combination treatment of
ABSTRACT
Inhibition of Glioblastoma Tumorsphere
by Combination of 2-Deoxyglucose and Metformin
Eui Hyun Kim
Department of Medicine
The Graduate School, Yonsei University
(Directed by Professor Sun Ho Kim)
Objective: The treatment failure of glioblastoma is thought to be the presence of refractory cancer cells. It has been suggested that deprivation of tumor bioenergetics by inhibition of multiple energy pathways could be an effective new therapeutic approach for various human tumors. However, the effectiveness of this idea has not been evaluated in glioblastoma tumorsphere (GBM TS) model. We hypothesized that the dual inhibition of glycolysis and oxidative phosphorylation could suppress GBM TS effectively.
Methods: We evaluated the effect of 2-deoxyglucose (2DG) or metformin each alone, and their combination in GBM TS model. The viability of GBM TS was tested in different conditions, and protein expression related to AMP-activated protein kinase (AMPK)-mammalian target of rapamycin (mTOR) pathway were examined. The influence of combination treatment on cytotoxicity, stemness and invasion properties of GBM TSs was evaluated with sphere formation assay and 3-demensional culture system. Glucose metabolism was assessed with 18fluorodeoxyglucose positron
with gene set enrichment analysis. Lastly, in vivo efficacy tests were performed with mouse orthotopic xenograft model in different conditions. Results: Viability of GBM TS was not decreased by any single or combination treatments of 2DG and metformin. Of note, mTOR-signaling proteins were down-regulated in AMPK-independent manner. Sphere formation was significantly suppressed with 2DG and metformin combination treatment and the proteins related to stemness were down-regulated. Invasion capacity of GBM TS was inhibited by combination treatment in the 3D invasion model assay. PET scan showed
18fluorodeoxyglucose uptake was decreased in the GBM TS treated with
the combination of 2DG and metformin. Transcriptome gene set enrichment analysis showed subset of genes related to extracellular matrix and adhesion were negatively correlated when compared before and after combination treatment. Combination of 2DG and metformin prolonged survival of tumor bearing mice, and the tissue examination revealed decreased invasion of GBM TS.
Conclusion: The combination of 2DG and metformin did not show significant cytotoxicity for GBM TS. However, 2DG and metformin effectively decreased the stemness and invasion capacity of GBM TS, and showed potential survival benefit in mouse orthotopic xenograft models. We believe this dual inhibition of cellular bioenergetics would be worth expedited clinical evaluation in the treatment of glioblastoma patients by targeting GBM TS.
---Key words
: 2-deoxyglucose, glioblastoma, metformin, stemness,Inhibition of Glioblastoma Tumorsphere
by Combination of 2-Deoxyglucose and Metformin
Eui Hyun Kim
Department of Medicine
The Graduate School, Yonsei University
(Directed by Professor Sun Ho Kim)
I. INTRODUCTION
The outcome of a glioblastoma (GBM) is still dismal even with any combination of current best treatment modalities.1-4 One of the reasons for treatment failure is thought to be the presence of refractory cancer cells.5,6 It is well known that cancer cells take advantages from preferential glycolysis for central energy metabolism (Warburg effect)7-9, but mitochondrial respiration is still a major energy production pathway even under anaerobic condition. In particular, the treatment refractory cells characterized by stem cell-like property are more dependent on oxidative phosphorylation.10-14Many studies have shown that inhibition of either glycolysis or oxidative phosphorylation was effective to decrease proliferation, invasion of cancer cells.15-19However, with the idea that simultaneous inhibition of multiple metabolic pathways would be more effective for cancer treatment, there have been a few researches which showed deprivation of tumor bioenergetics by inhibition of multiple energy pathways could be an effective new therapeutic approach for various human tumors.20-22 However, the effectiveness of this idea has not been evaluated in a GBM
tumorsphere (TS) model.23,24 We hypothesized that the dual inhibition of glycolysis and oxidative phosphorylation could suppress GBM TSs effectively with synergetic fashion. In this study, we evaluated the effect of the combination of 2-deoxygluocose (2DG) and metformin on GBM TS.
II. MATERIALS AND METHODS
1. Single cell isolation from glioma patients
The specimens from patients with gliomas were freshly obtained from the operation room. Approval was given from the institutional review of Severance Hospital, Yonsei University College of Medicine (4-2012-0212). Informed consent was provided according to the Declaration of Helsinki. Neuropathologists diagnosed each surgical specimen according to WHO classification.25 For isolation of TSs from GBM specimens, we followed
previously published methods.26,27 We performed the cell isolation procedure
within 2 hr after tumor removal using a mechanical dissociation method. Surgical specimens were minced and dissociated with a scalpel in Dulbecco’s modified Eagle medium: nutrient mixture F-12 (DMEM/F-12; Mediatech, Manassas, VA, USA) and then passed through a series of 100-μm nylon mesh cell strainers (BD Falcon, Franklin Lakes, NJ, USA). Cell suspensions were washed twice in DMEM/F-12 and cultured in complete media (DMEM/F-12) with B27 (1×; Invitrogen, San Diego, CA, USA) plus 20 ng/ml of basic fibroblast growth factor (bFGF; Sigma, St. Louis, MO, USA), 20 ng/ml of epidermal growth factor (EGF; Sigma), and 50 U/ml penicillin/50 mg/ml streptomycin (Gibco, Invitrogen Korea, Seoul, Korea). Two different TSs, GSC11 and TS13-20, were used in this study.
2. Lentiviral vector transfection and expression
complete medium and then applying green fluorescent protein (GFP)-expressing lentiviral supernatants. Polybrene (Sigma) was added to a final concentration of 8 μg/ml and incubated with cells for 18 hr. After infection, the cells were placed in fresh growth medium and cultured in a standard manner. Cells were treated with 1 mg/ml puromycin (Life Technologies Korea, Seoul, Korea) to eliminate uninfected cells and generated stable GFP- GBM TS.
3. Cell viability assay
The effect of 2DG and metformin combination on the survival of GBM TS was determined by [3-(4,5-dimethylthiazol-2-yl)-5-(3-carboxymethoxyphenyl) -2-(4-sulfophenyl)-2H-tetrazolium, inner salt] (MTS) assay.28 5 x10³ GBM TS cells were seeded in 96-well plates and incubated at 37°C for 24 hr and treated with 2DG, metformin and their combination for 5 days. MTS reagent (20μl/well) was added, incubated at 37℃ for 4 hr, and the absorbance was measured at 490nm. Each experiment was repeated three times in triplicate and the results were expressed as % viable cells over control.
4. Protein extraction and Western blot assay
Cells were collected and lysed in lysis buffer (50 mM Tris–Cl, pH 8.0, 150mM Nonidet P-40, 150 mM NaCl, 0.1% SDS, 0.5% deoxycholic acid, phosphatase inhibitor cocktail solution, protease inhibitor cocktail solution) After centrifugation (for 15 min at 14,000 rpm), supernatants were collected and used as whole cell extracts for Western blot analysis.
For Western blot analysis of proteins, samples were electrophoresed at 120 V in SDS–polyacrylamide gels. After transfer to nitrocellulose membranes, membranes were blocked 1hr in PBS/Tween solution containing 5% non-fat dried milk, probed for 3 hr with primary antibody (1:1000 dilution) and for 1 hr with secondary antibody (1:3000 dilution) as specified in the figures. Visualization was achieved using enhanced chemiluminescence according to
the manufacturer’s instructions (Amersham Biosciences).
Western blot analysis was conducted for adenosine monophosphate-activated protein kinase (AMPK) and mammalian target of rapamycin (mTOR)-related proteins, stemness markers such as nestin, CD133, Oct3/4, podoplanin, Sox-2, Notch1 and Notch2, and epithelial mesenchymal transition (EMT)-related markers including snail, Zeb1, β-catenin and N-cadherin.
5. GBM TS formation assay
The GSC11 and TS1 cells were cultured as TS in medium consisting of DMEM/F-12 with 2 % 1×B27, 20 ng/ml 0.02 % bFGF, 20 ng/ml of 0.02 % EGF, and 1 % 50 U/ml penicillin/50 mg/ml streptomycin (100×, Gibco, Invitrogen Korea, Seoul, South Korea). The cells were cultured in different conditions for 3 weeks. Cell cultures were observed with an inverted phase-contrast microscope (I×71 Inverted Microscope; Olympus, Tokyo, Japan) to determine morphology and the size of the GBM TSs. Photographs of cells were obtained with a digital camera (DP70 Digital Microscope Camera; Olympus), using DP Controller software (Olympus).
6. Three-dimensional invasion assay model
The GFP stable GSC11 cells (G-GSC11s) grown in spheroid were cultured in collagen I matrices using polydimethylsiloxane (PDMS)-based micro-wells (diameter and depth of microwells: 6mm and 500μm). The microwells were treated with 1% poly (ethyleneimine) (Sigma-Aldrich, St. Louis, MO, USA) solution for 10 min followed by 0.1% glutaraldehyde (Sigma-Aldrich, St. Louis, MO, USA) for 30 min and washed with PBS for overnight to make PDMS wells adherent to collagen. The 4mg/ml collagen I matrices are prepared from high-concentration rat tail collagen I (BD Bioscience, CA, USA) using the recommended manual provided by the manufacturer. Briefly, the amounts of
10x phosphate buffered saline (PBS), 1N NaOH, sterile dH2O and collagen I were mixed to create gels based on the desired final concentration. The solution is well mixed and kept at 4℃ before use. To encapsulate G-GSC11 spheroid, 10ul of collagen I solution (4mg/ml) were pipetted into the micro-well, single G-GSC11 spheroid is placed onto collagen I matrices from culture plate, and 10ul of collagen I solution (4mg/ml) was dropped onto G-GSC11 spheroid. The platform was incubated at 37℃ and 5% CO2 for 30 min. The cell viability was characterized by staining G-GSC11 spheroid with 8μM Ethidium homodimer-1 (Invitrogen Korea, Seoul, South Korea) for 30 min at 37℃ before implantation in collagen matrix. After full gelation, a superlayer of culture medium consisting of DMEM/F-12 with 2 % 1×B27, 20 ng/ml 0.02 % bFGF, 20 ng/ml of 0.02 % EGF, and 1 % antibiotic–antimycotic solution (100×, Gibco, Invitrogen Korea, Seoul, South Korea) is then added. To observe drug effects, drugs are mixed with medium considering final concentration of each drug. Images were taken using an inverted confocal laser scanning microscope (Nikon Ti-E, Tokyo, Japan) to observe dynamic morphology of G-GSC11 spheroids. To quantitate the invasion assay, the maximal area covered by migrating edges of cells was used as a parameter for defining invasiveness (invaded area at certain time/spheroid area at initial time×100). Data are analyzed through image analysis software ImageJ (NIH, Bethesda, Maryland, USA).
7.
18F-fluorodeoxyglucose PET
GBM cell lines were plated on 12-well plates with 3 x10⁵cells per well for 24 hr and treated with 2DG, metformin and their combination for 3 days. The medium was changed to a glucose-free DMEM medium (Gibco) containing approximately 0.5 uCi of 18F-FDG, followed by incubation for 15 min. The cells were washed with phosphate-buffered saline 3 times and 0.1 mL of lysis buffer
was added to each well. The lysed cells were then harvested to measure the amount of radioactivity by gamma-counter (Wallac 148 Wizard 3; Perkin Elmer). The radioactivity measured was normalized to protein content.
8. Gene expression microarray and class comparison
Total RNA was extracted from tissue using a Qiagen miRNA kit according to the manufacturer’s protocol. Expression profiles were obtained using Illumina HumanHT-12 v4 Expression BeadChip (Illumina, Inc., San Diego, CA). Raw data were extracted using the software provided by the manufacturer (Illumina GenomeStudio v2011.1 (Gene Expression Module v1.9.0)). Data were transformed by logarithm and normalized by quantile method. Genes involving adhesion junction, adhesion molecules (CAMs), ECM-receptor interaction, focal adhesion, regulation of actin cytoskeleton); SNARE interactions in vesicular transport); TGF-beta signaling pathway) defined by Kyoto Encyclopedia of Genes and Genomes (KEGG) pathway gene sets were filtered and analyzed. All analyses were performed using BRB-ArrayTools developed by Dr. Richard Simon and the BRB-ArrayTools Development Team. We identified genes that were differentially expressed among the two classes using a random-variance t-test. Genes were considered statistically significant if their p value was less than 0.001. We also performed a global test of whether the expression profiles differed between the classes by permuting the labels of which arrays corresponded to which classes. For each permutation, the p values were re-computed and the number of genes significant at the 0.001 level was noted. The proportion of the permutations that gave at least as many significant genes as with the actual data was the significance level of the global test.
9. Orthotopic xenograft animal model
Male athymic nude mice (Central Lab Animal Inc., Seoul, Korea), aged 4 to 8 weeks, were used in this study. Mice were housed in micro-isolator cages
under sterile conditions and observed for at least 1 week before study initiation to ensure proper health. Lighting, temperature, and humidity were controlled centrally. All experimental procedures were approved by Yonsei University College of Medicine Institutional Animal Care and Use Committee. Mice were anesthetized with a solution of Zoletil® (30 mg/kg; Virbac Korea, Seoul, South Korea) and xylazine (10 mg/kg; Bayer Korea, Seoul, South Korea) delivered intraperitoneally. GB TSs were implanted into the right frontal lobe of nude mice using a guide-screw system within the skull, as described previously.29-33 Mice received 5×10⁵GBM TS cells via a Hamilton syringe (Dongwoo Science Co., Seoul, South Korea) inserted to a depth of 4.5 mm. GBM TS cells were injected into three mice simultaneously using a multiple micro-infusion syringe pump (Harvard Apparatus, Holliston, MA, USA) at a speed of 0.5 μl/min. Then, 500mg/kg of 2DG, 500mg/kg of metformin was administrated to mice intraperitoneally every other day. The body weight of mice was checked every other day. If the weight decreased more than 15 % compared to the original body weight, mice were euthanized according to protocol. When mice died, we carefully removed mouse brains and observed gliomagenesis with H/E staining, and tumor cell invasion with Zeb1 staining. Invading cells were defined as the Zeb1-positive cells outside gross tumor boundary demarcated by H/E staining, and they were counted.
10. Statistical analysis
Data are expressed as means ± standard deviations. Survival of GBM TS cells-implanted mice was evaluated using the Kaplan Meier method. All statistical analyses and graphing were performed using SPSS version 18.0KO software (SPSS Korea, Seoul, Korea).
III. RESULTS
1. 2DG, Metformin and their combination do not inhibit
proliferation of GBM TS
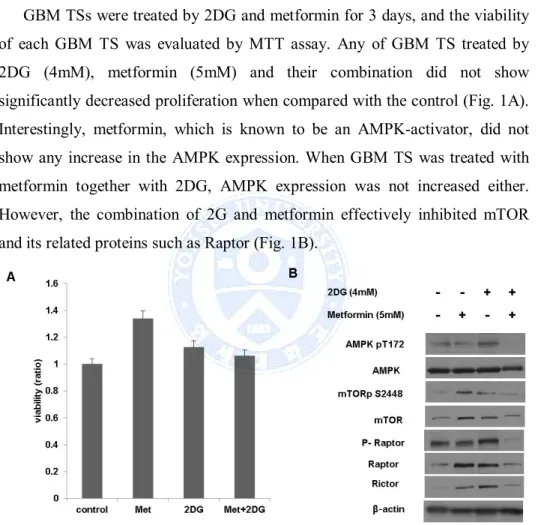
GBM TSs were treated by 2DG and metformin for 3 days, and the viability of each GBM TS was evaluated by MTT assay. Any of GBM TS treated by 2DG (4mM), metformin (5mM) and their combination did not show significantly decreased proliferation when compared with the control (Fig. 1A). Interestingly, metformin, which is known to be an AMPK-activator, did not show any increase in the AMPK expression. When GBM TS was treated with metformin together with 2DG, AMPK expression was not increased either. However, the combination of 2G and metformin effectively inhibited mTOR and its related proteins such as Raptor (Fig. 1B).
Figure 1. Anti-proliferative effect of 2-Deoxyglucose (2DG) and metformin (Met), (A) 2DG, metformin and their combination did not inhibit proliferation of glioblastoma (GBM) tumorsphere (TS), (B) Increased expression of AMP-activated protein kinase (AMPK) was observed neither in single treatment of metformin nor in combination treatment. Of note, the combination of 2G and metformin effectively inhibited mammalian target of rapamycin (mTOR) and its related proteins.
2. Combination of 2DG and metformin decreases stemness of
GBM TS
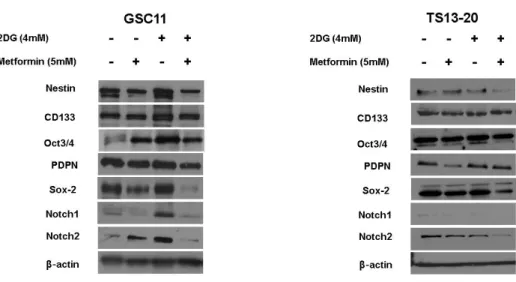
Sphere formation assay was performed in different conditions. The size of the GBM TS treated with 2DG (4mM) was about the same as the control. Metformin alone showed moderate inhibition of the sphere formation. When GBM TS was cultured in the condition of 2DG and metformin together, this combination treatment showed strong anti-stemness effect as no sphere was observed at all (Fig. 2A). Compared with sphere formation in the condition of metformin (5mM) alone, the combination of 2DG(4mM) and metformin (5mM) showed synergetic anti-stemness effect on GBM TS. Also, the protein expression of stemness-related genes such as nestin, podoplanin, Sox-2, Notch1 and Notch2 were down-regulated by this combination of 2-DG and metformin (Fig. 2B).
Figure 2. Combination of 2-Deoxyglucose (2DG) and metformin (Met) decreases stemness of glioblastoma tumorsphere, (A) Sphere formation was tested in different conditions. Although metformin single treatment showed moderate inhibition of sphere formation, no sphere formation was observed in the treatment of the combination of 2DG and metformin. (B) Downregulation of stemness-related genes in the combination treatment was confirmed on western blot assay.
3. Combination of 2DG and metformin inhibits invasiveness of
GBM TS
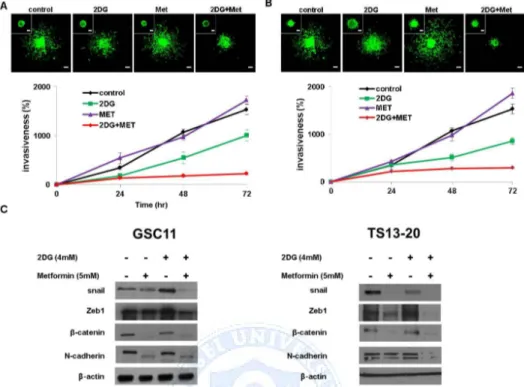
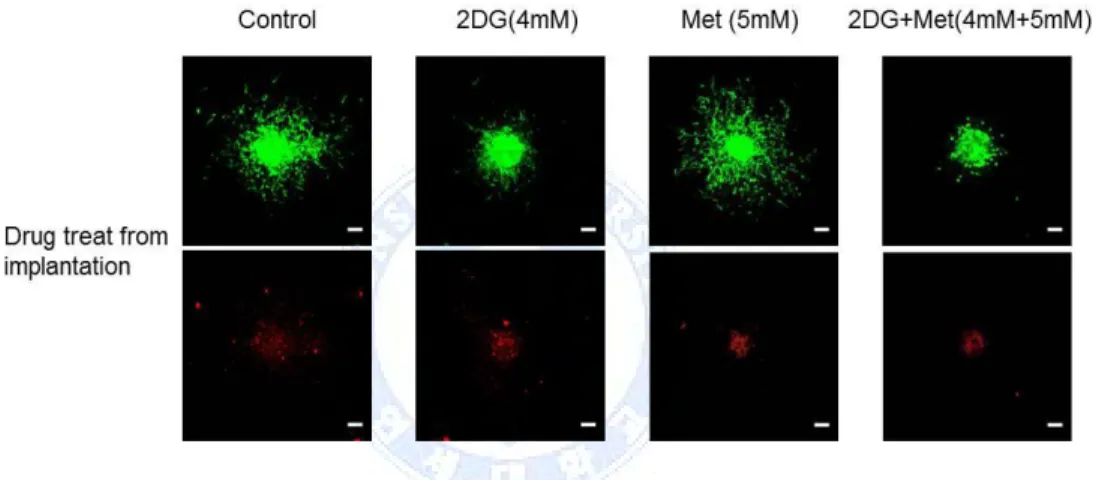
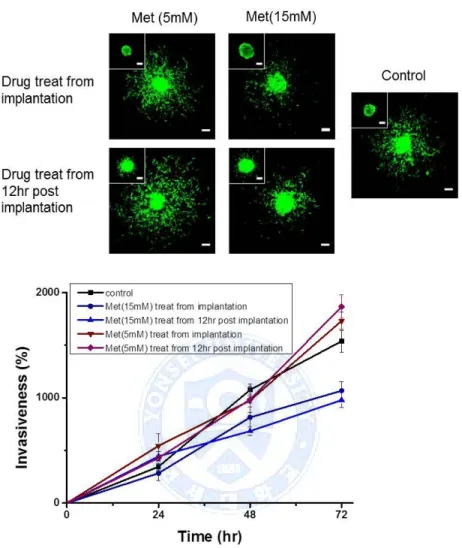
For 3D invasion assay, we implanted one type of GBM TS as G-GSC11 in a collagen type I matrix. The implanted GBM TS migrate radially into the collagen matrix, which is physiologically relevant to in vivo tumor behaviors. To observe the distinct effects of drugs on cells starting invasion and invaded cells, two drug treating time points were employed, from implantation point of GBM TS in collagen matrix (Fig. 3A) and 12hr post implantation of GBM TS in collagen matrix (Fig. 3B).
Figure 3. Combination of 2-Deoxyglucose (2DG) and metformin (Met) regulates invasiveness in glioblastoma (GBM) tumorsphere (TS), (A) GBM TS invasion in collagen I matrices, in the presence of various drugs from implantation (images: after 72hr, inset: drug treat point, scale bar: 100μm) and (B) GBS TS invasion in collagen I matrices, in the presence of various drugs from 12hr post implantation (images: after 72hr, inset: drug treat point) were inhibited by combination treatment of 2DG and metformin. Metformin alone did not show inhibition of invasion property of GBM TS. (C) Decreased expression of epithelial mesenchymal transition-related genes was observed on western blot.
After 72 hr, over 80% of GBM TS invasion inhibited with combination of 2DG (4mM) and Metformin (5mM) compared to absence of drugs, both in two drug treating time points. Single treatment of 2DG (4mM) also inhibited invasion about 34% (drug treat from implantation) and 44% (drug treat from 12 hr post implantation).On western blot, the expression of EMT-related markers such as Zeb1, β–catenin, N-cadherin were markedly decreased (Fig 3C). Single treatment of Metformin (5mM) did not inhibit the invasion of GBM TS at all
whereas 2DG alone seemed to decrease the invasiveness of GBM TS, however, this finding was not consistent with the results on western blot.
4. Cellular metabolism;
18F-FDG uptake
The F18-FDG uptake was markedly decreased in GBM TS treated with combination of 2DG and metformin although decreased glucose metabolism was also observed in GBM TS treated with either 2DG or metformin alone (Fig. 4.).
Figure 4.
18F-fluorodeoxyglucose uptake was measured with positronemission tomography, the F18-FDG uptake was markedly decreased in GBM (GSC-11) treated with combination of 2DG and metformin (Met).
5. Gene expression microarray and class comparison
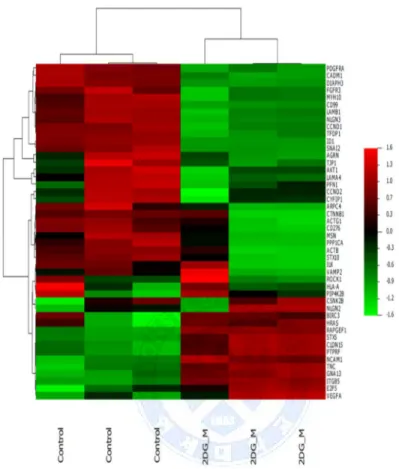
We performed gene expression microarray and genes involving certain pathway were compared between control and 2DG+metformin treated group. (See Fig. 5 and Table 1) In control group of cancer stem cells, genes regulating cellular migration and several EMT related and TGF-beta pathway genes potentially involving EMT pathway were upregulated whereas cellular adhesion molecules were upregulated in treated group.
Figure 5. Gene expression microarray and class comparison, Heatmap of gene expression of Kyoto Encyclopedia of Genes and Genomes (KEGG) pathway selected gene of control and 2-deoxyglucose/metformin-treated groups. Genes involved in epithelial mesenchymal transition process were downregulated in the treated group.
16
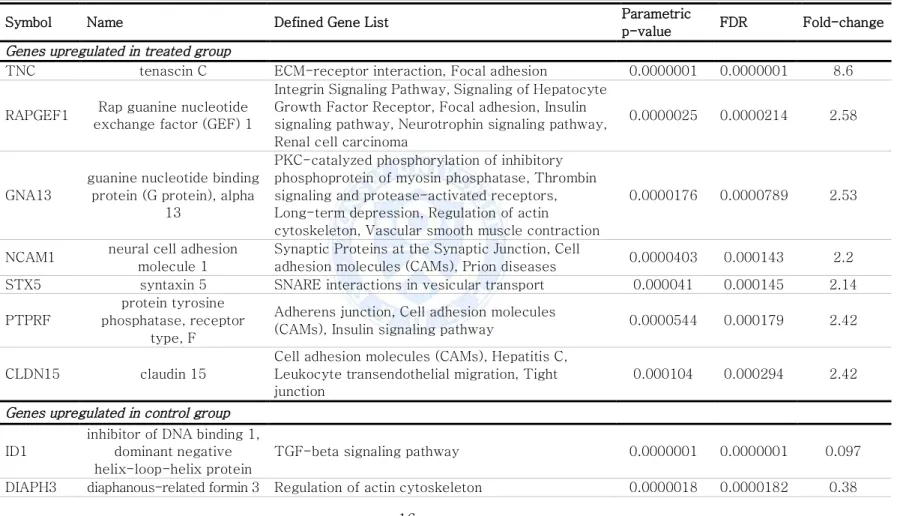
Table 1. Gene ontology groups of genes with significantly changed expression in combination treatment of 2-deoxyglucose and metformin
Symbol Name Defined Gene List Parametric
p-value FDR Fold-change
Genes upregulated in treated group
TNC tenascin C ECM-receptor interaction, Focal adhesion 0.0000001 0.0000001 8.6 RAPGEF1 Rap guanine nucleotide
exchange factor (GEF) 1
Integrin Signaling Pathway, Signaling of Hepatocyte Growth Factor Receptor, Focal adhesion, Insulin signaling pathway, Neurotrophin signaling pathway, Renal cell carcinoma
0.0000025 0.0000214 2.58
GNA13
guanine nucleotide binding protein (G protein), alpha
13
PKC-catalyzed phosphorylation of inhibitory phosphoprotein of myosin phosphatase, Thrombin signaling and protease-activated receptors, Long-term depression, Regulation of actin cytoskeleton, Vascular smooth muscle contraction
0.0000176 0.0000789 2.53
NCAM1 neural cell adhesion molecule 1
Synaptic Proteins at the Synaptic Junction, Cell
adhesion molecules (CAMs), Prion diseases 0.0000403 0.000143 2.2 STX5 syntaxin 5 SNARE interactions in vesicular transport 0.000041 0.000145 2.14 PTPRF
protein tyrosine phosphatase, receptor
type, F
Adherens junction, Cell adhesion molecules
(CAMs), Insulin signaling pathway 0.0000544 0.000179 2.42 CLDN15 claudin 15
Cell adhesion molecules (CAMs), Hepatitis C, Leukocyte transendothelial migration, Tight junction
0.000104 0.000294 2.42
Genes upregulated in control group
ID1
inhibitor of DNA binding 1, dominant negative helix-loop-helix protein
TGF-beta signaling pathway 0.0000001 0.0000001 0.097 DIAPH3 diaphanous-related formin 3 Regulation of actin cytoskeleton 0.0000018 0.0000182 0.38
17
TFDP1 transcription factor Dp-1
Cell Cycle: G1/S Check Point , Cyclin E Destruction Pathway, Cyclins and Cell Cycle Regulation, E2F1 Destruction Pathway, Influence of Ras and Rho proteins on G1 to S Transition, Regulation of p27 Phosphorylation during Cell Cycle Progression, Cell cycle, TGF-beta signaling pathway
0.0000022 0.0000203 0.34
CADM1 cell adhesion molecule 1 Cell adhesion molecules (CAMs) 0.0000023 0.0000206 0.26 SNAI2 snail family zinc finger 2 Downregulated of MTA-3 in ER-negative Breast
Tumors, Adherens junction 0.0000034 0.0000257 0.3
PDGFRA
platelet-derived growth factor receptor, alpha
polypeptide
CBL mediated ligand-induced downregulation of EGF receptors, Erk1/Erk2 Mapk Signaling pathway, PDGF Signaling Pathway, Phospholipids as
signalling intermediaries, Rac 1 cell motility signaling pathway, Role of PI3K subunit p85 in regulation of Actin Organization and Cell Migration, Calcium signaling pathway, Cytokine-cytokine receptor interaction, Endocytosis, Focal adhesion, Gap junction, Glioma, MAPK signaling pathway, Melanoma, Pathways in cancer, Prostate cancer, Regulation of actin cytoskeleton
18
CCND1 cyclin D1
BTG family proteins and cell cycle regulation, CARM1 and Regulation of the Estrogen Receptor, Cell Cycle: G1/S Check Point , Cyclins and Cell Cycle Regulation, Inactivation of Gsk3 by AKT causes accumulation of b-catenin in Alveolar Macrophages, Influence of Ras and Rho proteins on G1 to S Transition, p53 Signaling Pathway, WNT Signaling Pathway, Acute myeloid leukemia, Bladder cancer, Cell cycle, Chronic myeloid leukemia, Colorectal cancer, Endometrial cancer, Focal adhesion, Glioma, Jak-STAT signaling pathway, Melanoma, Non-small cell lung cancer, p53 signaling pathway, Pancreatic cancer,
Pathways in cancer, Prostate cancer, Small cell lung cancer, Thyroid cancer, Viral myocarditis, Wnt signaling pathway
0.00002 0.000086 0.44
LAMB1 laminin, beta 1
Prion Pathway, Amoebiasis, ECM-receptor interaction, Focal adhesion, Pathways in cancer, Small cell lung cancer, Toxoplasmosis
0.0000413 0.000146 0.45 CD99 CD99 molecule Cell adhesion molecules (CAMs), Leukocyte
transendothelial migration 0.000046 0.000159 0.5
MYH10 myosin, heavy chain 10, non-muscle
Regulation of actin cytoskeleton, Tight junction,
Viral myocarditis 0.0001869 0.000479 0.47
FGFR3 fibroblast growth factor receptor 3
Bladder cancer, Endocytosis, MAPK signaling pathway, Pathways in cancer, Regulation of actin cytoskeleton
6. Effects of 2DG and metformin in orthotopic xenograft model
When the mice died after different treatments, their brains were removed and examined with H & E stain. The size of the tumor was much smaller in the mice treated with 2DG and metformin together than in the control group, however, the inhibitory effect of combination treatment was not superior to that of 2DG (Fig. 6A). The number of Zeb1-positive cells located outside the gross tumor boundary was counted, which demonstrated the combination treatment markedly inhibited invasion of GBM TS cells compared with the control and any of single treatments (Fig. 6B). Kaplan-Meier survival analysis showed increased survival of the mice treated with combination of 2DG and metformin compared with the control (P = .008) (Fig. 6C).
Figure 6. Effect of the combination of 2-deoxyglucose (2DG) and metformin (Met) in an orthotopic xenograft model, (A) The size of the tumor was much smaller in the mice treated with combination of 2DG and metformin than the control and any other treatment groups. (B) Zeb1 immunohistochemistry (IHC) revealed that the combination treatment markedly inhibited invasion of glioblastoma tumorsphere cells compared with the control. (C) Kaplan-Meier survival curve showed increased survival of the mice treated with combination of 2DG and metformin when compared with the control (P = .008). (A) H & E 12ⅹ (B) Zeb1-IHC 12ⅹ
IV. DISCUSSION
Modulation of cancer metabolism is one of emerging approaches for cancer treatment. This is based on the idea that the inhibition of cellular bioenergetics would possibly override the oncogenic signaling pathway.
As cancer cells are more dependent on glycolysis (Warburg effect)7-9, there have been various attempts to block glycolysis for cancer cell inhibition. In most of these studies, 2DG, a competitive inhibitor of glucose, was used for glycolysis inhibition.16,22 Various drugs targeting mitochondrial oxidative phosphorylation in TCA cycle, such as AICAR, oxaloacetate, oligomycin and metformin, were extensively tested.34,35 Especially, the anti-cancer mechanism of biguanide, the most popular anti-diabetic drug, has been now well understood
by numerous researches. It is known that the anti-cancer mechanism of biguanide is mediated by activation of AMPK and consequent inhibition of mTOR pathway.36-39
Many studies have shown that inhibition of either glycolysis or oxidative phosphorylation was effective to decrease proliferation, invasion of cancer cells. However, even if glycolysis is inhibited by 2DG, the tricarboxylic acid (TCA) cycle is still working even under hypoxic condition.40 Although many experiments above showed results supporting therapeutic potential of single pathway inhibition, it is apparent that cancer cells can utilize these two pathways, and one could be an alternative when the other pathway is blocked. Cheong et al. suggested that dual inhibition of glycolysis and oxidative phosphorylation would results in more serious cellular energetic deprivation showing better anti-cancer effect.20 2DG is an glucose-mimetic agent, which competes with normal glucose; the effect of 2-DG is like emptying the fuel. On the other hand, oligomycin and metformin directly inhibits cellular energy production in mitochondria. In many studies, this combination of 2DG and metformin showed stronger anti-cancer effect than single treatment.20-22 For a glioblastoma which is one of the deadliest cancers, Kennedy et al. evaluated the efficacy of dual inhibition of glycolysis and oxidative phosphorylation based on a GBM cell line model.23 They used oligomycin to suppress oxidative phosphorylation, and 2DG as a glycolysis inhibitor. They observed GBM cell lines which were sensitive to oligomycin did not undergo AMPK activation and adaptive glycolytic switch. On the other hand, when oligomycin-resistant GBM cell lines were treated with 2DG simultaneously, they observed strong anti-proliferation effect.
Cancer stem cell theory postulates that a small population of tumor-initiating cells is responsible for the development, progression and recurrence of cancers.41,42 Especially, it is believed that tumor-initiating cell with stem properties is responsible for treatment failure.5 The metabolic
characteristics of a cancer stem cell have not been clearly elucidated. There are many reports that cancer stem cells prefer glycolysis.10-13 However, other researches support “reverse Warburg effect” that cancer stem cell more depends on oxidative phosphorylation based on the selective toxicity of metformin on a cancer stem cell or a tumor-initiating cell.17-19,43-45Viale et al. demonstrated that surviving cancer cells which are responsible for tumor relapse have features of cancer stem cells and depend on oxidative phosphorylation for survival.14
In our study, rather than specific GBM cell lines, we chose GBM TS as we believe new therapeutic approach should target or, at least, include tumor-initiating cells (cancer stem cells). First, we checked the cytotoxicity of 4mM of 2DG and 5mM of metformin on GBM TS. Very unlike our expectation that the combination of 2DG and metformin would show strong anti-cancer effect, neither combination nor the single treatment of 2DG and metformin did not inhibit proliferation of GBM TS. Interestingly, cell viability was rather increased with metformin treatment compared with the control. This finding was also consistent with upregulation of mTOR and its related proteins on western blot. Considering AMPK was also activated with metformin treatment as expected38, we think that metformin-induced mTOR activation could be AMPK-independent in GBM. Liu et al. revealed that metformin suppressed GBM proliferation through PRAS40-mediated mTOR inhibition. They found AMPK activation is not required for anti-proliferative action of metformin.46 We also noted AMPK-independent regulation of mTOR, however, we failed to show anti-proliferative effect of low dose metformin (5mM) based on a GBM TS model. Würth et al. reported metformin inhibited the viability of GBM tumor-initiating cells concentration-dependently, however, this anti-proliferative effect was not apparent at low dose of metformin either in their experiment.19 We found that combination treatment of 2DG and metformin inhibited mTOR and its related proteins such as Raptor in an AMPK-independent manner, but it did not lead to anti-proliferative action on GBM TS.
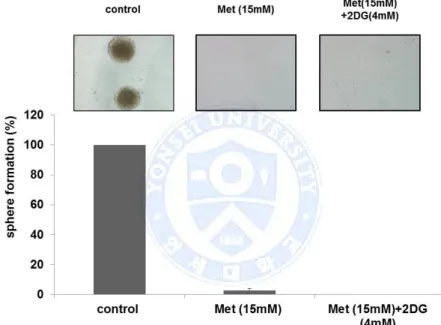
Instead of anti-proliferative actions, the combination treatment resulted in strong inhibition of stemness. No sphere was formed under dural treatment of 4mM of 2DG and 5mM of metformin. This finding was also supported by western blot as expression of stem cell markers such as Sox2, Notch2 were markedly decreased in a combination treatment group. Metformin alone also seemed to decrease sphere formation of GBM TS in a dose dependent manner (Fig. 7), however, downregulation of stem cell markers were not observed.
Figure 7. Sphere formation assay with high dose of metformin (Met), Tumorsphere formation was test in different conditions with higher dose of metformin (15mM). Single treatment of metformin showed strongly inhibited sphere formation of GBM TS when compared with combination with 2-Deoxyglucose (2DG).
There are many reports suggesting that tumor invasion is mediated by the cancer stem cell population.47-49 In order to elucidate whether modulation of cancer metabolism could inhibit invasion properties of GBM TS, we employed an in vivo-like tumor model to observe three-dimensional invasion of GBM TS. To design physiologically relevant platform to in-vivo environment, type I
collagen which is the most abundant matrix in human body was used. After implantation spheroids in collagen matrix, the GSC11 cells in cell-matrix boundary radially invaded into matrix and collagen matrix may mediate their changes in behaviors.50 In two drug treating time points, combination of 2DG (4mM) and Metformin (5mM) dramatically inhibited the invasion for 3 days while did not induce cell death. The dead cells were exclusively observed at the core of spheroids due to hypoxia (Fig. 8), which means 2DG and metformin treatment does not affect cell viability but purely inhibits invasion of GBM TS.
Fig. 8. Viability of glioblastoma (GBM) tumorsphere (TS) in collagen matrix with drugs, Red fluorescence indicating dead cells is mainly localized in the core of the spheroids. The extent and amount of red fluorescence of each treatment group was about the same, and even similar to that of the control GBM TS. (images: after 72hr, scale bar: 100μm, upper row: green fluorescent protein-GBM TS, lower row: dead cell stained GBM TS) 2DG, 2-deoxyglucose; MET, metformin
As for the GBM TS treated with metformin alone, we found that invasion of GBM TS was not inhibited when treated with low concentration of metformin (5mM). But, with high concentration of metformin (15mM), it showed inhibitory effect on invasion of GBM TS (Fig. 9) as previously shown by Bao et al.51
Fig. 9. Anti-invasion effect of metformin single treatment with the comparison of high concentration and low concentration of metformin, Effect of metformin on invasion of glioblastoma tumorsphere depends on the concentration. Invasion of GBM TS was not inhibited in the condition of 5mM of metformin whereas 15mM of metformin showed inhibitory effect on invasion of GBM TS.
In order to clarify whether the anti-stemness and anti-invasion effect of 2DG and metformin is really mediated by altered metabolic status, we checked 18F-FDG uptake from GBM TS with micro-PET. Indeed, the 18F-FDG uptake was markedly decreased in GBM TS treated with combination of 2DG and
metformin.
We conducted trancriptome assay with the comparison between before and after the combination treatment on GBM TS, and found genes related to ECM receptor, adhesion and cytoskeleton, were negatively correlated on GSEA.
2DG and metformin are transported across the blood-brain barrier (BBB) by transport proteins such as GLUT-1 and OCT1, respectively. We noted a possibility that this combination would also show anti-cancer effect for glioblastomas. Indeed, the combination of 2DG and metformin was proved to be effective in an in vivo model as well. In the experiment with an orthotopic xenograft model, the tumor growth was inhibited in the combination treatment group when compared with the control. However, rather than focusing on the tumor size, Zeb1 staining revealed that the combination treatment of 2DG and metformin strongly inhibited GBM TS invasion. Moreover, these strong anti-cancer actions also led to survival benefit.
In our experiment, we used 500mg/kg of metformin administrated by intraperitoneal injection every other day, which was the maximal dose the mice tolerated. Although it is obvious metformin crosses BBB, the CSF concentration of metformin is only 10% of serum concentration. In order to increase the concentration of metformin in CSF, administration of higher dose of metformin is inevitable. 500mg/kg of metformin is apparently quite high dose to be used for human, however, the maximal safe dose of metformin was determined based on daily long-term use for diabetes control, and not for anti-cancer action. Pollak also noted a possibility of short-term use of metformin at higher doses.38Also, because 500mg of metformin alone failed to
show anti-cancer effect in in vivo setting, we can lower the required dose of metformin for anti-cancer effect by combining with 2DG. Other biguanides such as penformin could be another way to decrease toxicity as its CSF concentration is much higher than that of metformin.38
conventional standard therapeutics could be a new therapeutic approach expecting synergetic anti-cancer effect. With the same idea, there has been already increasing number of researches in the literature.52-54
V. Conclusion
In summary, the combination of 2DG and metformin did not show cytotoxicity for GBM TS. But, 2DG and metformin effectively decreased the stemness and invasion capacity of GBM TS, and showed potential survival benefit in mouse orthotopic xenograft model experiment. We believe this dual inhibition of bioenergetic pathways could be helpful in the treatment of GBM patients by targeting GBM TS.
REFERENCES
1. Chinot O, Wick W, Mason W, Henriksson R, Sarn F, Nishikawa R. Phase III Trial of Bevacizumab added to standard radiotherapy and temozolomide for newly-diagnosed glioblastoma: Final progression-free survival and interim overall survival results in Avaglio. Neuro-oncology 2012;14:vi101-vi5. 2. Gilbert MR, Dignam J, Won M, Blumenthal D, Vogelbaum MA, Aldape K,
et al. RTOG 0825: Phase III double-blind placebo-controlled trial evaluating bevacizumab (Bev) in patients (Pts) with newly diagnosed glioblastoma (GBM). J Clin Oncol 2013;31:1.
3. Stupp R, Hegi ME, Mason WP, van den Bent MJ, Taphoorn MJ, Janzer RC, et al. Effects of radiotherapy with concomitant and adjuvant temozolomide versus radiotherapy alone on survival in glioblastoma in a randomised phase III study: 5-year analysis of the EORTC-NCIC trial. The lancet oncology 2009;10:459-66.
4. Bai RY, Staedtke V, Riggins GJ. Molecular targeting of glioblastoma: Drug discovery and therapies. Trends Mol Med 2011;17:301-12.
5. Liu G, Yuan X, Zeng Z, Tunici P, Ng H, Abdulkadir IR, et al. Analysis of gene expression and chemoresistance of CD133+ cancer stem cells in glioblastoma. Mol Cancer 2006;5:67.
6. Bao S, Wu Q, McLendon RE, Hao Y, Shi Q, Hjelmeland AB, et al. Glioma stem cells promote radioresistance by preferential activation of the DNA damage response. Nature 2006;444:756-60.
7. Gatenby RA, Gillies RJ. Why do cancers have high aerobic glycolysis? Nature Reviews Cancer 2004;4:891-9.
8. Koppenol WH, Bounds PL, Dang CV. Otto Warburg's contributions to current concepts of cancer metabolism. Nature Reviews Cancer 2011;11:325-37.
9. Vander Heiden MG, Cantley LC, Thompson CB. Understanding the Warburg effect: the metabolic requirements of cell proliferation. science 2009;324:1029-33.
10.Bednar F, Simeone DM. Metformin and cancer stem cells: old drug, new targets. Cancer Prevention Research 2012;5:351-4.
11.Hirsch HA, Iliopoulos D, Struhl K. Metformin inhibits the inflammatory response associated with cellular transformation and cancer stem cell growth. Proceedings of the National Academy of Sciences 2013;110:972-7.
12.Hirsch HA, Iliopoulos D, Tsichlis PN, Struhl K. Metformin selectively targets cancer stem cells, and acts together with chemotherapy to block tumor growth and prolong remission. Cancer research 2009;69:7507-11. 13.Rattan R, Ali Fehmi R, Munkarah A. Metformin: an emerging new
therapeutic option for targeting cancer stem cells and metastasis. Journal of oncology 2012;2012.
14.Viale A, Pettazzoni P, Lyssiotis CA, Ying H, Sánchez N, Marchesini M, et al. Oncogene ablation-resistant pancreatic cancer cells depend on mitochondrial function. Nature 2014;514:628-32.
15.Prasanna VK, Venkataramana NK, Dwarakanath B, Santhosh V. Differential responses of tumors and normal brain to the combined treatment of 2-DG and radiation in glioablastoma. Journal of cancer research and therapeutics 2009;5:44.
16.Zhu Z, Jiang W, McGinley JN, Thompson HJ. 2-Deoxyglucose as an energy restriction mimetic agent: effects on mammary carcinogenesis and on mammary tumor cell growth in vitro. Cancer research 2005;65:7023-30. 17.Sato A, Sunayama J, Okada M, Watanabe E, Seino S, Shibuya K, et al.
Glioma-initiating cell elimination by metformin activation of FOXO3 via AMPK. Stem Cells Transl Med 2012;1:811-24.
18.Ferla R, Haspinger E, Surmacz E. Metformin inhibits leptin-induced growth and migration of glioblastoma cells. Oncol Lett 2012;4:1077-81.
19.Wurth R, Pattarozzi A, Gatti M, Bajetto A, Corsaro A, Parodi A, et al. Metformin selectively affects human glioblastoma tumor-initiating cell viability: A role for metformin-induced inhibition of Akt. Cell Cycle 2013;12:145-56.
20.Cheong J-H, Park ES, Liang J, Dennison JB, Tsavachidou D, Nguyen-Charles C, et al. Dual inhibition of tumor energy pathway by 2-deoxyglucose and metformin is effective against a broad spectrum of preclinical cancer models. Molecular cancer therapeutics 2011;10:2350-62. 21.Sahra IB, Tanti J-F, Bost F. The combination of metformin and
2-deoxyglucose inhibits autophagy and induces AMPK dependent apoptosis in prostate cancer cells. Autophagy 2010;6:670-1.
22.Cheng G, Zielonka J, McAllister D, Tsai S, Dwinell MB, Kalyanaraman B. Profiling and targeting of cellular bioenergetics: inhibition of pancreatic cancer cell proliferation. Br J Cancer 2014;111:85-93.
23.Kennedy CR, Tilkens SB, Guan H, Garner JA, Or PM, Chan AM. Differential sensitivities of glioblastoma cell lines towards metabolic and signaling pathway inhibitions. Cancer Lett 2013;336:299-306.
24.Beckner ME, Gobbel GT, Abounader R, Burovic F, Agostino NR, Laterra J, et al. Glycolytic glioma cells with active glycogen synthase are sensitive to PTEN and inhibitors of PI3K and gluconeogenesis. Lab Invest 2005;85:1457-70.
25.Louis DN, Ohgaki H, Wiestler OD, Cavenee WK, Burger PC, Jouvet A, et al. The 2007 WHO classification of tumours of the central nervous system. Acta neuropathologica 2007;114:97-109.
26.Singh SK, Clarke ID, Terasaki M, Bonn VE, Hawkins C, Squire J, et al. Identification of a cancer stem cell in human brain tumors. Cancer research 2003;63:5821-8.
27.Singh SK, Hawkins C, Clarke ID, Squire JA, Bayani J, Hide T, et al. Identification of human brain tumour initiating cells. nature 2004;432:396-401.
28.Mosmann T. Rapid colorimetric assay for cellular growth and survival: application to proliferation and cytotoxicity assays. Journal of immunological methods 1983;65:55-63.
29.Ajayi A, Yu X, Lindberg S, Langel Ü, Ström A-L. Expanded ataxin-7 cause toxicity by inducing ROS production from NADPH oxidase complexes in a stable inducible Spinocerebellar ataxia type 7 (SCA7) model. BMC neuroscience 2012;13:86.
30.Kang S-G, Shinojima N, Hossain A, Gumin J, Yong RL, Colman H, et al. Isolation and perivascular localization of mesenchymal stem cells from mouse brain. Neurosurgery 2010;67:711.
31.Kim S-M, Kang S-G, Park N-R, Mok H-S, Huh Y-M, Lee S-J, et al. Presence of glioma stroma mesenchymal stem cells in a murine orthotopic glioma model. Child's Nervous System 2011;27:911-22.
32.Lal S, Lacroix M, Tofilon P, Fuller GN, Sawaya R, Lang FF. An implantable guide-screw system for brain tumor studies in small animals. Journal of neurosurgery 2000;92:326-33.
33.Long LE, Lind J, Webster M, Weickert CS. Developmental trajectory of the endocannabinoid system in human dorsolateral prefrontal cortex. BMC neuroscience 2012;13:87.
34.Owen MR, Halestrap AP. The mechanisms by which mild respiratory chain inhibitors inhibit hepatic gluconeogenesis. Biochimica et Biophysica Acta (BBA)-Bioenergetics 1993;1142:11-22.
35.Wallace DC. Mitochondria and cancer. Nature Reviews Cancer 2012;12:685-98.
36.Kalender A, Selvaraj A, Kim SY, Gulati P, Brûlé S, Viollet B, et al. Metformin, independent of AMPK, inhibits mTORC1 in a rag GTPase-dependent manner. Cell metabolism 2010;11:390-401.
37.Pernicova I, Korbonits M. Metformin [mdash] mode of action and clinical implications for diabetes and cancer. Nature Reviews Endocrinology
2014;10:143-56.
38.Pollak M. Potential applications for biguanides in oncology. The Journal of clinical investigation 2013;123:3693.
39.Sahra IB, Regazzetti C, Robert G, Laurent K, Le Marchand-Brustel Y, Auberger P, et al. Metformin, independent of AMPK, induces mTOR inhibition and cell-cycle arrest through REDD1. Cancer research 2011;71:4366-72.
40.Scott DA, Richardson AD, Filipp FV, Knutzen CA, Chiang GG, Ronai ZA, et al. Comparative metabolic flux profiling of melanoma cell lines: beyond the Warburg effect. J Biol Chem 2011;286:42626-34.
41.Galli R, Binda E, Orfanelli U, Cipelletti B, Gritti A, De Vitis S, et al. Isolation and characterization of tumorigenic, stem-like neural precursors from human glioblastoma. Cancer research 2004;64:7011-21.
42.Magee JA, Piskounova E, Morrison SJ. Cancer stem cells: impact, heterogeneity, and uncertainty. Cancer cell 2012;21:283-96.
43.Janiszewska M, Suvà ML, Riggi N, Houtkooper RH, Auwerx J, Clément-Schatlo V, et al. Imp2 controls oxidative phosphorylation and is crucial for preserving glioblastoma cancer stem cells. Genes & development 2012;26:1926-44.
44.Martinez-Outschoorn UE, Prisco M, Ertel A, Tsirigos A, Lin Z, Pavlides S, et al. Ketones and lactate increase cancer cell “stemness,” driving recurrence, metastasis and poor clinical outcome in breast cancer: achieving personalized medicine via Metabolo-Genomics. Cell cycle 2011;10:1271-86. 45.Vlashi E, Lagadec C, Vergnes L, Matsutani T, Masui K, Poulou M, et al.
Metabolic state of glioma stem cells and nontumorigenic cells. Proceedings of the National Academy of Sciences 2011;108:16062-7.
46.Liu X, Chhipa RR, Pooya S, Wortman M, Yachyshin S, Chow LM, et al. Discrete mechanisms of mTOR and cell cycle regulation by AMPK agonists independent of AMPK. Proceedings of the National Academy of Sciences
2014;111:E435-E44.
47.Korkaya H, Paulson A, Iovino F, Wicha MS. HER2 regulates the mammary stem/progenitor cell population driving tumorigenesis and invasion. Oncogene 2008;27:6120-30.
48.Sheridan C, Kishimoto H, Fuchs RK, Mehrotra S, Bhat-Nakshatri P, Turner CH, et al. CD44+/CD24-breast cancer cells exhibit enhanced invasive properties: an early step necessary for metastasis. Breast Cancer Res 2006;8:R59.
49.Wicha MS, Liu S, Dontu G. Cancer stem cells: an old idea—a paradigm shift. Cancer research 2006;66:1883-90.
50.Kaufman L, Brangwynne C, Kasza K, Filippidi E, Gordon VD, Deisboeck T, et al. Glioma expansion in collagen I matrices: analyzing collagen concentration-dependent growth and motility patterns. Biophysical journal 2005;89:635-50.
51.Bao B, Wang Z, Ali S, Ahmad A, Azmi AS, Sarkar SH, et al. Metformin inhibits cell proliferation, migration and invasion by attenuating CSC function mediated by deregulating miRNAs in pancreatic cancer cells. Cancer prevention research 2012;5:355-64.
52.Aldea MD, Petrushev B, Soritau O, Tomuleasa CI, Berindan-Neagoe I, Filip AG, et al. Metformin plus sorafenib highly impacts temozolomideresistant glioblastoma stem-like cells. J BUON 2014;19:502-11.
53.Kast R, Karpel‐Massler G, Halatsch ME. Can the therapeutic effects of temozolomide be potentiated by stimulating AMP‐activated protein kinase with olanzepine and metformin? British journal of pharmacology 2011;164:1393-6.
54.Soritau O, Tomuleasa C, Aldea M, Petrushev B, Susman S, Gheban D, et al. Metformin plus temozolomide-based chemotherapy as adjuvant treatment for WHO grade III and IV malignant gliomas. Journal of BU ON.: official journal of the Balkan Union of Oncology 2010;16:282-9.
ABSTRACT (IN KOREAN)
2-Deoxyglucose와 metformin 병합요법에 의한 교모세포종
종양구의 억제
<지도교수 김 선 호 >
연세대학교 대학원 의학과
김 의 현
목적: 교모세포종 (glioblastoma)의 완치가 어렵고 결국 재발하는 이유는, 여러 가지 치료법에도 생존할 수 있는 종양세포가 존재하기 때문이다. 종양세포 내에 존재하는 여러 가지 에너지 발생 경로를 차단함으로써 다양한 종양을 효과적으로 억제할 수 있다는 것이 보고되고 있다. 하지만, 이러한 효과가 교모세포종의 종양구 (tumorsphere)에 대하여 증명된 적은 없다. 저자들은 해당과정 (glycolysis)와 산화적인산화 과정 (oxidative phosphorylation)을 동시에 차단함으로 교모세포종 종양구를 억제할 수 있을 것이라는 가정 하에 본 연구를 진행하였다. 재료 및 방법: 저자들은 해당과정을 억제하는 2-deoxyglucose (2DG)와 산화적인산화 과정을 억제하는 metformin 및 그 병합용법에 대하여 교모세포종 종양구 억제에 대한 효과를 확인하였다. 먼저 세포 독성 및 AMP-activated protein kinase (AMPK)와 mammalian target of rapamycin (mTOR) 경로에 관련된 단백질에 대한 발현을 확인하였다. 또한, 병합요법이 교모세포종 종양구의 줄기세포능 및 침윤에 대해 미치는 영향을 종양구 형성 실험과 3D 배양 장치를 사용하여 확인하였다. 또한18fluorodeoxyglucose를 이용한 양전자 단층촬영 (positron emission
tomography)를 통하여 포도당 대사의 변화를 관찰하였다. 그리고, 전사체 (transcriptome) 분석을 통해 병합용법 전후의 유전자의 변화를 확인하였다. 마지막으로 동물실험을 통한 생체 내 실험을 통하여 종양 형성 능력 및
침윤 능력, 그리고 생존에 대한 분석을 시행하였다. 결과: 교모세포종 종양구에 대한 세포독성은 2DG와 metformin, 그리고 이 둘의 병항요법에도 억제되지 않았다. 주목할 것은, 일반적으로 알려진 mTOR 경로의 억제가 AMPK와의 관련성 없이 관찰되었다는 점이다. 종양구의 형성 능력은 병합요법에서 유의하게 감소하는 것으로 나타났으며, 줄기세포능과 관련된 단백질들의 발현도 유의하게 감소되었다. 종양구의 침윤 능력 역시 병합요법에 의해 유의하게 억제됨을 확인하였다. 양전자 단층촬영을 통하여 병합요법에서 포도당과 관련된 대사 과정이 유의하게 저하되어 있음을 확인하였다. 전사체 분석을 통하여 병합요법 후에 종양에서 세포외 기질 (extracellular matrix)과 세포부착 (adhesion)에 관련된 유전자들의 전사가 억제됨을 확인하였다. 마지막으로, 동물실험을 통하여 2DG와 metformin의 병합요법이 교모세포종의 종양구 침윤 능력을 억제하고, 생존기간을 증가시킴을 확인하였다. 결론: 2DG와 metformin의 병합요법은 교모세포종 종양구에 대하여 종양사멸 효과는 보이지 않았으나, 종양구의 줄기세포능과 침윤 능력을 효과적으로 억세하며, 동물 실험에서 생존기간의 증가까지 보일 수 있음이 확인되었다. 저자들은 주된 세포내 에너지 생성 경로인 해당과정과 산화적인산화 과정을 동시에 차단하는 방법이 교모세포종에 있어 새로운 치료적 접근법이 될 수 있다는 가능성을 확인하였다.