저작자표시-비영리-변경금지 2.0 대한민국 이용자는 아래의 조건을 따르는 경우에 한하여 자유롭게 l 이 저작물을 복제, 배포, 전송, 전시, 공연 및 방송할 수 있습니다. 다음과 같은 조건을 따라야 합니다: l 귀하는, 이 저작물의 재이용이나 배포의 경우, 이 저작물에 적용된 이용허락조건 을 명확하게 나타내어야 합니다. l 저작권자로부터 별도의 허가를 받으면 이러한 조건들은 적용되지 않습니다. 저작권법에 따른 이용자의 권리는 위의 내용에 의하여 영향을 받지 않습니다. 이것은 이용허락규약(Legal Code)을 이해하기 쉽게 요약한 것입니다. Disclaimer 저작자표시. 귀하는 원저작자를 표시하여야 합니다. 비영리. 귀하는 이 저작물을 영리 목적으로 이용할 수 없습니다. 변경금지. 귀하는 이 저작물을 개작, 변형 또는 가공할 수 없습니다.
A THESIS
FOR THE DEGREE OF MASTER OF SCIENCE
ISOLATION OF ANTIOXIDANT AND ANTI-INFLAMMATORY
NATURAL COMPOUNDS FROM SRI LANKAN MARINE ALGA:
Pdina commersonii
H.H. CHAMINDA LAKMAL
DEPARTMENT OF MARINE LIFE SCIENCES
GRADUATE SCHOOL
JEJU NATIONAL UNIVERSITY
FEBRUARY, 2015
i
CONTENTS
SUMMARY IV
LIST OF FIGURE VII
LIST OF TABLE X
1. INTRODUCTION 1
1.1.Medicinal natural products 3
1.2.Marine natural products 4
1.3.Availability of seaweed and studies in Sri Lanka 5 1.4.Brown seaweed Padina commersonii 8
1.5.Reactive Oxygen species 9
1.6.Importance of natural antioxidant 12 1.7.Inflammation and importance of anti-inflammatory natural products 13
2. METERIALS AND METHODS 14
2.1. Chemicals and reagents 14
2.2. Sample collection 14
2.3. Extraction of 80 % crude methanol extract 15 2.4. Fractionation of the 80 % methanol crude extract 15
2.5. Sample preparation 16
2.6. Determination of total phenolic content 16 2.7. DPPH radical scavenging assay 16 2.8. Hydroxyl radical scavenging assay 17 2.9. Alkyl radical scavenging assay 19
2.10. Cell cultures 19
2.11. Determination of sample toxicity on Vero Cells 20 2.12. Determination of anti-inflammatory activity by measurement of NO 20
ii
concentration on RAW 264.7 cells
2.13. Thin Layer Chromatography (TLC) analysis of PCE 21 2.14. Open column fractionation of the PCE 22 2.15. Radical scavenging activity assessment of the open column eluted fractions of
PCE
22
2.16. Anti-inflammatory activity assessment of the open column eluted fraction of PCE
22
2.17. HPLC analysis of the open column eluted fractions 23 2.18. Investigation of antioxidant activity by the ABTS+ Online HPLC 23 2.19. High Performance Centrifugal Partition Chromatographic Solvent System 25 2.20. Centrifugal Partition Chromatographic Separation 26 2.21. NMR spectroscopy of the Compounds 28
2.22. LC-MS/MS analysis 28
2.23. Sample toxicity on Vero cells 28 2.24. Antioxidant activity on Vero cells 29 2.25. Assessment of intracellular H2O2 scavenging ability of compounds by
DCF-DA assay
29
2.26. Evaluation of apoptotic body formation by nuclear staining with Hoechest 33342
30
2.27. Origin and maintenance of the zebrafish 30 2.28. Waterborne exposure of compounds and hydrogen peroxide to the embryos 31 2.29. Measurement of heart rate and survival rate 31 2.30. Intracellular ROS and cell death estimation in zebrafish embros 31
2.31. Statistical analysis 32
iii
3.1. Total phenolic content 33 3.2. DPPH radical scavenging activity 34 3.3. Hydroxyl radical scavenging activity 34 3.4. Alkyl radical scavenging activity 35 3.5. Anti-inflammatory activity by measurement of concentration on RAW 264.7
macrophages
38
3.6. Thin Layer Chromatographic analysis of PCE 41 3.7. Reverse phase open column fractionation of the PCE 43 3.8. Radical scavenging activity of the open column eluted fractions of PCE 45 3.9. Anti-inflammatory activity of the open column eluted fractions of PCE 45 3.10. HPLC investigation of PCE and Column fractions 49 3.11. Investigation of antioxidant activity by the ABTS+ onlie HPLC 49 3.12. Determination of High performance Cenrifugal Partitiom chromatographic
solvent system and preparative isolation of the compounds
52
3.13. NMR spectroscopy of the compounds 56 3.14. LC/MS/MS analysis of the compounds 56 3.15. Sample toxicity of compounds on Vero cells. 62 3.16. Antioxidant activity assay on Vero cells 62 3.17. Evaluation of apoptotic body formation by nuclear staining with Hoechest
33342
65
3.18. Heart rate and survival rate of zebrafish under oxidative stress 67 3.19. ROS generation and cell death estimation in zebrafish under oxidative stress 70
4. CONCLUSION 73
REFERENCES 74
iv
Summary
This study was collaborative research project with Faculty of Science, University of Colombo, Sri Lanka and Marine Bio-resource Technology Laboratory, Marine Life Sciences, Jeju National University, Republic of Korea. Sri Lankan University was kindly gave us the seaweed sample or crude extract to evaluate the biological activity and isolate the active compounds. Among those samples Padina commersonii, (PC) brown algae selected for this study. PC was extracted to the 80 % methanol and get the crude extract. Crude extract was fractionate using organic solvent such as hexane, chloroform, ethyl acetate and remaining one considered as water fraction and they were named as PCH, PCC, PCE and PCW in respectively. Total phenolic content was estimated for these four fractions. Anti oxidant activity was evaluated using three types of radicals, DPPH, hydroxyl and alkyl by ESR technique. According to the results PCE was shown high amount of total poly phenol content and low IC50 values for the all three radical scavenging activities. They were 7.44 ± 0.29
GAE mg/G for the total phenolic content and 0.71±0.03 mg/mL for the DPPH radical scavenging, 0.017±0.001 mg/mL for alkyl radical scavenging and 0.25±0.06 mg/mL for the hydroxyl radical scavenging activity. Furthermore all four fractions were screen for the anti-inflammatory activity by checking the inhibition of the NO production in sample pre treated LPS induced RAW 264.7 macrophages and cell viabilities were measured after 24 h. PCE was recorded 26.14±0.9 µg/mL as low IC50 value without toxicity. PCE was exhibited better
activities compared to the other three fractions and it was selected for further purification. TLC experiment was carried out to find out the best mobile phase condition for the RP-open column fractionation and 70 %, 80 %, 90% and 100 % methanol selected as suitable mobile phase condition for RP-open column fractionation and four fractions were obtained and named as PCEF1, PCEF2, PCEF3 and PCEF4 and checked antioxidant and anti-inflammatory activities. PCEF1 and PCEF2 were shown better results for the both radical scavenging and anti-inflammatory activities with 0.014±0.00 mg/mL DPPH radical
v
scavenging , 0.01±0.001 mg/mL for alkyl radical scavenging, 0.100±0.003 mg/mL for hydroxyl radical scavenging and 44.11±2.3 µg/mL for inhibition of NO production as IC50
values. After that all four column eluted fraction were analyzed by RP-HPLC and according to the results PCEF1 and PCEF2 were shown same chromatogram with different concentration. Therefore PCEF1 and PCEF2 were combined together and named as PCEF-A. Partition coefficients values between top and bottom phase of the CPC different solvents were calculated by RP-HPLC and 1:11:2:8 of hexane:ethyl acetate:methanol: water ratio was shown better separation in K values and it was selected for the suitable solvent system for the CPC preparative separation. After elution from the CPC 120 fractions were obtained and each other fractions were analyzed by RP-HPLC and identified the same fractions and pooled them together. Depending on the results there we three partially pure compounds and they were subjected to the further activity checking. That three compounds were named as PCEF-A-1, PCEF-A-2 and PCEF-A-3. They were tested for the sample toxicity by treating with different concentration on Vero cells and checking by cell viability. According to the results all three compounds were not observed sample toxicity for the tested concentration. All three compounds were tested for the intracellular ROS scavenging activity by treating on Vero cells and after 1 h treated with H2O2 and scavenging ability of the H2O2 was evaluated by
DCFDA assay and PCEF-A-1 was recorded better ROS scavenging activity compared to other two compound. In addition cell viabilities were calculated under H2O2 oxidative stress
and to that pre sample treated Vero cell were treated with H2O2 and incubated for 24 h and
checked the cell viabilities and PCEF-A-1 was shown protective effect under H2O2 oxidative
stress. In addition compounds were tested for the apoptotic body formation in Vero cells. All these compounds were shown low number of apoptotic body with high amount cell population at high concentration and at low concentration all three compounds wee shown low cell population and high number of apoptotic body formation. Furthermore all three
vi
compounds tested for antioxidant activities in zbrafish embryos and PCEF-A-1 was shown protective effect in zebrafish.
vii
List of figures
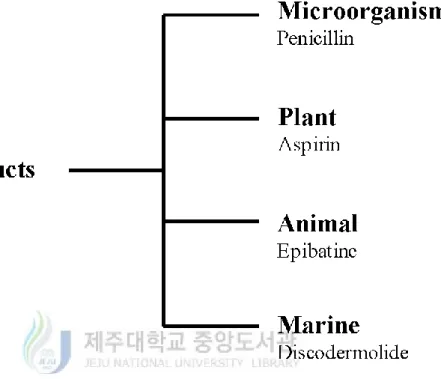
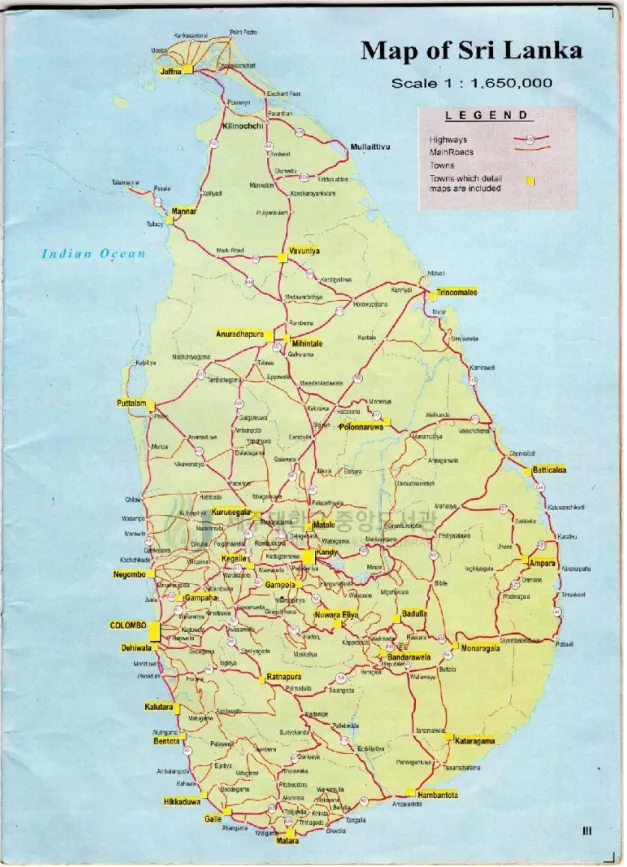
Figure 01. Origin of medicinal natural products from different sources. Fig 02: Map of Sri Lanka
Figure 03. Padina commersonii
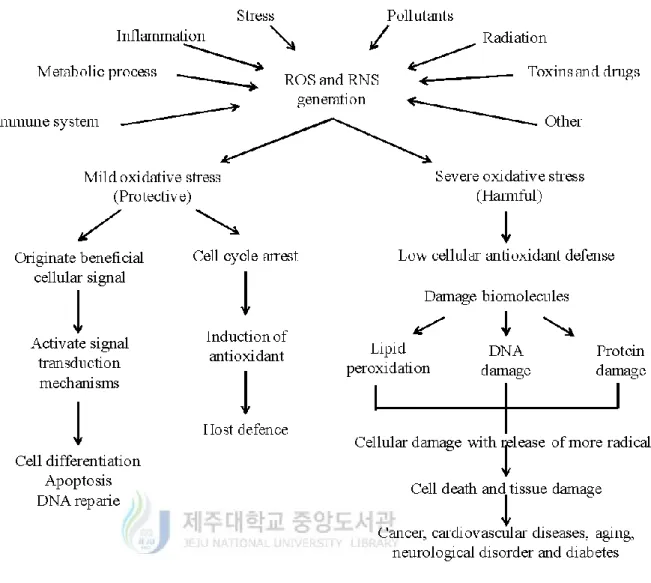
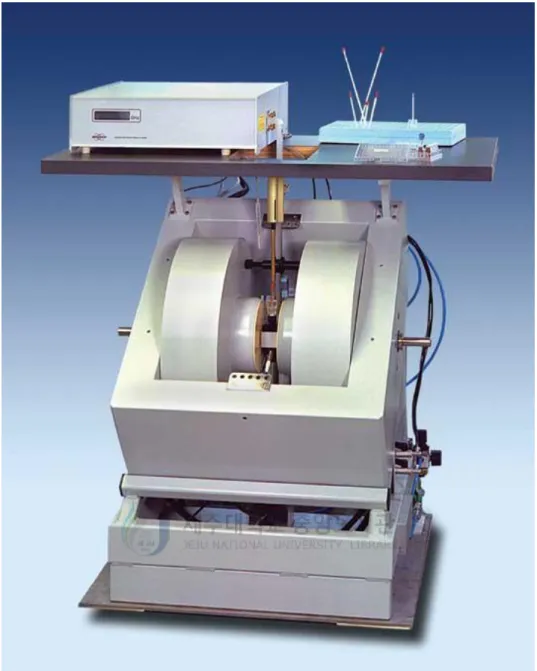
Figure 04. Causes of ROS generation and protective effect and harmful effects of ROS Figure 05. Electron Resonance Spectrometer
Figure 06. Instrumentation of Online High Performance Liquid Chromatography Figure 07. Instrumentation of the Centrifugal Partition Chromatography
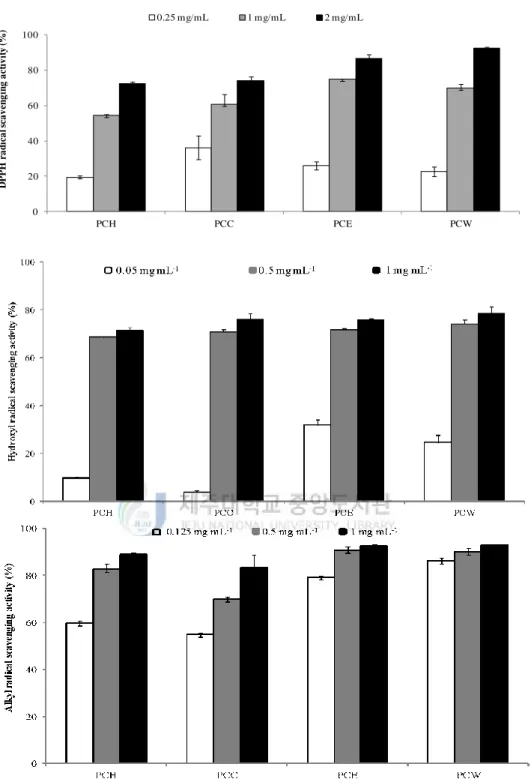
Figure 08. Radical scavenging activity of the fractions of PCH,PCC, PCE and PCW (A) DPPH radical scavenging activity (B) Hydroxyl radical scavenging activity (C) Alkyl radical scavenging activity.
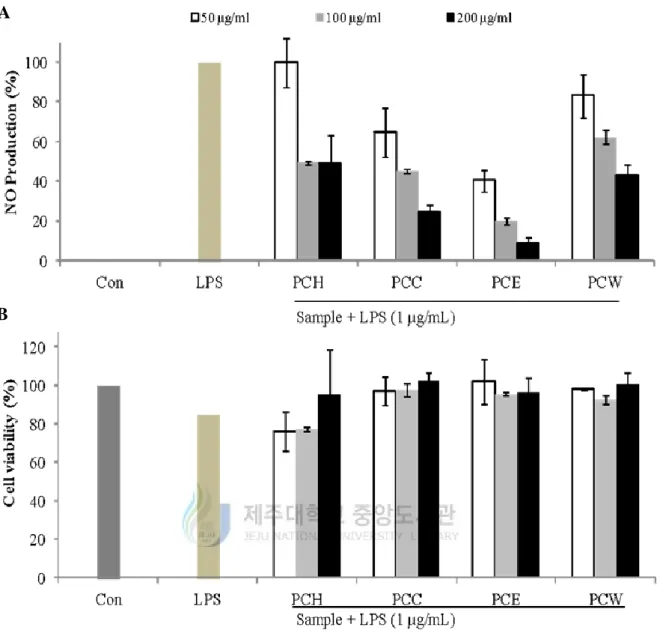
Figure 09. Inhibitory effect of NO production of fractions of PCH, PCC, PCE and PCW in LPS induced R aw 264.7 macrophages. Cells were incubated with LPS for 24 h presence or absence of desire fraction. (A) production of NO was quantified compared to the LPS treated group and (B) cell viability was calculated compared to the control.
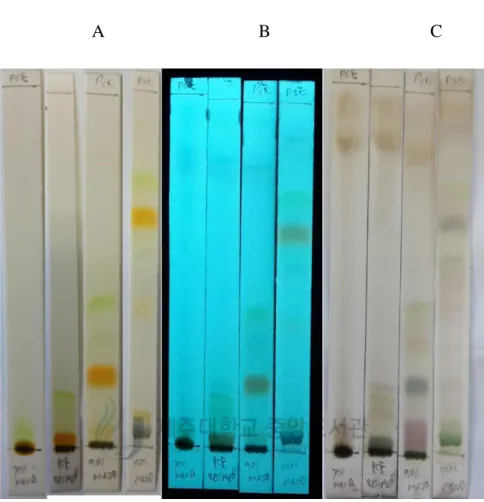
Figure 10. TLC chromatograph of the PCE in different solvent condition (A) observed under naked eye (B) under 254 nm UV radiation (C) heat with sulfuric and ethanol staining reagent.
Figure 11. Radical scavenging activity of PR column eluted fractions
PCEF1,PCEF2,PCEF3 and PCEF4 (A) DPPH radical scavenging activity (B) Hydroxyl radical scavenging activity (C) Alkyl radical scavenging activity.
viii
Figure 12. Inhibitory effect of NO production of PR column eluted fractions
PCEF1,PCEF2,PCEF3 and PCEF4 in LPS induced R aw 264.7 macrophages. Cells were incubated with LPS for 24 h presence or absence of desire fraction. (A) production of NO was quantified compared to the LPS treated group and (B) cell viability was calculated compared to the control.
Figure 13. RP-HPLC Chromatograph (A) PCE and open column eluted Fractions (B)PCEF1 (C)PCEF2 (D)PCEF3 (E) PCEF4 ,gradient flow mobile phase condition 10 % ACN and 90 % DW at 0 min and 60 % CAN and 40 % DW until 50 min and 100 % ACN at 60 min to 80 min , 3µm, 3.0×150 nm Atlantis®T3 and detector wave length 230 nm.
Figure 14. Online HPLC chromatogram. (A) RP-HPLC chromatogram (B) ABTS+ absorption spectrum. RP-HPLC chromatogram couple with ABTS+ spectrum to trace the antioxidant compounds available in PCEF-A fraction.
Figure 15. Determination of partition coefficient of the each and every peak appear in RP-HPLC chromatogram between top phase and bottom phase of different types of CPC solvent system.
Figure 16. Comparision of partially purified compound from PCEF-A by CPC with PCE. (A) Chromatogram of PCE(B) Chromatogram of PCEF-A-1 (C)
Chromatogram of PCEF-A-2 (D) Chromatogram of PCEF-A-3 Figure 17. Proton NMR spectrum of PCE-A-1
Figure 18. Proton NMR spectrum of PCE-A-2 Figure 19. Proton NMR spectrum of PCE-A-3 Figure 20: LCMS spectrum PCE-A-1
ix
Figure 21: LCMS spectrum PCE-A-3
Figure 22. Sample toxicity of the compounds on Vero cells after 24 h incubation. Figure 23. Intracellular ROS scavenging activity of PCEF-A1, PCEF-A2 and PCEF-A3
evaluation on Vero cell. (A). Amount of ROS scavenging activity by DCFDA assay. (B) Cell viability under H2O2 oxidative stress.
Figure 24. Apoptotic body formation under H2O2 oxidative stress.
Figure 25. Heart rate of sample pre-treated zebrafish under H2O2 oxidative stress (A)
PCE-A-1 (B) PCE-A-2
Figure 26. Survival rate of sample pre-treated zebrafish under H2O2 oxidative stress (A)
PCE-A-1 (B) PCE-A-2
Figure 27. ROS generation in PCE-A-1 pre-treated zebrafish (A) photo graph under fluorescence microscope (B) level of ROS generation in zebrafish
Figure 28. ROS generation in PCE-A-2 pre-treated zebrafish (A) photo graph under fluorescence microscope (B) level of ROS generation in zebrafish
Figure 29. Cell death in PCE-A-1 pre-treated zebrafish (A) photo graph under fluorescence microscope (B) level of ROS generation in zebrafish
Figure 30. Cell death in PCE-A-2 pre-treated zebrafish (A) photo graph under fluorescence microscope (B) level of ROS generation in zebrafish
x
List of Tables
Table 01. Total phenolic content and IC50 values of the radical scavenging activity of the fractionated Padina commersonii
Table 02. Weight of the RP-open column eluted fractions of PCE with mobile phase Table 03. IC50 values of the radical scavenging activity and NO production inhibition of
2
1. Introduction
1.1. Medicinal natural products
Natural products are derived from metabolites and/ or by-products of living beings such as microorganisms, plants and animals and it is shown in Figure 01. These natural products have been developed as medicines for human usage since thousands years ago these natural compounds are used to cure diseases (Strobel and Daisy 2003). Aspirin (salicylic acid) is the world best known and most universally used medicine which is derived from naturally available glycosides salicin. Aspirin is found in several species of genera salix and Populus (Mahdi et al. 2006). Penicillin is another well known example for the natural origin broad spectrum antibacterial agent. Strong analgesics epibatine was isolated from the skin of the Equadorian poison-arrow frog Epipedobates tricolor which is twenty times more potent than morphine (Traynor 1998). Furthermore discodermolide was isolated from marine sponge and it is exhibited several pharmacological activities such as anti-inflammatory, antiproliferative and neuroprotectve activities (Hung et al. 1996). Still the belief is that natural biological resources are most crucial reservoirs for essential natural products with useful bioactivities. It is due to because of the occurrence of large diversity of natural compounds available with these resources.
3
4
1.2. Marine natural products
Planet Earth is unique and a tremendous planet found in the universe. It provides shelter for vast variety of ecosystem. Basically there are three major types of ecosystem can be found in planet Earth. They are, Terrestrial, Fresh water and marine ecosystems. Those ecosystems are consisted of huge diversity of animals and plants. Terrestrial and fresh water ecosystems are much studied by researches and still marine ecosystems is unexplored entirely and untouched. Nearly 70 % of the earth surface is covered by the ocean. The ocean riches with a vast diversity of marine organisms and hence it is known as marine ecological system. It contains different types of microorganisms, vertebrate and invertebrate animals, higher plants and algae (Wijesekara et al. 2011). Algae are type of plants available in sea, which are well diverse and can be divided into different types of groups, considering their size basically. Hence they are categorized into unicellular, microalgae and macroalgae which may be grown up to 100 or 150 feet in length (Witvrouw and De Clercq 1997). Furthermore algae are divided into three main groups, green algae (Chlorophyceae), brown algae (Phaeophyceae) and red algae (Rhodophyceae) according to various types of pigments presences in their cells(Wijesinghe and Jeon 2012). Some types of algae are considered as edible and therefore some nations consume these edible algae with their regular diets.
Marine algae contain a vast variety of bio-molecules. Among these biomolecules, some molecules are important for the survival of the living organisms. For an example carbohydrates, lipids, proteins and nucleic acids are known as primary metabolites and these compounds are important in producing essential cellular building blocks, such as cell walls, DNAs, cell membranes etc. in living organisms. Some biomolecules have much more limited distribution in the nature and encountered in specific group of organisms, and known as secondary metabolites. Secondary metabolites are synthesized in living cells for some specific reasons, such as acting as toxic materials which give protection against predators and
5
catch preys, colouring agents to attract some or other organisms or worn to predators or other species and overcome the extreme environmental condition. In addition to above facts, marine algae live in very extreme enviornment condition such as expose to intense sun light and radiation, high salinity and high temperature. In order to adapt to these extreme harsh environment conditions, algae are synthesized vast variety of secondary metabolites which are have some specific biological function and pharmacological properties such as antioxidant, anticancer, anti-inflammatory, antidiabetic and antimicrobial etc..( Marimuthu et al. 2012).
1.3. Availability of seaweed and studies in Sri Lanka.
Sri Lanka is a small south Asian country , an island which is located in the Indian ocean close to south tip of India. The geographical coordinates are from 90 50’ to 50 55’ N latitude and 810 53’ to 790 31’ E longitude (Illanasinhe et al. 1999) and it is shown in Figure 02. Sri Lanka consists of approximately a 1700 km long coastal line and along this costal line many seaweed varieties are found. Several researchers have identified about 320 different seaweeds species belong to different families (Durairatnam 1961, Borton 1903; Boergensen 1936). Ceylon Fisheries Research station was initiated first survey on the seaweeds along the coastal line of the island. Population of the seaweeds are extensively found in Jaffna, Palk Strait, Gulf of Mannar, Pearl bank of Silarathurai and along the southwest coast of Sri Lanka extending from Ambalangoda to Galle. However, Sri Lankan seaweeds have not studied in a widespread way and deeply and only a few number of literatures were found regarding the studies of Sri Lankan seaweeds. Among them, one collaborative project of University of Colombo, University of Jaffna and Tokyo Institute, Japan investigated the amount of sterols by Gas Chromatograpy-Mass Spectrometry (GC-MS) in 18 Sri Lankan marine algal species (Mahendran et al. 1980). In addition, crude extract of Sri Lankan marine red algae, Gelidiella
6
acerosa was studied by Premekumara et al. and reported studies on the post-coital
contraceptive mechanism (Premakumara et al 1995). Moreover, study on isolation of non-steroidal contragestative agent from Sri Lankan marine red algae Gelidiella acerosa was reported by Premekumara et al.(Premakumara et al 1996). In addition to that, Gelidiella
acerosa was further studied by Premekumara et al. and reported about human sperm motility
stimulating activity of a sulfono glycolipid isolated from Sri Lankan marine red alga
7
8
1.4. Brown seaweed Padina commersonii
Figure 03. Padina commersonii
Padina commersonii is a brown seaweed which is found in Sri Lankan coastal line. It widely
distributes throughout the tropic and Padina can be identifying by its ear like appearance. Ear like blades are circintely rolled to inside at the apical margin (Geraldino et al. 2005). It is shown in Figure 03. Some classification details of the Padina commerspnii are given according to the data base of algae base.
Empire – Eukaryota Kingdom- Chromista Class- Phaeophyceae Subclass – Dictyotophycidae Order – Dictyotales Family- Dictyotaceae Tribe – Zonarieae Genus – Pdina
9
1.5. Reactive Oxygen species
Oxygen is an essential element for the every living being since began the life on earth planet. Oxygen is used by the living cells in energy production by aerobic respirationand free radicals are formed as a result of ATP (adenosine triphosphate) synthesis by mitochondria in aerobic respiration. Reactive oxygen species (ROS) and reactive nitrogen species (RNS) are forming as a result of cellular redox process. ROS and RNS are playing dual character in human body as both beneficial and toxic effects. ROS and RNS exhibit beneficial effects on cellular redox signaling and immune function at low or moderate level. Intracellular messaging in cell differentiation and cell progression or the arrest of the growth, apoptosis, immunity and defense against microorganisms are some beneficial effect of ROS and RNS (Mates et al. 1999). But they are damaging the cellular structure and cellular function and produce oxidative stress that is harmful to the living organisms at high amount or inadequate removal from cellular system (Sen S and Chakraborthy, R. 2011). Most of ROS and RNS are containing one or two unpaired electron in the outer orbit and they are commonly known as free radicals which are very unstable and very reactive in their nature. Superoxides (O2
.-), hydroxyl (.OH), peroxyl (ROO.), lipdperoxyl (LOO.), alkoxyl (RO.) are the example for the ROS species and nitric oxide (NO.) and nitrogen dioxide (NO2) are the examples for the RNS
(Irshad, M and Chaudhuri, 2002; Sen S and Chakraborthy, R. 2011; Kunmar A and Priyadarsini K.I. 2011). Some of these oxygen and nitrogen free radicals are converted to non radical reactive species which are also cause harmful effects in human body. They are hydrogen peroxide (H2O2), ozone (O3), singlet oxygen (1O2), hypochlorous acid (HOCl) and
lipid peroxide and they are known as oxidant and they capable to disrupt the cellular components and biological functions. ROS and RNS are produced in animals under physiological and pathological conditions. Some ROS and RNS generative physiological processes are listed below.
10
● Immune system: Oxy-radicals and ROS generated by some immune cells at the pathogenic invasions.
● Metabolic process: Macrophages, smooth muscle cells, platelets and metabolism of arachidonic acid produced during physiological process. During the aerobic respiration, mitochondria produce oxy-radicals and ROS as toxic waste.
● Inflammation: Neutrophils and macrophages produce free radicals after induction by cytokines.
● Stress: Metal and body stress cause to production of free radicals and some stress mediated hormones like cortisol and catecholamine induces the formation of free radicals.
● Pollutants: Air pollutants, chemical solvents and water pollutants induce the production of ROS as well as burning of organic materials during the cooking. ● Radiation: UV radiation, X-ray, gamma rays and microwave radiation able to induce
the ROS generation in the body.
● Toxins and drugs: Toxins like pesticides, herbicides and other toxins and some drugs like mitomycin C and chlorpromazine etc. elevate the level of ROS in the body. ● Other factors: Smoking, automobile exhausts and industrial exhausts able to produce
free radical in the body.
Different causes for ROS and RNS production and their protective and harmful effects are shown in Figure 04.
11
12
1.6. Importance of natural antioxidant.
Oxidative stress is occurred due to lost of the balance between ROS/RNS and cellular antioxidant systems. Superoxide dismutase (SOD), catalase (CAT), glutathione peroxidase (GPx) and glutathione reductase (GR) are known as cellular enzymatic antioxidant system and they play important role in the control of the ROS and RNS in the cells. Frailer of the cellular antioxidant system is lead to produce oxidative stress. Dilatory antioxidant is help to scavenge the excess ROS and RNS and bring back cells into its normal physiological condition( Matés et al. 1999). Antioxidants can exhibit their ROS and RNS scavenging activity or protective activity via different mechanisms. These mechanisms are; (a) capable to neutralize ROS or change the structure of ROS into nonreactive neutral form, (b) remove metal ions by chelating which are contributed to production of ROS such as Fe2+ ion, (c)disrupt the radical forming chain reactions and preventing the formation of free radicals, (d) capability to absorb the unpaired electron from the free radicals and energy and stabilized the system.(Sen and Chakaraboryty, 2011). People can consume dietary natural antioxidant as functional food, nutraceutical or herbal medicine. These dietary natural antioxidants might include vegetables, tea, fruits and wine etc. and having prophylactic properties against various diseases and bring back the disrupt cellular antioxidant system to physiological condition and preserved the balance ROS and cellular antioxidant system (Kunwar and Priyadarsini, 2011). Marine ecological system is not studied completely and it is considered as reservoir for natural product with beneficial pharmacological activities. Most of the natural product researchers pay their attention toward the marine ecosystem to find out the useful natural products especially from marine macro algae. Foran example, fucoxanthin was isolated by Kang et al.( 2014) from Ishige okamurae and evaluated the protective effect against high glucose induced oxidative stress in human umbilical vein endothelial cells and zebrafish model (Kang et al. 2014). Another study was reported that isolated polyphenol from marine brown alga Eclonia cava exhibit inhibition of histamine release.
13
1.7. Inflammation and importance of anti-inflammatory natural products.
Inflammation is a defensive response which is originating from the body against the tissue malfunction and pathogenic invention. Other hand inflammation is disrupted tissue homeostasis such as tissue destroying process that involves recruitment of blood derived products, such as plasma proteins, Fluid and leukocytes into the perturbed tissue. Toxic chemicals released during the inflammation process such as highly reactive oxygen species and nitrogen species (ROS and RNS) and various proteins. These substances are destructive to both pathogens and hosts essentially induced liquefaction of surrounding tissue to stave off microbial metastasis (Ashley et al. 2012). Collectively these effects lead to produced heat around inflammation area, swelling due to accumulation of fluid, redness due to vasodilatation, pain and loss of functions. Anti-inflammatory therapies are playing a major role to protect host from these undesirable destructive process and protect the homeostasis.
14
2. Material and methods
2.1. Chemical and reagents
The murine macrophage cell line (RAW 264.7), Kidney cells of African green monkey (Vero Cell) were purchased from the Korean Cell Line Bank (KCLB, Seoul, Korea). Roswell park memorial institute (RPMI-1640) medium, Dulbecco’s Modified Eagle’s Medium (DMEM), fetal bovine serum (FBS), and penicillin–streptomycin were purchased from Gibco/ BRL (Burlington, ON, Canada). 3-(4, 5-Dimethylthiazol-2-yl)-2, 5-diphenyltetrazolium bromide (MTT) and Dimethyl Sulfoxide (DMSO) were purchased from Sigma–Aldrich (St. Louis, MO, USA). All other chemicals and reagents used in these investigations were of analytical grade
2.2. Sample collection
Pdina commorsonii seaweeds samples were collected freshly from the sites of Beruwela and
Hikkaduwa coral reefs located in southern province of Sri Lanka. All seaweeds samples were washed with sea water to remove sand, washed with tap water to remove salt and epiphytes. Seaweeds samples were stored at -20 until utilized. Algae samples were identified according to the Coppejans et al 2009 and Durairatnam 1961. Herbarium specimen was safely stored at the Herbarium of University of Colombo, Sri Lanka.
15
2.3. Extraction of 80 % crude methanol extract
Lyophilized algae sample were grind to small particle and each of them were mixed with 80% methanol and sonicated for 90 min at 25 oC for three times and filtered through Whatman No:4 filter paper and combined all extracts. Solvent was removed under reduced pressure and got the crude extract. Crude extract was stored at -20 oC for further experiment.
2.4. Fractionation of the 80 % methanol crude extract
Dried 80 % methanol crude extract was fractionated according to the polarity with aid of organic solvents hexane, chloroform, ethyl acetate and water. Dried 80 % methanol crude extract was suspended and dissolved in distilled water and shaken with hexane for several times until hexane become colorless and combined the all hexane fractions together and dried under reduced pressure. Remaining water fraction was shaken with chloroform for several times until chloroform layer become colorless. Remaining water fraction was fractionated to ethyl acetate and remaining water fraction consider as water fraction. These hexane, chloroform, ethyl acetate and water fractions were labeled as PCH, PCC, PCE and PCW respectively. All fractions were dried under reduced pressure and used for further studies.
16
2.5. Sample preparation
PCH, PCC, PCE and PCW fractions were dissolved in dimethyl sulfoxide (DMSO) to prepare an 80 mg/mL stock solution. Stock solution was diluted with Dulbecco’s Phosphate Buffer saline (DPBS) to get the desired concentration and filtered using a 0.45 µm syringe filter prior to cell culture experiments.
2.6. Determination of total phenolic content
Total phenolic content was determined according to method described by Chandler and Dodds 1983 with some modification. Briefly, One milliliter of sample was mixed in a test tube containing 1 mL of 95% ethanol, 5 mL of distilled water, and 0.5 mL of 50% Folin– Ciocalteu reagent. The mixture was allowed to react for 5 min, and 1 mL of 5% Na2CO3 was
added, and it was mixed thoroughly and placed in the dark for 1 h. Absorbance was measured at 725 nm using an enzyme-linked immunosorbent assay (ELISA) microplate reader (Sunrise, Tecan Co.Ltd., Australia) . A gallic acid standard curve was obtained for the calibration of phenolic content.
2.7. DPPH radical scavenging assay
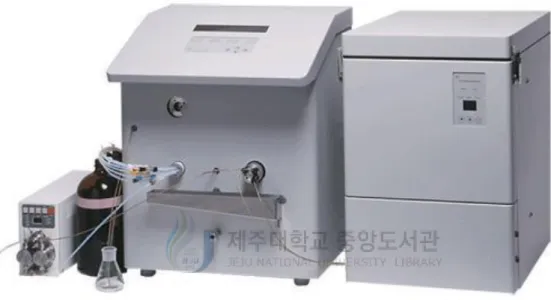
2,2-diphenyl-1-picrylhydrazyl (DPPH) is a free radical donor which can be detected via electron spin resonance (ESR) spectrometry (JES-FA machine, JOEL, Tokyo, Japan) by the (Figure 05) technique described by Nanjo et al. 1996. A 40 μL of each sample was added into 40 μL of DPPH (60 μmol/L) in ethanol. After 10 sec of vigorous mixing, the solutions were transferred into 50 μL glass capillary tubes and fitted into the cavity of the ESR spectrometer. The spin adduct was determined on JES-FA ESR spectrometer exactly 2 min later. The
17
measurement conditions were as follows: Power: 1 mW, Modulation frequency: 5 × 100 kHz, Modulation width: 0.8 mT, Sweep width: 10 mT, Sweep time: 30 sec, Temperature 298 K.
2.8. Hydroxyl radical scavenging assay
Hydroxyl radicals were generated via the Fenton reaction, and reacted rapidly with nitrone spin trap 5,5-Dimethyl-1-pyrroline-N-Oxide (DMPO); the resultant DMPO-OH adducts was detectable with an ESR spectrometer (Rosen and Rauckman 1984). The reaction mixtures containing 0.02 mL of 0.3 M DMPO, 0.02 mL of 10 mM FeSO4 and 0.02 mL of 10 mM
H2O2 were mixed with the tested samples 0.02 mL. The solution was then transferred into 50
μL glass capillary tube. The spin adduct was measured on an JES-FA ESR spectrometer exactly 2.5 min later. The measurement conditions were as follows: Power: 1 mW, Modulation frequency: 1 × 100 kHz, Modulation width: 0.2 mT, Sweep width: 10 mT, Sweep time: 30 sec, Temperature 298 K.
[Peak height of the control]
[Peak height of the control - Peak height of the sample ]
= 100
% DPPH radical scavenging activity
[Peak height of the control]
[Peak height of the control - Peak height of the sample ]
= 100
% Hydroxyl radical scavenging activity
18
19
2.9. Alkyl radical scavenging assay
Alkyl radicals were generated via 2,2’-azobis-2-methyl-propanimidamide (AAPH). The reaction mixture which was composited with 0.02 mL of deionized H2O, 0.02 mL of 40 mM
AAPH and 0.02 mL of 40 mM 4-pyridyl-1-oxide-tert-butyl- Nitrone (POBN) was mixed with 0.02 mL of tested samples. The solution was incubated for 30 min at 37°C in a water bath (Hiramoto et al. 1993), and transferred into 50 μL glass capillary tubes. The spin adduct was recorded on JES-FA ESR spectrometer. The appropriate measurement conditions were used as follows: Power: 1 mW, Modulation frequency: 5 × 100 kHz, Modulation width: 0.2 mT, Sweep width: 10 mT, Sweep time: 30 sec, Temperature 298 K.
2.10. Cell cultures
Mouse leukemic monocyte macrophage cell line (Raw 264.7) and Kidney cell of African green monkey (Vero) were purchased from Korean Cell Line Bank, Seoul, Korea. RAW 264.7 cells were cultured in growth medium of Dulecco’s Modified Eagle’s Medium (DMEM) and its containing 10% heat inactivated Fetal Bovine Serum (FBS), streptomycin (100 µg/mL), penicillin (100 unit/mL) and sodium pyruvate (110 mg/mL). DU145 cells were cultured in growth medium of RPMI and its containing 10% heat inactivated FBS, streptomycin (100 µg/mL), penicillin (100 unit/mL) and sodium pyruvate (110 mg/mL). The cells were incubated in 5% CO2/95% air at 37 oC.
[Peak height of the control]
[Peak height of the control - Peak height of the sample ]
= 100
% Alkyl radical scavenging activity
20
2.11. Determination of sample toxicity on Vero cells
Cell viability was estimated by 3-(4, 5-dimehyl-thiazol-2-yl) 2, 5-diphenyltetrazoium bromide (MTT) assay, which is a test of metabolic competence predicted upon the assessment of mitochondrial performance. The conversion of yellow tetrazolium bromide to its purple formazan derivative by mitochondrial succinate dehydrogenase in viable cells can determined as a colorimetric assay (Mosmann 1983). The Vero cells were seeded in 24-wells plate at a concentration of 2 × 10⁵ cells/well. After 24h, the cells were treated with the samples at different concentrations and incubated at 37 °C for 24 h. Then the MTT stock solutions (100 µL: 2 mg mL-1) was applied to the each well, to a total reaction volume of 500 µL. After 3 h incubation period, the supernatants were aspirated. The formazan crystals in each well were dissolved in 300 µL of DMSO, and the absorbance was measured by ELISA microplate reader at wave length of 540 nm. Relative cell viability was evaluated in accordance with the quantity of MTT converted to the insoluble formazan salt. The optical density of the formazan generated in the control cells were considered to 100% viability. The data are expressed as mean percentages of the viable calls versus the respective control.
2.12. Determination of anti-inflammatory activity by measurement of NO
concentration on RAW 264.7 Cells
The RAW 264.7 cells were seeded into 24-well plates at concentration of 2 × 10⁵ cells /well. After incubation of 24 h, cells were treated with different concentration of the relevant fraction of PC and incubated for 1h and treated with LPS (1 µg/mL) and further incubated for 24h. Control group was treated with the same volume of DPBS. The determination of NO concentration was carried out using Griess reagent (1:1 mixture of 1% of sulfanilamide in H3PO4 and 0.1% of naphthylethylenediamine dihydrochloride in 5% H3PO4) (Lee et al. 2007).
21
incubated for 10 min at room temperature. The optical density was measured at 540 nm using ELISA microplate reader. Finally the cell viability was tested and evaluated by the 3-(4, 5-dimehyl-thiazol-2-yl) 2, 5-diphenyltetrazoium bromide (MTT) assay. Each well was treated with 100 µL MTT reagent and incubated for 3 h. Culture media and remaining MTT reagent were aspirated without disturbing the formazan salt and attached cell at the bottom. The formazan crystals in each well were dissolved in 300 µL of DMSO, and absorbance was measured by ELISA microplate reader at wave length of 540 nm. Relative cell viability was evaluated in accordance with the quantity of MTT converted to the insoluble formazan salt. The optical density of the formazan generated in the control cells were considered to 100% viability. The data are expressed as mean percentages of the viable cells versus the respective control.
2.13. Thin Layer Chromatographic (TLC) analysis of PCE
Considering of the activity results, TLC analysis was carried out for the PCE. PCE was spotted on the reversed phase TLC and was run with different mobile phase system made up with different ratio of methanol and water. Mobile phase systems were 70%, 80%, 90% and 100% methanol. TLCs were observed under UV light and burnt the TLCs after treating with ethanol and sulfuric acid mixture at 100 oC and found out the optimum mobile phase condition for the open column separation.
% of nitric oxide
production
[Absorbance of the sample- Absorbance of the Control ] [Absorbance of LPS- Absorbance of the Control]
100 =
22
2.14. Open column fractionation of the PCE
PCE was further fractionated aid of ODS (Octadecyltrimethoxysilane) open column. ODS is a non-polar stationary phase and polar solvent use as the mobile phase. Polar compounds are eluting first through the column and non-polar compounds are eluting lately according to the affinity to the stationary phase. Weight of 860 mg of PCE was load in to the ODS open column and eluted with 70%, 80%, 90% and 100% methanol as mobile phase. All three fractions were evaporated under reduced pressure and fractions were labeled as 70% methanol fraction as PCEF1, 80% methanol fraction as PCEF2, 90% methanol fraction as PCEF3 and 100% methanol fraction as PCEF4 and measured the dried weight of the each fraction.
2.15. Radical scavenging activity assessment of the open column eluted
fractions of PCE
Radical scavenging activities of the PCEF1, PCEF2, PCEF3 and PCEF4 were evaluated by ESR technique using DPPH, hydroxyl and alkyl radicals same like method described at sections 2.7., 2.8., and 2.9.
2.16. Anti-inflammatory activity assessment of the open column eluted
fractions of PCE
Anti-inflammatory activity assessment of the PCEF1, PCEF2, PCEF3 and PCEF4 were evaluated by cell culture technique on Raw 264.7 macrophages same like method described at section 2.11.
23
2.17. HPLC analysis of the open column eluted fractions of PCE
PCE, PCEF1, PCEF2. PCEF3 and PCEF4 were investigated on RP-HPLC system equipped with binary Waters 515 pump, Waters 2489 UV/Vis and 2998 photodiode array (PDA) detector and Waters 2707 auto sampler (Waters, Mailford, MA 01757, USA). Volume of 10 µL injection of 5 mg/mL of sample was run at 0.2 mL/min flow rate on Atalantis T3 3µM 3.0 × 150 mm column (Waters, USA) using a gradient of Acetonitrile (ACN) and water (DW) solvent system, 0 – 50 min 10% ACN 90% DW, 50 -60 min 60% ACN 50% DW and 50- 70 min 100% ACN and detected wave length was 230 nm.
2.18. Investigation of antioxidant activity by the ABTS+Online HPLC
PCEF-A, PCEF3 and PCEF4 were investigated on ABTS+ online HPLC system (Figure 06) (Lee et al. 2013), Concentration of 2 mM of 2,2’-azinobis(3-ethylbenzobenzothiazoline -6-sulfonic acid) (ABTS) radical solution, containing 2.5 mM potassium persulfate was prepared and incubated overnight to stabilized the radical prior to use. High-performance liquid chromatography (HPLC) system, equipped with binary Waters 515 pump, Waters 2489 UV/Vis and 2998 photodiode array (PDA) detector and Waters 2707 auto sampler and HPLC is coupled with the interface ABTS+ radical analyzer (Waters, Mailford, MA 01757, USA). Volume of 10 µL injection of 5 mg/mL of sample was run at 0.2 mL/min flow rate on Atalantis T3 3µM 3.0 × 150 mm column (Waters, USA) using a gradient of Acetonitrile (ACN) and water (DW) solvent system, 0 – 50 min 10% ACN 90% DW, 50 -60 min 60% ACN 50% DW and 50- 70 min 100% ACN and detected wave length was 230 nm. Sample was eluted through the column and elution was sent to ‘T’ piece and reacted with ABST radical in reaction coil at 40 oC. Absorbance of the reaction mixture was measured as negative peak by UV/Vis detector at wave length of 680 nm.
24
25
2.19. Centrifugal Partition Chromatographic Solvent system
Total 2ml of two phase solvent system was prepared with Hexane: Ethyl Acetate: Methanol: Water (H:EA:Me:W) with different ratio. Solvent of H:EA:Me:W was mixed with desire ratio and kept some time for equilibrium and 500 µl of top phase and 500 µl of bottom phase was get in to 2 ml micro tube. Weight of 10 mg of PCEF-A was dissolved in the separated solvent mixture and shaken well. Micro tube was centrifuged for 5 min and 200 µl of to phase and 200 µl bottom phase was carefully separated in to separated vial and dried under reduced pressure. Dry matter of the each vials (top and bottom) were dissolved in 500 µl of methanol and analyzed by RP-HPLC. Volume of 10 µL injection of 5 mg/mL of sample was run at 0.2 mL/min flow rate on Atalantis T3 3µM 3.0 × 150 mm column (Waters, USA) using a gradient of Acetonitrile (ACN) and water (DW) solvent system, 0 – 50 min 10% ACN 90% DW, 50 -60 min 60% ACN 50% DW and 50- 70 min 100% ACN and detected with PDA detector. Concentration of the each compound separated in chromatogram is considered as proportional to the area under the curve in the HPLC chromatograph. Area under the curve was calculated for the each separate peak. Distribution coefficient (K value) was calculated for each separated chromatographic peak according to following equation to find out the best solvent ratio for the HPCPC separation. Calculated K values are shown in Figure 15. Most suitable solvent system was 1:11:2:8 of H:EA:Me:W for the for HPCPC isolstion.
[ Concentration in Bottom phase] [ Concentration in Top phase]
K = =
[Area under the curve in Bottom phase] [ Area under the curve in Top phase]
26
2.20. Centrifugal partition chromatography separation.
Centrifugal partition chromatography (CPC) (Figure 07) is the technique that uses two immiscible liquid phases for the separation and isolation of the compounds. One liquid phase is acted as a stationary phase while other liquid is acted as mobile phase. Stationary phase is kept holding by the aid of centrifugal force which was created by rotate/ spin the column at high speed. In this study, top phase was fed to the CPC column as stationary phase in descending mode at flow rate 5 mL/min without rotation of the column. Then rotation was started and brought up to 10000 rpm. Bottom phase was fed to the CPC column as mobile phase in descending mode at flolw rate of 2 mL/min with the rotation of the column. Mobile phase was run through the column for 2 h and back pressure was recorded. Eluted stationary phase was collected and measured during the during the 2h and calculated the remaining volume of stationary phase by deduct the volume of collected stationary during the mobile phase feeding from the total volume of the column. Here after dried PCEF1 was prepared for the injection to the column as follow. Volume of 1.5 mL of top phase and 1.5 mL of bottom phase were added to the PCEF1 and mixed well until completely dissolved and total volume was injected and loaded to the CPC column and run for 9 h. Eluted fractions were collected as 3 mL portions by fraction collector and each other collected vials were analyzed by RP-HPLC and same fractions were pooled together.
27
28
2.21. NMR spectroscopy of the compounds
Fourier transform nuclear magnetic resonance spectroscopy is giving promising spectroscopic data to elucidate the structure of the desire compound. Magnetic properties of the 13C isotope of the carbon atom and 1H isotope of the hydrogen atom are using this technique to record the spectrum. 1H and 13C NMR spectrums were recorded on JEOL DELTA-400 (400 MHz) spectrometer. Desire compound was dissolved in deuterated methanol and chemical shift of the spectrum was reported as δ relative to TMS as an internal standard.
2.22. LC/MS/MSanalysis
The molecular mass was measured using high performance liquid chromatography-diode array detector coupled with electro spray ionizing mass spectrometer (HPLC-DAD-ESI/MS) (Hewlett-Packard, Waldbronn, Germany).
2.23. Sample toxicity on Vero cells.
The vero cells were seeded into 24-wells plate at a concentration of 2 × 10⁵ cells/well. After 24h, the cells were treated with the samples at different concentrations and incubated at 37 °C for 24 h. Then the MTT stock solutions (100 µL: 2 mg mL-1) was applied to the each well, to a total reaction volume of 500 µL. After 3 h incubation period, the supernatant was aspirated. The formazan crystals in each well were dissolved in 300 µL of DMSO, and the absorbance was measured by ELISA microplate reader at wave length of 540 nm. Relative cell viability was evaluated in accordance with the quantity of MTT converted to the insoluble formazan salt. The optical density of the formazan generated in the control cells were considered to 100% viability. The data were expressed as a mean percentages of the viable cells versus the respective control.
29
2.24. Anti oxidant activity assay on Vero cells.
The Vero cells were seeded in 96-wells plate at a concentration of 2 × 10⁵ cells/well. After 24 h, the cells were treated with the samples at different concentrations and incubated at 37 °C for 1 h and treated with 20 mM H2O2 each well except control to provide the 1 mM H2O2 ROS level for the cells and incubated for 24 h. Then the MTT stock solutions (100 µL: 2 mg mL-1) was applied to the each well, to a total reaction volume of 500 µL. After 3 h incubation period, the supernatants were aspirated. The formazan crystals in each well were dissolved in 300 µL of DMSO, and the absorbance was measured by ELISA microplate reader at wave length of 540 nm. Relative cell viability was evaluated in accordance with the quantity of MTT converted to the insoluble formazan salt. The optical density of the formazan generated in the control cells were considered to 100% viability. The data are expressed as mean percentages of the viable cells versus the respective control.
Same procedure was followed to determine the cell viability under AAPH ROS stress except the treatment of H2O2 and each well was treated 200 mM AAPH to provide 10 mM AAPH oxidative stress for the cells. After 24 h incubation cell viability was determined by MTT assay.
2.25. Assessment of intracellular H2O2 scavenging ability of the compounds by
DCF-DA assay
Vero cells (2×10⁵/mL) were seeded into 96-well plate. The cells were treated with different concentrations of sample (10µL) after 24 h incubation period and cells were incubated for 30 min at 37 0C under humidified atmosphere. H2O2 (10µL) was treated with concentration of 0.5 mM and incubated for 3 h. DCF-DA (10µL) was added to the cells and incubated 30 min. DCE-DA treated 96-well plate with cells were placed in fluorescence plate reader with
30
temperature maintained at 37 0C and absorbance was measured at excitation wave length 485 nm and emission wave length 530 nm.
2.26. Evaluation of apoptotic body formation by nuclear staining with Hoechest
33342
The nuclear morphology of the cells was evaluated using the cell permeable DNA dye, Hoechst 33342. Homogeneously stained nuclei were indicated the viable cells and condensation and/ or fragmentation of chromatins were indicated the cell apoptosis. Vero cells (2×10⁵/mL) were plated into the 24-well plates and incubated for 24 h at 37 0C in humidified atmosphere. The cells were treated with 25 µl of different concentration of sample and incubate 1 h and 25µl of 0.5 mM H2O2 was added to the each well except control and
control was treated with DPBS. After 24 h incubation 1.5 µl of 10 mg/mL Hoechst 33342, a DNA-specific fluorescent dye, was added to the each well, followed by 10-min incubation at 37 0C. The stained cells were observed under a fluorescence microscope equipped with a CoolSNAP-Pro colour digital camera (Media Cybernetics, Carlsbad, CA) in order to examine the degree of nuclear condensation.
2.27. Origin and maintenance of the zebrafish
Adult zbrafish were purchased from a commercial dealer (Seoul aquarium, Seoul, Korea). Fish were kept ina 3 L acrylic tank at 28.5 oC with 14 h/ 10 h light-dark cycle. Zebrafish were fed 3 times/day 6 days/ week, with tetramin fake food supplemented with live Artemia salina. Embryos were obtained from natural spawning that induced in morning by turning on the light and embryos were collected completely within 30 min.
31
2.28. Waterborne exposure of compounds and hydrogen peroxide to the
embryos
Collected embryos were randomly selected and transferred to the individual well to having 15 embryos/well of a 24-well plate containing 475 µl embryo medium. Each well was treated with 25 µl of different concentration of desire compound and control group and positive control group were treated with 25 µl PBS. After 1 h incubation sample treated wells and positive control were treated with 25 µl of 5 mM H2O2 and control group treated with 25 µl
of PBS.
2.29. Measurement of heart rate and survival rate
Heart rate of both atrium and ventricle were measured 48 hpf after H2O2 induction by
counting and recording of the contraction of the ventricle under light microscope for 1 min. The survival rate was measured at 72 hpf after H2O2 induction by zebrafish embryo motility.
2.30. Intracellular ROS and cell death estimation in zebrafish embryos
Intracellular ROS generation was measured in zebrafish embryo by ROS sensitive probe dye 2’,7’-dichlorodihydrofluorescein diacetate (DCFH-DA). Intracellular ROS convert the non-fluorescent active DCFH-DA into highly non-fluorescent active dichlorofluorescein (DCFH). Cell death was determined in zebrafish by staining with acridine orange, nucleic acid specific metachromatic dye. It interacts with DNA and RNA by interaction or electrostatic attractions and visualized necrotic or apoptotic cells. Embryos were transferred to the 96-well plates at 2 dpf and treated with 20 µg/mL DCFH-DA and incubated for 1h. Another separate group was treated with 25 µg/mL acridine orange and incubated for 30 min. Then zebrafish embryos were rinsed with embryo medium and anaesthetized before observation under fluorescence
32
microscope. Fluorescence intensity was quantified using Perkin-Elmer LS-%B spectrofluorometer. The images of the stain embryos were observed under fluorescence microscope which was equipped with Moticam color digital camera.
2.31. Statistical analysis
All data were expressed as mean ± standard deviation of three determinations. Statistical comparison was performed via a one-way analysis of variance followed by Duncan’s multiple range test (DMRT). All values were evaluated more than 95 % confidence interval (P < 0.05).
33
3. Results and discussion
PC was extracted to the 80% methanol and dried under reduced pressure and get the crude extract. Then crude extract was fractionated according to the polarity with help of different types of organic solvents. They were hexane, chloroform, ethyl acetate and remaining one concider as a water fraction. Non-polar things are soluble in non-polar solvent and polar things are soluble in polar solvent according to the like dissolves like theory. (voet and voet) . Therefore, non-polar substances in the crude extract were dissolved in non-polar solvent like hexane and polar things are dissolved in polar solvents. Polarity index of the organic solvents are shown in Table 02 and substance in 80 % methanol extract was fractionated according to the polarity and extracted weights are shown in Table 02. These fractions were labelled as PCH for hexane fraction, PCC for chloroform fraction, PCE for ethyl acetate fraction and remaining one PCW for aqueous fraction. Then these fractions were subjected to the phytochemical analysis and screening of the bioactivities.
3.1. Total phenolic content
Phenolic or polyphenolic compound are widely distributed secondary metabolite in the plants. Large number of studies were reported that occurrence of polyphenolic compounds among the marine brown algae species. PC belongs to brown algae group and total phenollic content of the each fraction was quantified. The total polyphenol content of PCH, PCC, PCE and PCW fractions are shown in Table 01. They were 5.48±0.0 mg GAE/g, 6.97±0.00 mg GAE/g, 7.44±0.29 mg GAE/g and 6.83±0.38 mg GAE/g in PCH, PCC, PCE and PCW respectively. The value is expressed in gallic acid equivalent in weight of one gram of 80 % methanol crude extract of corresponding fraction of PC. According to the results PCE have high amount of polyphenolic content in its methanol extract.
34
3.2. DPPH radical scavenging assay
PCH, PCC, PCE and PCW were investigated for DPPH radical scavenging activity and IC50
are shown in Figure 08 (A). According to the results all four fractions were shown DPPH radical scavenging ability in dose dependent manner and IC50 values are shown I the Table
000 and they are 1.12±0.40 mg/mL, 0.76±0.01 mg/mL and 0.71±0.03 mg/mL and 0.78±0.11 in PCH, PCC, PCE and PCW respectively. PCE was showed lowest IC50 value compared to
the PCH, PCC and PCW and PCE is having better DPPH radical scavenging activity compared to other fractions.
3.3. Hydroxyl radical scavenging activity
The results of the hydroxyl radical scavenging activity of the all four fractions are shown in the Figure 08 (A). Hydroxyl radical scavenging activity was shown in dose dependant manner. IC50 values are shown I the Table 000 and they are 0.36±0.05 mg/mL, 0.31±0.03
mg/mL and 0.25±0.01 mg/mL and 0.25±0.01 in PCH, PCC, PCE and PCW respectively. IC50
values imply the ability of the radical scavenging activity and according to the results PCE was shown lowest IC50 value and further it was exhibited greater ability to scavenging the
35
3.4. Alkyl radical scavenging activity
Alkyl radical scavenging activity of the methanol extracts of the three seaweeds are shown in Figure 08 (C). IC50 values are shown I the Table 000 and they are 0.12±0.03 mg/mL,
0.18±0.02 mg/mL, 0.017±0.001 mg/mL and 0.017±0.001 mg/mL in PCH, PCC, PCE and PCWrespectively. According to the results PCE is showed better alkyl radical scavenging activity and PCE is showed the lowest IC50 value among the three samples.
36
Figure 08. Radical scavenging activity of the fractions of PCH,PCC, PCE and PCW (A) DPPH radical scavenging activity (B) Hydroxyl radical scavenging activity (C) Alkyl radical scavenging activity. 0 20 40 60 80 100 PCH PCC PCE PCW D P P H r a d ic a l s ca v en g in g a ct iv it y (%) 0.25 mg/mL 1 mg/mL 2 mg/mL
37
Table 01. Total phenolic content and IC50 values of the radical scavenging activity of the fractionated Padina commersonii
Scientific name Fractions
Total phenolic content (mg GAE/g) a
Free radical scavenging activity (IC50 mg/mL ) a
DPPH radical Alkyl radical Hydroxyl radical
Padina commersonii PCH 5.48 ± 0.65 1.12 ± 0.40 0.12 ± 0.03 0.36 ± 0.05 PCC 6.97 ± 0.15 0.76 ± 0.01 0.18 ± 0.02 0.31 ± 0.03 PCE 7.44 ± 0.29 0.71 ± 0.03 0.017 ± 0.001 0.25 ± 0.01 PCW 6.83 ± 0.38 0.78 ± 0.11 0.02 ± 0.003 0.28 ± 0.06 a
The values were determined by triplicate individuals. Values are mean ± SD of three determinations.
38
Polyphenolic or phenol compounds are one of the secondary metabolite widely distributed in plant kingdom and they synthesized by plants via two main primary synthetic pathways: the sikimate pathway and the acetate pathway (Paixao et al. 2007) . Acidic character of the phenolic functional group and nucleophilic character of the benzene ring is responsible for the reactivity of these compounds. Polyphenols are capable in effectively scavenge oxygen free radicals and prevent lipid peroxidation. Their reactivity is determined by hydrogen donating or electron donating capability, the stability of the resulting antioxidant-derived radical and their metal chelation properties. Polyphenolic compounds have been reported to demonstrate anti-inflammatory antibacterial, antimutagenic and vasodialatory action and these activities are associated with polyphenol content and antioxidant properties. According to results observed , PCE was shown high amount of total phenolic content and better radical scavenging activity than other three fractions. It was shown correlation between antioxidant property and total phenolic content.
3.5. Anti-inflammatory activity by measurement of NO concentration on
RAW 264.7 macrophages
LPS is found in outer membrane of the gram negative bacteria and it is endotoxin for mammalian cells. LPS is able to activate anti inflammatory mediators and induced to produce nitric oxide. Sample pre-treated RAW 264.7 cells were stimulated with LPS to produce the NO and NO concentration was quantified after 24 h incubation using colorimetric method. The results were presented in Figure 09 (A). IC50 values were
99.42±3.10, 97.15±2.9, 26.14±0.90 and 165.75 ±9.07 µg/mL in PCH, PCC, PCE and PCW respectively. Cell viability of LPS induced cells were evaluated by MTT assay which is a test of metabolic competence predicted upon the assessment of mitochondrial performance. The conversion of yellow tetrazolium bromide to its purple formazan derivative by mitochondrial succinate dehydrogenase in viable cells can determined as a colorimetric assay (Mosmann
39
1983). Cell viabilities were around 100 % for the all concentrations of each fractions except 50 µg/mL and 100 µg/mL of PCH and they were 77.51 % and 76.06 % . Percentage of cell viabilities were calculated compared to the cell viability of control and cell viability of the control was considered as 100 %. Results are shown in Figure 09 (B). PCE was shown lower NO production in LPS induced RAW 264.7 cells with greater cell viability compared to PCH, PCC and PCW.
40
Figure 09. Inhibitory effect of NO production of fractions of PCH, PCC, PCE and PCW in LPS induced R aw 264.7 macrophages. Cells were incubated with LPS for 24 h presence or absence of desire fraction. (A) production of NO was quantified compared to the LPS treated group and (B) cell viability was calculated compared to the control.
B A
41
3.6. Thin Layer Chromatographic (TLC) analysis of PCE
Chromatography is a separation technique and the separation is depend on the differential distribution of the mixture of compounds or components between mobile phase and stationary phase. Stationary of the TLC is thin layer adhering to the suitable plate of supporting material such as aluminum plate, glass plate or plastic plate. Mobile phase is flowed ascending way by capillary action (Vogle 1989). Reversed phase C18 TLC was used during this study and mixture of water and methanol was used as mobile phase with different ratio. Developed TLCs were observed under UV lamp and stain using mixture of ethanol and H2SO4 and heated at 100 oC for some time to visualization. TLC chromatographs of PCE are
shown in Figure 10. Components in PCE were separated in RP-TLC with increasing the methanol amount in the mobile phase. According to the observed results, little number of components were separated from the base of the RP-TLC line at 70% methanol and more separated spots were appeared in 90% and 100 methanol. Therefore mixture of 70%, 80%, 90% and 100% methanol was selected as mobile phase for the open column separation.
42
Figure 10. TLC chromatograph of the PCE in different solvent condition (A) observed under naked eye (B) under 254 nm UV radiation (C) heat with sulfuric and ethanol staining reagent.
43
3.7. Reverse phase open column fractionation of the PCE
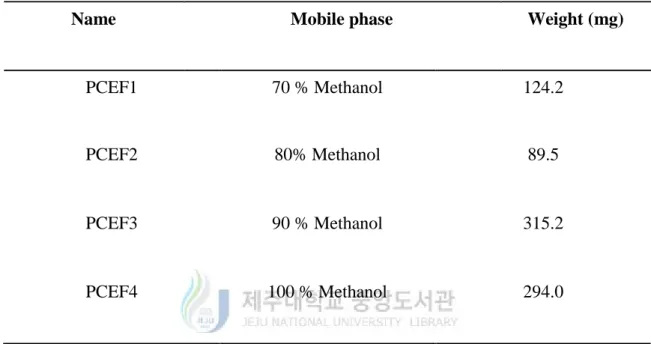
Reversed phase open column is packing was packed with octadecyl-silica (ODS). ODS is a non polar hydrophobic stationary phase. Non polar compounds are having more affinity for the stationary phase and run slowly through the open column. Polar solvents are using for the RP-open column such as methanol and water. Polar compounds are eluting very first and non polar compounds are eluting later. In this study first mobile phase was 70% methanol and eluted fraction with this mobile phase was labeled as PCEF1. As well as other fractions were labeled as PCEF2, PCEF3 and PCEF4 which were eluted with 80%, 90%, and 100% methanol respectively. Therefore polarity sequence of the eluted factions were PCEF1> PCEF2> PCEF3> PCEF4 in descending manner. Dry weight of the each eluted fraction was shown in Table 02.
44
Table 02. Weight of the RP-open column eluted fractions of PCE with mobile phase
Name Mobile phase Weight (mg)
PCEF1 70 % Methanol 124.2
PCEF2 80% Methanol 89.5
PCEF3 90 % Methanol 315.2
45
3.8. Radical scavenging activity evaluation of the open column eluted fractions
of PCE
Three types of radicals were used to evaluate the radical scavenging activities of the each column fraction and they were DPPH, hydroxyl and alkyl a. Observed results are shown in Figure 11. IC50 values of the each fraction are shown in Table 03 and lowest IC50 values were
reported in PCEF2 for DPPH, hydroxyl, alkyl radicals compared to the other three column fractions.
3.9. Anti-inflammatory activity evaluation of the open column eluted fractions
of PCE
Anti-inflammatory activity column fractions were evaluated on Raw 267.4 macrophages by effect of inhibition of NO production. Observed results are shown in the Figure 12. Lowest IC50 was recorded for the PCEF2 with low cytotoxicity on LPS induced Raw 267.4 cells.
46
Figure 11. Radical scavenging activity of PR column eluted fractions PCEF1,PCEF2,PCEF3 and PCEF4 (A) DPPH radical scavenging activity (B) Hydroxyl radical scavenging activity (C) Alkyl radical scavenging activity.
47
Figure 12. Inhibitory effect of NO production of PR column eluted fractions PCEF1,PCEF2,PCEF3 and PCEF4 in LPS induced R aw 264.7 macrophages. Cells were incubated with LPS for 24 h presence or absence of desire fraction. (A) production of NO was quantified compared to the LPS treated group and (B) cell viability was calculated compared to the control.
48
Table 03. IC50 values of the radical scavenging activity and NO production inhibition of the RP-column eluted fractions of PCE
Open column fraction
IC50 of NO production inhibition
(µg/mL)a
Free radical scavenging activity (IC50 mg/mL ) a
DPPH radical Alkyl radical Hydroxyl radical
PCEF1 127.29±1.35 0.237±0.007 0.163±0.004 0.144±0.020 PCEF2 44.11±2.3 0.014±0.00 0.0.010±0.001 0.100±0.003 PCEF3 30.15±0.59 389.16±0.006 0.511±0.137 0.123±0.035 PCEF4 >200 1.576±0.030 >1 0.248±0.052
a
The values were determined by triplicate individuals. Values are mean ± SD of three determinations.
49
3.10. HPLC investigation of PCE and column fractions
PCE, PCEF1, PCEF2. PCEF3 and PCEF4 were analyzed by RP-HPLC. Observed chromatograms are shown in Figure 13. According to the results PCE was consist with relatively polar and non polar compounds. Compounds were separated according to the polarity after fractionation by an open column. However PCEF1 and PCEF2 fractions had same chromatographic separation in HPLC chromatograph. But PCEF2 was contained relatively high quantity than PCEF1 and that can be concluded by comparing absorbance values of chromatographs. Hence PCEF2 was shown better antioxidant and anti-inflammatory activities.
Therefore PCEF1 and PCEF2 were combined together and named as PCEF-A
3.11. Investigation of antioxidant activity by the ABTS+Online HPLC
Chromatograph of the online HPLC is shown in Figure 14 (A). ABTS+ absorbance curve is shown at Figure 14 (B). According to the HPLC chromatogram, PCEF-A column fraction was shown very strong eight negative peaks at ABTS+ spectrum. In addition PCEF3 and PCEF4 fractions were not shown antioxidant properties in online HPLC. Compounds available in the fraction were separated by RP-HPLC column and elution line was couple with ABTS+ line and directed to the reaction coil. Separated antioxidant compound react with ABTS+ radical and reduction of the color was recorded using UV-detector.