저작자표시-비영리-변경금지 2.0 대한민국 이용자는 아래의 조건을 따르는 경우에 한하여 자유롭게 l 이 저작물을 복제, 배포, 전송, 전시, 공연 및 방송할 수 있습니다. 다음과 같은 조건을 따라야 합니다: l 귀하는, 이 저작물의 재이용이나 배포의 경우, 이 저작물에 적용된 이용허락조건 을 명확하게 나타내어야 합니다. l 저작권자로부터 별도의 허가를 받으면 이러한 조건들은 적용되지 않습니다. 저작권법에 따른 이용자의 권리는 위의 내용에 의하여 영향을 받지 않습니다. 이것은 이용허락규약(Legal Code)을 이해하기 쉽게 요약한 것입니다. Disclaimer 저작자표시. 귀하는 원저작자를 표시하여야 합니다. 비영리. 귀하는 이 저작물을 영리 목적으로 이용할 수 없습니다. 변경금지. 귀하는 이 저작물을 개작, 변형 또는 가공할 수 없습니다.
Master’s Thesis in
Public Health and Social Medicine
Association between weight perception and depression
across sex, age and race/ethnicity in the US adult
population
Ajou University Graduate School
Public Health and Social Medicine Major
Association between weight perception and depression
across sex, age and race/ethnicity in the US adult
population
Yunhwan Lee, Advisor
I submit this thesis as the Master’s thesis in
Public Health and Social Medicine
August 2019
Ajou University Graduate School
Public Health and Social Medicine Major
Acknowledgement
First of all, I would like to express my sincere gratitude to my adviser, Prof. Yunhwan Lee for the continuous support, patience, and guidance throughout the writing of this thesis. I would like to thank you for encouraging my research and allowing me to grow as a researcher and as a person. I could not have imagined having a better adviser and mentor for my Masters’ study. I would also like to thank my thesis defense committee members, Prof. Soon Young Lee and Bom Taeck Kim, for their insightful comments, suggestions, and encouragement that enabled me to widen my research, and various perspectives. I also would like to express my thanks to Dr. Young Choi, for his assistance in SAS programming and statistical analysis, to Mr. Doukyoung Chon for being a great senior who’s always answering my questions and updating me of requirements and deadlines, to Dr. Jin-Hee Kim, Dr. Seungkook Ki, Ms. Ji-Hye Yun and Ms. Soo Jeong Lee for all the encouragement and to all our colleagues at the Department of Preventive Medicine, Ajou University, thank you very much. I would also like to thank the people and organizations behind NHANES, this study would not have been possible if not for the publicly-available data and detailed tutorials that are generously shared to data users and researchers throughout the world.
I would also like to thank Ate Joyce, for being always there whenever I was stressed or felt like giving up, and to my Ajou University and KGSP friends for the support. To my best friend here in Korea, Eva, I would like to thank you for always lifting my spirit up and for believing in me. To BFFF, Ena, Allyn, and Mishy, words cannot express how thankful I am for the late nights and long days that you have been with me virtually; you were one of the reasons I was able to finish.
Last but not least, I would like to express my deepest gratitude to my family, especially my mama and papa, for loving and supporting me in all aspects of my life. I love you and I am forever grateful for you.
i
-ABSTRACT-
Association between weight perception and depression across sex, age and
race/ethnicity in the US adult population
Background: There have been numerous inconsistencies in the results of studies exploring the association of BMI
and depression. This can be attributed to unaccounted confounding variables in the psychosocial aspect, such as weight perception. The aim of this study was to determine if weight perception is more strongly associated with clinically relevant depression than directly measured BMI. Due to the dearth of studies, this study also explored the patterns of the associations across sex, age, and race/ethnicity.
Study Population and Methods: This study conducted a cross-sectional study using data on adults aged 18 and
above from the National Health and Nutrition Examination Survey (NHANES) from 2011 to 2016 (N= 10,068). Multiple logistic regression analyses were performed to evaluate the association of actual BMI status (calculated from measured height and weight), weight perception and weight misperception patterns to depression (Patient Health Questionnaire-9, ≥ 10 score) while adjusting for potential covariates. Further analyses were done to examine the different patterns of the associations across sex, age and race/ethnicities.
Results: This study has found the weight perception was indeed more strongly associated with depression as
compared to directly measured BMI. Results show that obese men (OR=0.70, 95% CI:0.50-0.97), overweight women (OR=0.74, 95% CI:0.56-0.98) and overweight adults aged 18-39 (OR=0.56, 95% CI:0.40-0.79) seemed to have lower odds of depression compared to adults with normal BMI. On the other hand, underweight and/or overweight perception increased depression odds in both sexes, in middle-aged and older adults and in Mexican Americans, Whites, and Blacks. Weight misperception also increased the risk of being depressed in Blacks when they overestimate and Asians when they underestimate their weight. Lastly, other ethnicities, including multiracial persons, are less likely to be depressed when they underestimate their weight.
Conclusion: Overweight and underweight perceptions, rather than BMI, are more strongly associated with
depression. Adults who view themselves as deviating from the societal ideal of normal body size and weight are more at risk of depression and this pattern is somehow consistent across sex, age groups, and race/ethnicities.
ii
TABLE OF CONTENTS
ABSTRACT………..……….…… i
TABLE OF CONTENTS………...……….……… ii
LIST OF TABLES………. iii
I. INTRODUCTION………... 1
II. DATA AND METHODS…………..……….. 3
1. Study Population………... 3 2. Measures……… 3 3. Statistical Analysis………. 5 III. RESULTS………. 6 IV. DISCUSSION……….. 15 V. CONCLUSION……… 22 REFERENCES………. 23 SUPPLEMENTS……….. 28 국문요약 ………. 39
iii
LIST OF TABLES
Table 1. Participant characteristics, obesity level, weight perception and depression status by sex……… 6
Table 2: Frequency and prevalence (%) of depression by BMI and weight perception……….. 7
Table 3. Frequency and prevalence (%) of depression by each variable to
identify significant covariates………8
Table 4. Crude and multivariable models (exclusively and inclusively adjusted for
weight perception) for depression according to BMI status……… 10
Table 5. Crude and multivariable models (exclusively and inclusively adjusted for weight perception) for depression according to BMI status by age………..………..………... 11 Table 6. Crude and multivariable models (exclusively and inclusively adjusted for weight perception) for depression according to BMI status by race/ethnicity…….………...……….. 13
1
INTRODUCTION
Obesity prevalence rates have been continuously increasing all over the world. In the US alone, there was a 5.9% increase from 2007-2008 to 2015-2016 (Hales, Fryar, Carroll, Freedman, & Ogden, 2018). Obesity is a well-documented risk factor for mortality and morbidity from several illnesses (Abdelaal, le Roux, & Docherty, 2017), especially cardiovascular diseases (Berrington de Gonzalez et al., 2010) and all cancers combined(Calle, Rodriguez, Walker-Thurmond, & Thun, 2003), but its relationship to depression has always been riddled with inconsistencies. Previous studies have shown that higher BMI increases the risk of depression (Bjerkeset, Romundstad, Evans, & Gunnell, 2007; L. de Wit et al., 2010; Herva et al., 2005; Luppino et al., 2010; Zhao et al., 2009) while some showed that it decreases the risk, especially in older adults (Bin Li et al., 2004), others had mixed results (Blazer, Moody-Ayers, Craft-Morgan, & Burchett, 2002; Mulugeta, Zhou, Power, & Hyppönen, 2018), one found a U-shaped relationship (L. M. de Wit, van Straten, van Herten, Penninx, & Cuijpers, 2009) and some did not find any association at all (Drukker, Wojciechowski, Feron, Mengelers, & van Os, 2009; Hung et al., 2014; Rivenes, Harvey, & Mykletun, 2009). While the lack of result consensus can be attributed to differences in population characteristics, residual confounding factors and differences in obesity measurement, the sociocultural aspect of both depression and obesity can offer an alternative explanation. There is a possibility that it is not the actual weight that contributes to depressive symptoms, but instead, underlying psychosocial factors like perception. Weight perception, or the self-perception of one’s weight status, has lately been associated with depression, and one study (Gaskin et al., 2013) have found that weight perception acted as a mediator between the BMI and depression association in adult women.
Perception, in general, can be influenced by a number of internal and external factors, and one is psychosocial distress. Psychosocial distress in relation to weight and body shape can be attributed to the sector-encompassing stigma associated with deviating from societal norms of body weight and shape (Cramer & Steinwert, 1998; Crandall, 1994; Latner & Stunkard, 2003; Sabin, Marini, & Nosek, 2012). Exposure to social discrimination and weight stigmatization might play a role in the formation of weight perception or its misperception (Anne Harring, Montgomery, & Hardin, 2011) and may contribute to the disparities on the obesity-depression literature. Thus, it is critical to examine its role in influencing depressive symptoms.
Since the bulk of studies examining weight perception and depression association mainly focuses on the adolescent population (Haynes, Kersbergen, Sutin, Daly, & Robinson, 2018a), this study aims to focus on the adults aged 18 and above. The hypothesis that weight perception, rather than actual BMI, is strongly associated with adult depression has been examined by only a few studies. A study on Australian adults found that both over- and underweight perceptions, and not BMI, are significant risk factors for psychological distress (Atlantis & Ball, 2007) while another (Gaskin et al., 2013) found that when the association of BMI and depression was adjusted for weight perception of both sexes, the association weakened for overweight and obese women, showing the possible mediator role that perception plays in the relationship. Another study on adult Korean women found that those
2
who under- or overestimated their actual weight had a higher risk for depressed mood than those who had an accurate perception of their weight (D. S. Kim, Kim, Cho, & Cho, 2008). Though these studies shed light on the role of weight perception in the obesity-depression connection, the analyses have been either focused only on weight perception or only on its misperception, focused on women, adolescents or overweight/obese participants only, and no further analyses were done to examine the different patterns of the association across age and race/ethnicity. Using a large, nationally representative sample from NHANES, this study aimed to explore the association of BMI, weight perception, the perception accuracy (whether concordant to actual BMI), and weight misperception (whether weight was over- or underestimated) to depression. Since weight perception can vastly vary from each individual, whether male or female, of different ages and socio-cultural backgrounds, this study also aimed to examine the patterns across sex, age, and race/ethnicity. The richness of information from NHANES enabled this study to take a look at the bigger picture involving BMI, weight perception and depression of various sub-populations while adjusting for confounding effects of demographic aspects, lifestyle factors, presence of major medical conditions and self-rated health.
3
DATA AND METHODS
a. Study population
The data analyzed in the study were obtained from cycles 7 (2011-2012), 8 (2013-2014) and 9 (2015-2016) of the National Health and Nutrition Examination Survey (NHANES). NHANES is an ongoing research survey designed to represent and assess the health and nutritional status of non-institutionalized children and adults in the United States. After excluding participants with unavailable information for depression screening, BMI and weight perception, and for any variable included in the analyses, a total of 10,068 (4534 male, 5534 female) participants were included in this study.
b. Measures b.1. Depression
Presence of depressive symptoms was determined by the nine-item depression screening instrument Patient Health Questionnaire (PHQ-9), administered at the Mobile Examination Centers (MEC) as a part of the MEC interview. PHQ-9 is a criteria-based tool commonly used to diagnose depression in the primary health care level. It determines the frequency of depressive symptoms for the past 2 weeks (Kroenke, Spitzer, & Williams, 2001).
Responses range from "not at all" to "nearly every day” and are given a corresponding point of 0-3. The PHQ-9 score can range from 0-27 and is categorized in increasing severity:0-4 as no depression, 5-9 as minimal depressive symptoms, 10-14 as mild depression, 15-19 as moderate depression, and 20 or greater as severe depression. Based on previous research, a cutoff of ≥ 10 (Kroenke, 2012) was used to dichotomize the depression status of the participants. Individuals with a total PHQ-9 score of 10 and above were classified as persons with clinically relevant depression, otherwise as belonging to the depression-free group. Participants who did complete the PHQ-9 were excluded from the current analysis.
b.2. Body Mass Index (BMI)
Weight and height were measured by trained professionals in the Medical Examination Centers for NHANES. Measured weight and height were used to calculate the Body Mass Index (BMI) (weight (kg)/ height (m2)). BMI was classified using WHO standard criteria grouping participants into four levels: those
obese (BMI ≥30 kg/m2), overweight (≥25 kg/m2),normal (18.5kg/m2≤BMI<25kg/m2) and underweight
4
b.3. Weight perception
Weight perception, or how the participant perceives his/her own weight, was determined by the response to the question “How do you consider your weight?” during the interview survey. Response options included “underweight”, “overweight” and “just about right”.
b.4. Weight misperception
Independent effects of weight misperception and its patterns were also examined. Misperception was determined by comparing BMI and weight perception. Incorrect perception based on actual BMI were coded as “misperception”. Patterns of underestimation (perception of a lower weight compared with the actual BMI) and overestimation (perception of a higher weight compared with the actual BMI) were also included in the analysis.
b.5. Possible Covariates
After selecting the best model (using AIC statistics) and testing for multicollinearity, covariates considered in this study for both sexes were demographics, socioeconomic status, health risk behaviors, physical activity, history of major medical illness and self-rated health. Participants’ race/ethnicity was coded as Hispanic Mexican American, Other Hispanics, non-Hispanic Whites, non-Hispanic Blacks, non-Hispanic Asians and other race, including multiracial persons. Level of education attained was determined based on the highest level of school completed or highest degree achieved and were coded as below HS, high school and above high school. Poverty income ratio (PIR) was used to assess family income and was classified as poor (PIR<1.0), near poor (1.0≤PIR<2.0), middle income (2.0≤PIR<4.0) and high income (PIR≤4.0) (Bloom B, 2013). Current smoking status was defined as the number of cigarettes smoked in the last 30 days and was categorized as heavy (more than 20 cigarettes/day), moderate (10-19 cigarettes/day), light (1-9 cigarettes/day) and rare/never (never had at least 100 cigarettes in life or had 1 or less cigarette in the past month). Alcohol consumption was categorized as heavy (drinking every/almost every day per week), moderate (2-3 times a week), light (once a week) and non-drinker (did not have at least 12 alcohol drinks/lifetime). Physical activity, on the other hand, was determined using the WHO’s Global Physical Activity Questionnaire. It collects information about sedentary behavior and physical activity (moderate and vigorous) in the domains of work, transportation, and recreational activities. Total Physical activity is the sum of the total MET (Metabolic Equivalent) minutes per week and is classified as high (at least 3 days vigorous activity and a minimum of 1500 MET-min/week; 7 or more days of walking/cycling and/or moderate/vigorous activities and a minimum of 3000 MET-min/week), moderate (3 or more days of vigorous activity for at least 20 minutes/day, or 5 or more days of moderate-intensity activity or walking/cycling for at least 30 minutes/day, or 5 or more days of any combination of
5
walking/cycling, moderate/vigorous activities and a minimum of 600 MET-minutes per week), and low (any value not reaching the criteria for either high or moderate level of physical activity). Additionally, self-rated health was determined by the response to the question “Would you say your health in general is…”. Responses include excellent, very good, good, fair, and poor. The number of major medical conditions for each participant was calculated based on the self-reported medical history following the diagnosis of a physician. History of the diagnosis of stroke, heart attack, high blood pressure, diabetes, and cancer were considered as covariates in this study (Inaba et al., 2005).
c. Statistical analysis
Due to the complex, stratified, multistage, probability cluster sampling design of NHANES, SAS Survey Procedures were used. Chi-square tests were performed to calculate differences in the proportions of depressive symptoms and to confirm significant covariates. The overall agreement of obesity level by BMI and weight perception was determined through the Kappa Statistic. Multiple logistic regression analyses were performed to evaluate the effects of actual BMI status, weight perception and weight misperception patterns to depression (Gaskin et al., 2013). There has been substantial evidence that depression and weight perception differs between males and females, and thus separate analyses was done for each group (Paeratakul, White, Williamson, Ryan, & Bray, 2002; Piccinelli & Wilkinson, 2000). Additionally, on the account that both depression and weight perception may exhibit different patterns in different age groups and racial/ethnical backgrounds, separate analysis were also done according to age and race/ ethnicity. All analyses were done in both crude and adjusted models (included all the confounders previously mentioned except the variable tested). To determine the possible effect of weight perception to the BMI-depression association, exclusively adjusted (Model I: BMI and weight perception not in the same model) and inclusively adjusted (Model II: BMI and weight perception in the same model) models were produced. All statistical procedures and analyses were carried out using SAS® software.
6
RESULTS
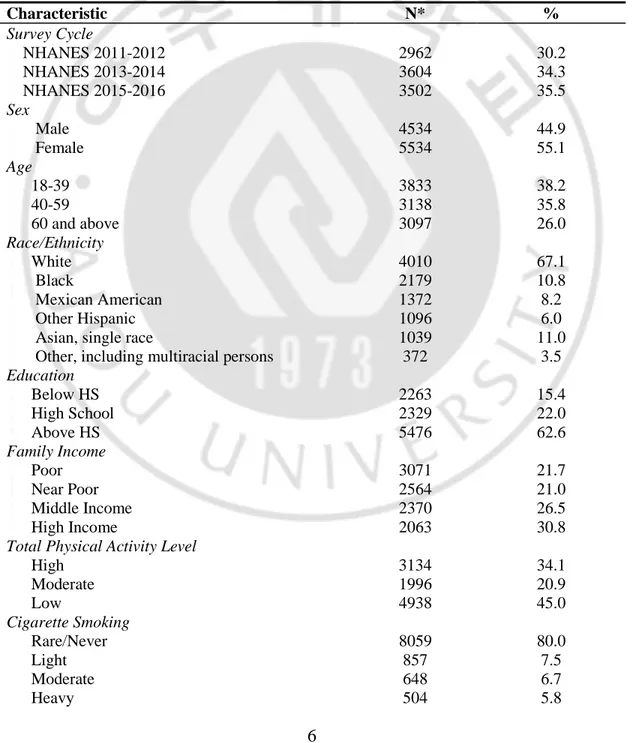
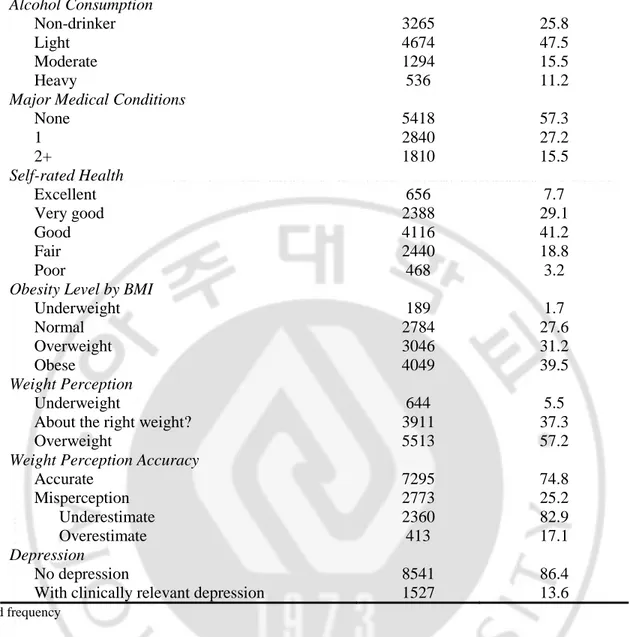
Table 1 shows the demographics, BMI, weight perception, and depression status of the participants included in the analysis. More than 70% of the participants belonged to the above normal BMI range, with overweight being 31.2% and obese being 39.5% of the population. More than half (57.2%) of the participants think they are overweight, 37.3% think they are of normal weight and 5.5% think they are underweight. Majority of the population perceived their weight accurately while 25.2% misperceive, with underestimation being the more prevalent one. As for depression, 13.6% of the participants have clinically relevant depression.
Table 1. Participant characteristics, obesity level, weight perception and depression status (Total: 10,068)
Characteristic N* % Survey Cycle NHANES 2011-2012 2962 30.2 NHANES 2013-2014 3604 34.3 NHANES 2015-2016 3502 35.5 Sex Male 4534 44.9 Female 5534 55.1 Age 18-39 3833 38.2 40-59 3138 35.8 60 and above 3097 26.0 Race/Ethnicity White 4010 67.1 Black 2179 10.8 Mexican American 1372 8.2 Other Hispanic 1096 6.0
Asian, single race 1039 11.0
Other, including multiracial persons 372 3.5
Education Below HS 2263 15.4 High School 2329 22.0 Above HS 5476 62.6 Family Income Poor 3071 21.7 Near Poor 2564 21.0 Middle Income 2370 26.5 High Income 2063 30.8
Total Physical Activity Level
High 3134 34.1 Moderate 1996 20.9 Low 4938 45.0 Cigarette Smoking Rare/Never 8059 80.0 Light 857 7.5 Moderate 648 6.7 Heavy 504 5.8
7
Alcohol Consumption Non-drinker 3265 25.8 Light 4674 47.5 Moderate 1294 15.5 Heavy 536 11.2Major Medical Conditions
None 5418 57.3 1 2840 27.2 2+ 1810 15.5 Self-rated Health Excellent 656 7.7 Very good 2388 29.1 Good 4116 41.2 Fair 2440 18.8 Poor 468 3.2
Obesity Level by BMI
Underweight 189 1.7 Normal 2784 27.6 Overweight 3046 31.2 Obese 4049 39.5 Weight Perception Underweight 644 5.5
About the right weight? 3911 37.3
Overweight 5513 57.2
Weight Perception Accuracy
Accurate 7295 74.8 Misperception 2773 25.2 Underestimate 2360 82.9 Overestimate 413 17.1 Depression No depression 8541 86.4
With clinically relevant depression 1527 13.6
*Weighted frequency
Both actual BMI status and weight perception were significantly associated with depression in the whole population (Table 2). While both accurate perception and misperception of weight were not significantly associated with depression, 25.2% of the population misperceived their weight including 3% of the depressed participants.
Table 2: Frequency and Prevalence (%) of depression by BMI and weight perception Na
Depressed (%) p-value
Obesity Level by BMI
Underweight 189 30 (0.2) 0.0002* Normal 2784 358 (3.3) Overweight 3046 365 (3.4) Obese 4049 774 (6.6) Weight Perception
8
Underweight 664 147 (1.1)
<0.0001*
About the right weight? 3911 439 (3.8)
Overweight 5513 941 (8.7)
Weight Perception Accuracy
Accurate 7295 1118 (10.3) 0.5705 Misperception 2773 409 (3.3) Underestimate 2360 350 (10.7) 0.6359 Overestimate 413 59 (2.4)
aUnweighted sample size but weighted %
*p<0.05, Rao-Scott Chi-Square Test
As shown in Table 3, all the considered covariates (sex, age, race/ethnicity, education, family income, total physical activity, cigarette smoking, alcohol consumption, history of major medical conditions and self-rated health) are significantly associated with clinically relevant depression.
Table 3. Frequency and prevalence (%) of depression by each variable to identify significant covariates
Variable Na Depressed (%) p-value
Sex Male 4534 573 (4.98) <0.0001* Female 5534 954 (8.63) Age 18-39 3833 485 (4.78) 0.0090* 40-59 3138 558 (5.61) 60 and above 3097 484 (3.21) Race/ethnicity White 4010 624 (8.74) <0.0001* Black 2179 344 (1.71) Mexican American 1372 200 (1.03) Other Hispanic 1096 215 (1.10)
Asian, single race 1039 66 (0.29)
Other, including multiracial persons 372 78 (0.72) Education Below HS 2263 500 (3.19) <0.0001* High School 2329 372 (3.39) Above HS 5476 655 (7.02)
9
Family Income Poor 3071 670 (4.62) <0.0001* Near Poor 2564 449 (3.87) Middle Income 2370 274 (3.06) High Income 2063 134 (2.05)Total Physical Activity Level
High 3134 354 (3.38) <0.0001* Moderate 1996 252 (2.43) Low 4938 921 (2.80) Cigarette Smoking Rare/Never 8059 1022 (8.78) <0.0001* Light 857 180 (1.48) Moderate 648 157 (1.58) Heavy 504 168 (1.76) Alcohol Consumption Non-drinker 3265 556 (4.33) 0.0004* Light 4674 674 (6.12) Moderate 1294 168 (1.77) Heavy 835 129 (1.39)
Major Medical Conditions
None 5418 632 (6.16) <0.0001* 1 2840 489 (4.60) 2+ 1810 406 (2.85) Self-rated Health Excellent 656 33 (0.31) <0.0001* Very good 2388 139 (1.72) Good 4116 486 (4.94) Fair 2440 620 (4.90) Poor 468 249 (0.174)
aUnweighted sample size but weighted %
10
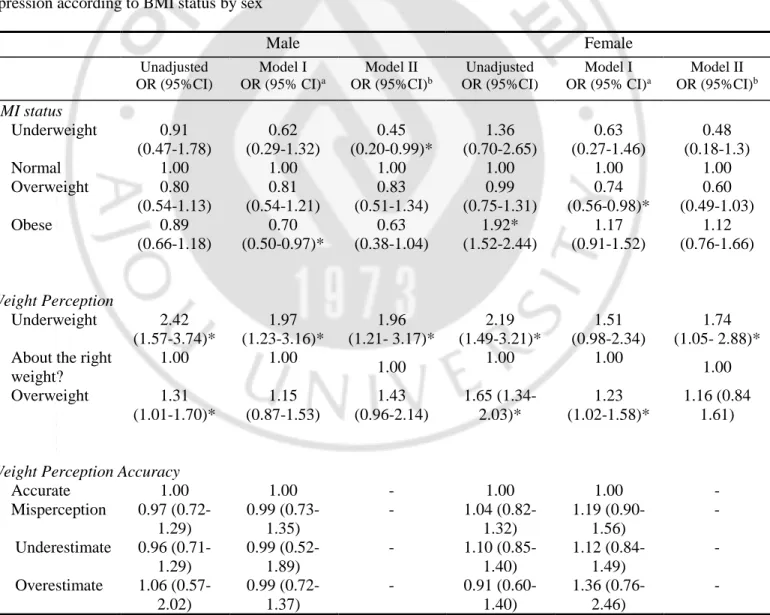
Multivariable models that exclusively and inclusively adjusted for weight perception were generated to examine the effect of weight perception to the BMI-depression association by sex, age, and race/ethnicity (Tables 4,5 and 6, respectively). Adjusting for weight perception decreased depression ORs for both men and women, indicating that the association weakened. In underweight men, OR significantly decreased from 0.62 (95% C.I. 0.29-1.00) to 0.45 (95% C.I. 0.20-0.99). Though there are decreases in the depression ORs especially with adults aged 60 and above, the effect of weight perception to the BMI and depression cannot be ascertained since there were almost no strong associations with BMI and depression in the age analyses. Additionally, although not statistically significant, the majority of the ORs decreased in the inclusively-adjusted model race/ethnicity analyses (Table 6). Odds ratio for underweight White adults also significantly decreased from 0.39
(
95% C.I.0.14-1.11)
to 0.30 (95% C.I. 0.92-1.00).Table 4. Crude and multivariable models (exclusively and inclusively adjusted for weight perception) for depression according to BMI status by sex
Male Female Unadjusted OR (95%CI) Model I OR (95% CI)a Model II OR (95%CI)b Unadjusted OR (95%CI) Model I OR (95% CI)a Model II OR (95%CI)b BMI status Underweight 0.91 (0.47-1.78) 0.62 (0.29-1.32) 0.45 (0.20-0.99)* 1.36 (0.70-2.65) 0.63 (0.27-1.46) 0.48 (0.18-1.3) Normal 1.00 1.00 1.00 1.00 1.00 1.00 Overweight 0.80 (0.54-1.13) 0.81 (0.54-1.21) 0.83 (0.51-1.34) 0.99 (0.75-1.31) 0.74 (0.56-0.98)* 0.60 (0.49-1.03) Obese 0.89 (0.66-1.18) 0.70 (0.50-0.97)* 0.63 (0.38-1.04) 1.92* (1.52-2.44) 1.17 (0.91-1.52) 1.12 (0.76-1.66) Weight Perception Underweight 2.42 (1.57-3.74)* 1.97 (1.23-3.16)* 1.96 (1.21- 3.17)* 2.19 (1.49-3.21)* 1.51 (0.98-2.34) 1.74 (1.05- 2.88)* About the right
weight? 1.00 1.00 1.00 1.00 1.00 1.00 Overweight 1.31 (1.01-1.70)* 1.15 (0.87-1.53) 1.43 (0.96-2.14) 1.65 (1.34-2.03)* 1.23 (1.02-1.58)* 1.16 (0.84 1.61)
Weight Perception Accuracy
Accurate 1.00 1.00 - 1.00 1.00 - Misperception 0.97 (0.72-1.29) 0.99 (0.73-1.35) - 1.04 (0.82-1.32) 1.19 (0.90-1.56) - Underestimate 0.96 (0.71-1.29) 0.99 (0.52-1.89) - 1.10 (0.85-1.40) 1.12 (0.84-1.49) - Overestimate 1.06 (0.57-2.02) 0.99 (0.72-1.37) - 0.91 (0.60-1.40) 1.36 (0.76-2.46) -
11
a Adjusted for age, ethnicity, education level, family income, smoking and drinking status, total physical activity level, history of major
medical illnesses and self-rated health. BMI and weight perception not included in the same model
b Adjusted for age, ethnicity, education level, family income, smoking and drinking status, history of major medical illnesses and
self-rated health. BMI and weight perception included in the same model
Table 4 presents the weighted percentage distributions and odds ratios (95% CI) of all the variables of interest used in the current study according to sex, both in crude and adjusted models. In terms of obesity level by BMI, obese men (OR= 0.70, 95% C.I. 0.50-0.97) and overweight women (OR= 0.74, 95% C.I. 0.56-0.98) seem to be less depressed compared to those with normal BMI. On the other hand, men who think they are underweight are two times more likely to be depressed and women who view themselves as overweight are 1.23 times more likely to be depressed compared those who view themselves as having the right weight. As for weight perception accuracy and misperception patterns, none are significantly associated with depression.
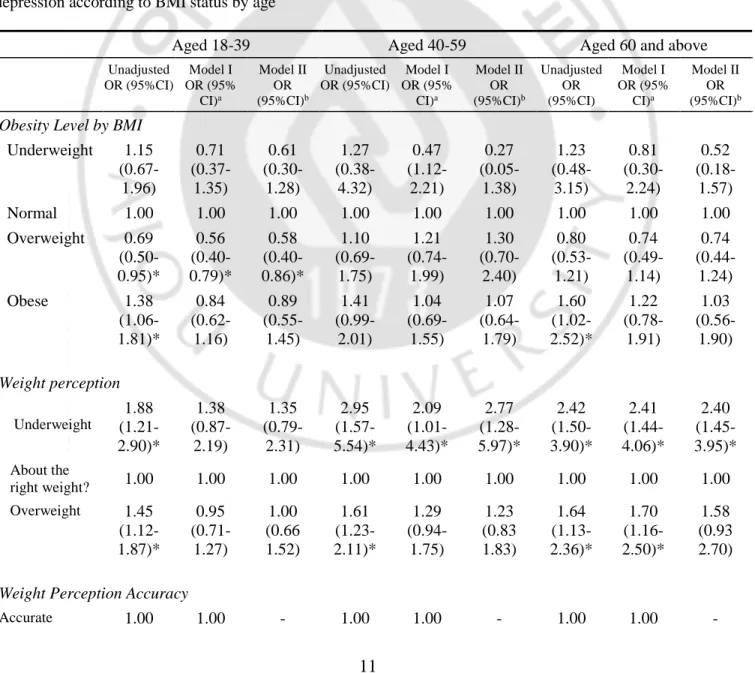
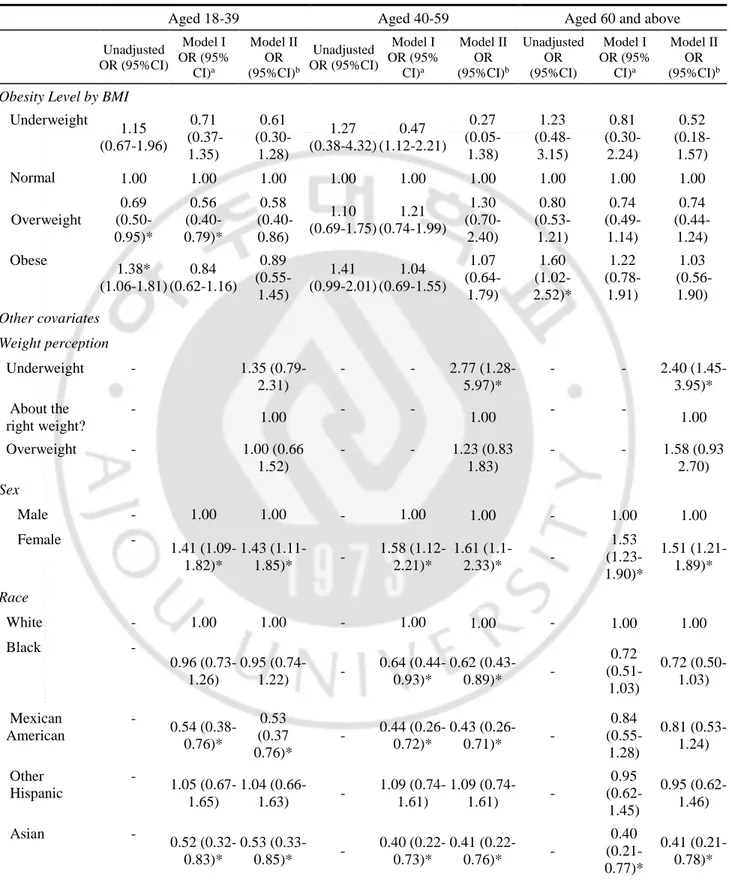
Table 5. Crude and multivariable models (exclusively and inclusively adjusted for weight perception) for depression according to BMI status by age
Aged 18-39 Aged 40-59 Aged 60 and above
Unadjusted OR (95%CI) Model I OR (95% CI)a Model II OR (95%CI)b Unadjusted OR (95%CI) Model I OR (95% CI)a Model II OR (95%CI)b Unadjusted OR (95%CI) Model I OR (95% CI)a Model II OR (95%CI)b
Obesity Level by BMI
Underweight 1.15 (0.67-1.96) 0.71 (0.37-1.35) 0.61 (0.30- 1.28) 1.27 (0.38-4.32) 0.47 (1.12-2.21) 0.27 (0.05- 1.38) 1.23 (0.48-3.15) 0.81 (0.30-2.24) 0.52 (0.18- 1.57) Normal 1.00 1.00 1.00 1.00 1.00 1.00 1.00 1.00 1.00 Overweight 0.69 (0.50-0.95)* 0.56 (0.40-0.79)* 0.58 (0.40- 0.86)* 1.10 (0.69-1.75) 1.21 (0.74-1.99) 1.30 (0.70- 2.40) 0.80 (0.53-1.21) 0.74 (0.49-1.14) 0.74 (0.44- 1.24) Obese 1.38 (1.06-1.81)* 0.84 (0.62-1.16) 0.89 (0.55- 1.45) 1.41 (0.99-2.01) 1.04 (0.69-1.55) 1.07 (0.64- 1.79) 1.60 (1.02-2.52)* 1.22 (0.78-1.91) 1.03 (0.56-1.90) Weight perception Underweight 1.88 (1.21-2.90)* 1.38 (0.87-2.19) 1.35 (0.79- 2.31) 2.95 (1.57-5.54)* 2.09 (1.01-4.43)* 2.77 (1.28- 5.97)* 2.42 (1.50-3.90)* 2.41 (1.44-4.06)* 2.40 (1.45- 3.95)* About the right weight? 1.00 1.00 1.00 1.00 1.00 1.00 1.00 1.00 1.00 Overweight 1.45 (1.12-1.87)* 0.95 (0.71-1.27) 1.00 (0.66 1.52) 1.61 (1.23-2.11)* 1.29 (0.94-1.75) 1.23 (0.83 1.83) 1.64 (1.13-2.36)* 1.70 (1.16-2.50)* 1.58 (0.93 2.70)
Weight Perception Accuracy
12
Misperception 0.94 (0.77-1.16) 1.04 (0.75-1.45) - 0.94 (0.67-1.33) 1.18 (0.80-1.75) - 1.10 (0.80-1.53) 1.10 (0.76-1.60) - Underestimate 0.85 (0.63-1.14) 0.99 (0.70-1.41) - 0.98 (0.66-1.45) 1.25 (0.80-1.96) - 1.04 (0.74-1.50) 0.86 (0.61-1.22) - Overestimate 1.06 (0.58-1.94) 1.27 (0.62-2.62) - 0.77 (0.44-1.36) 0.91 (0.42-1.99) - 1.45 (0.71-2.96) 2.33 (1.3-5.28)* -*p<0.05, generalized logit model
a Adjusted for sex, ethnicity, education level, family income, smoking and drinking status, total physical activity level, history of major
medical illnesses and self-rated health. BMI and weight perception not included in the same model
b Adjusted for sex, ethnicity, education level, family income, smoking and drinking status, history of major medical illnesses and
self-rated health. BMI and weight perception included in the same model
Actual BMI did not seem to increase the probability of depression in any age group. In fact, adults aged 18-39 seem less likely (OR=0.56, 95% C.I. 0.40-0.79) to be depressed when they are overweight. Adults aged 40-59 are two times more likely to be depressed when they perceive their weight to be underweight, compared to those who view their weight as normal. On the other hand, perception of being underweight (OR=2.41, 95% C.I. 1.44-4.06) and overweight (OR=1.70, 95% C.I. 1.16-2.50) increased the probability of being depressed in adults aged 60 and above. Additionally, unlike the other two age groups, overestimating one’s weight increased the odds of depressive symptoms in older adults.
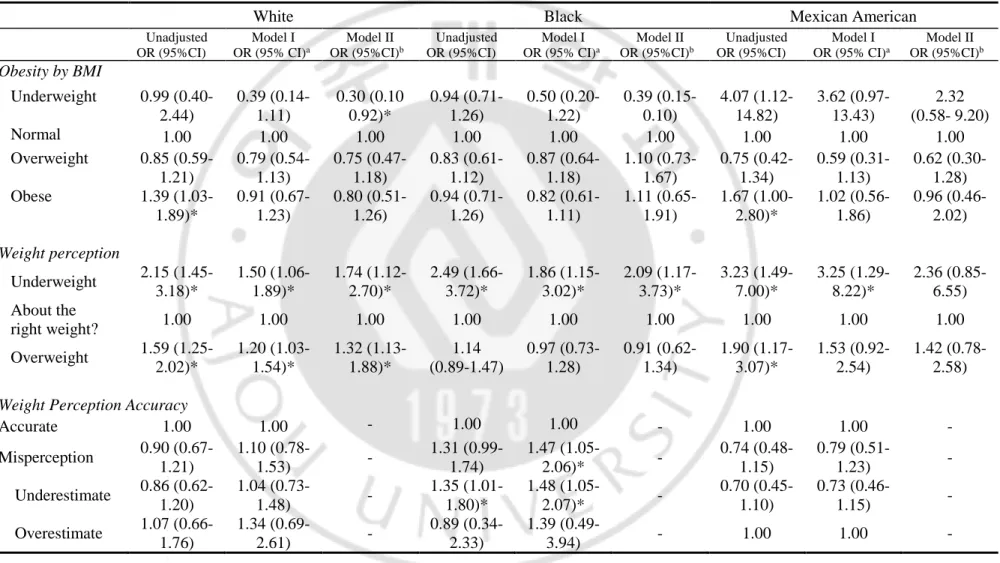
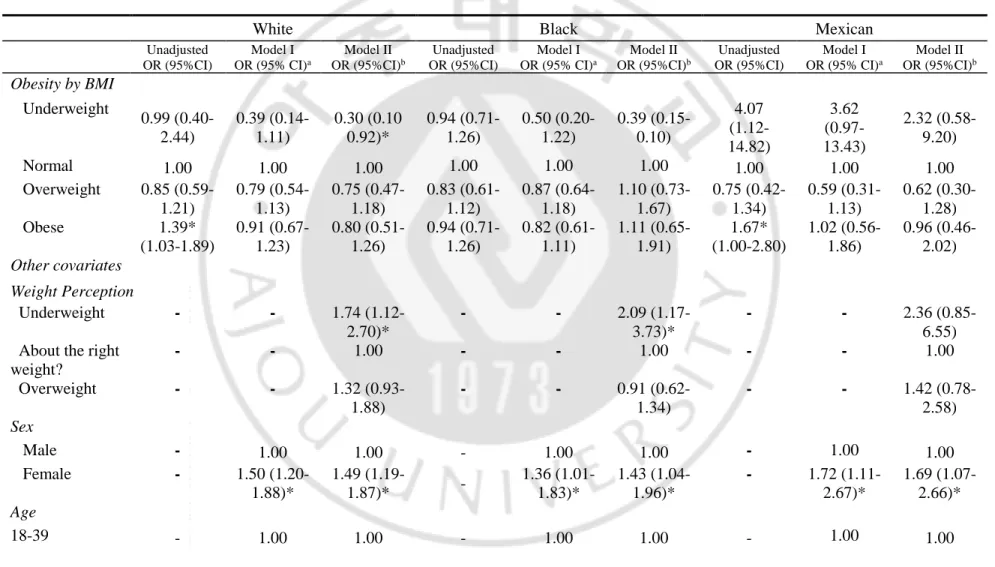
Across ethnicities, different patterns of the association of BMI and weight perceptions with depression are observed. Crude models have shown that obese Whites, Mexican Americans, and other Hispanics are more likely to be depressed compared to their normal-weight counterparts. However, after adjusting for covariates, BMI did not show any association with depression in all race/ethnicities. On the other hand, Whites who perceive themselves as either overweight or underweight had higher odds of depression. Mexican Americans and Blacks are more likely to be depressed when they view themselves as overweight and depression odds increased in Blacks who underestimate their weight. Conversely, Asians are two times more likely to be depressed when they overestimate their weight compared to those who perceive their weight accurately. As for other ethnicities including multiracial people, underestimating their weight seemed to lower depression odds compared to those with accurate perceptions.
13
Table 6. Crude and multivariable models (exclusively and inclusively adjusted for weight perception) for depression according to BMI status by race/ethnicity
White Black Mexican American
Unadjusted OR (95%CI) Model I OR (95% CI)a Model II OR (95%CI)b Unadjusted OR (95%CI) Model I OR (95% CI)a Model II OR (95%CI)b Unadjusted OR (95%CI) Model I OR (95% CI)a Model II OR (95%CI)b Obesity by BMI Underweight 0.99 (0.40-2.44) 0.39 (0.14-1.11) 0.30 (0.10 0.92)* 0.94 (0.71-1.26) 0.50 (0.20-1.22) 0.39 (0.15- 0.10) 4.07 (1.12-14.82) 3.62 (0.97-13.43) 2.32 (0.58- 9.20) Normal 1.00 1.00 1.00 1.00 1.00 1.00 1.00 1.00 1.00 Overweight 0.85 (0.59-1.21) 0.79 (0.54-1.13) 0.75 (0.47- 1.18) 0.83 (0.61-1.12) 0.87 (0.64-1.18) 1.10 (0.73- 1.67) 0.75 (0.42-1.34) 0.59 (0.31-1.13) 0.62 (0.30-1.28) Obese 1.39 (1.03-1.89)* 0.91 (0.67-1.23) 0.80 (0.51- 1.26) 0.94 (0.71-1.26) 0.82 (0.61-1.11) 1.11 (0.65- 1.91) 1.67 (1.00-2.80)* 1.02 (0.56-1.86) 0.96 (0.46- 2.02) Weight perception Underweight 2.15 (1.45-3.18)* 1.50 (1.06-1.89)* 1.74 (1.12- 2.70)* 2.49 (1.66-3.72)* 1.86 (1.15-3.02)* 2.09 (1.17- 3.73)* 3.23 (1.49-7.00)* 3.25 (1.29-8.22)* 2.36 (0.85- 6.55) About the right weight? 1.00 1.00 1.00 1.00 1.00 1.00 1.00 1.00 1.00 Overweight 1.59 (1.25-2.02)* 1.20 (1.03-1.54)* 1.32 (1.13- 1.88)* 1.14 (0.89-1.47) 0.97 (0.73-1.28) 0.91 (0.62-1.34) 1.90 (1.17-3.07)* 1.53 (0.92-2.54) 1.42 (0.78- 2.58)
Weight Perception Accuracy
Accurate 1.00 1.00 - 1.00 1.00 - 1.00 1.00 - Misperception 0.90 (0.67-1.21) 1.10 (0.78-1.53) - 1.31 (0.99-1.74) 1.47 (1.05-2.06)* - 0.74 (0.48-1.15) 0.79 (0.51-1.23) - Underestimate 0.86 (0.62-1.20) 1.04 (0.73-1.48) - 1.35 (1.01-1.80)* 1.48 (1.05-2.07)* - 0.70 (0.45-1.10) 0.73 (0.46-1.15) - Overestimate 1.07 (0.66-1.76) 1.34 (0.69-2.61) - 0.89 (0.34-2.33) 1.39 (0.49-3.94) - 1.00 1.00 -
14
Other Hispanic Asian Other, including multiracial people
Unadjusted OR (95%CI) Model I OR (95% CI)a Model II OR (95%CI)b Unadjusted OR (95%CI) Model I OR (95% CI)a Model II OR (95%CI)b Unadjusted OR (95%CI) Model I OR (95% CI)a Model II OR (95%CI)b Obesity by BMI Underweight 1.48 (0.32-6.95) 0.94 (0.15-5.80) 0.74 (0.12- 4.58) 0.87 (0.27-2.79) 1.05 (0.30-3.66) 0.84 (0.22- 3.29) 2.57 (0.49-13.53) 4.72 (0.82-27.25) 5.03 (0.88-28.74) Normal 1.00 1.00 1.00 1.00 1.00 1.00 1.00 1.00 1.00 Overweight 1.66 (0.39-6.97) 0.92 (0.57-1.49) 1.11 (0.65- 1.91) 1.22 (0.76-1.96) 1.32 (0.78-2.26) 1.06 (0.57-1.96) 1.10 (0.46-2.62) 0.89 (0.38-2.04) 0.68 (0.26- 1.78) Obese 1.70 (1.06-2.73)* 1.43 (0.83-2.48) 1.85 (0.91- 3.74) 1.58 (0.71-3.53) 1.04 (0.37-2.94) 0.72 (0.30- 1.75) 1.77 (0.72-4.32) 1.59 (0.45-5.54) 1.05 (0.25-4.49) Weight perception Underweight 1.26 (0.95-1.68) 1.45 (0.72-2.94) 1.63 (0.75- 3.53) 1.81 (0.90-3.65) 1.88 (0.80-4.42) 2.02 (0.79-5.19) 2.12 (0.56-8.01) 2.70 (0.77-9.42) 1.14 (0.24-5.50) About the right weight? 1.00 1.00 1.00 1.00 1.00 1.00 1.00 1.00 1.00 Overweight 1.66 (0.90-3.06) 1.07 (0.77-1.48) 0.80 (0.57-1.13) 1.70 (0.75-3.83) 1.74 (0.76-3.98) 1.88 (0.83- 4.25) 2.53 (1.23-5.18)* 1.88 (0.84-4.19) 1.90 (0.91- 3.98)
Weight Perception Accuracy
Accurate 1.00 1.00 - 1.00 1.00 - 1.00 1.00 - Misperception 1.04 (0.74-1.46) 1.16 (0.82-1.65) - 1.52 (0.92-2.50) 1.91 (1.11-3.30)* - 0.44 (0.21-0.94)* 0.46 (0.20-1.08) - Underestimate 1.01 (0.70-1.46) 1.21 (0.83-1.76) - 1.40 (0.76-2.57) 1.68 (0.90-3.89) - 0.35 (0.15-0.82)* 0.38 (0.15-0.98)* - Overestimate 0.98 (0.44-2.17) 0.89 (0.39-2.09) - 1.69 (0.81-3.54) 2.26 (1.01-5.05)* - 0.88 (0.26-2.93) 0.70 (0.17-2.80) -
*p<0.05, generalized logit model
a Adjusted for sex, ethnicity, education level, family income, smoking and drinking status, total physical activity level, history of major medical illnesses and self-rated health. BMI and
weight perception not included in the same model
b Adjusted for sex, ethnicity, education level, family income, smoking and drinking status, history of major medical illnesses and self-rated health. BMI and weight perception included in
15
DISCUSSION
BMI and weight perception
This study found that weight perception was indeed more strongly associated with adult depression than directly measured, actual BMI. These results were consistent with previous studies (Atlantis & Ball, 2007; Gaskin et al., 2013; D. S. Kim et al., 2008). Obese BMI was positively associated with depression in women, in adults aged 18-39 and those aged 60 and above, Mexican Americans, Other Hispanics, and Whites in crude models. However, after adjusting for significant covariates, obese men, overweight women and adults aged 18-39, seemed to even have lower odds of being depressed compared to those with normal BMI status. On the other hand, underweight and/or overweight perception increased depression odds in both sexes, in middle-aged and older adults and in Mexican Americans, Whites and Blacks even after adjustment for significant covariates. While BMI and depression association have been greatly diminished after accounting for significant covariates, weight perception and depression association have not.
BMI and depression association has always been riddled with inconsistencies as evidenced by a systematic review of epidemiological studies on obesity and depression (Atlantis & Baker, 2008) published in Nature. The review included 4 prospective cohort studies and 20 cross-sectional studies (all adjusting for relevant covariates) on BMI and depression outcomes and indicated that there is a weak level of evidence supporting the hypothesis that obesity increases depression risk. Although there was an apparent consistency in the longitudinal studies, the review addressed that the effects were not strong due to numerous possible sources of bias and limited generalizability (populations included were from the United States and Finland only). The remaining cross-sectional studies from the US showed significant associations only in pooled male and female populations and only in women when analyzed separately. The cross-sectional studies from other countries (United Kingdom, Germany, Sweden, New Zealand, South Korea, Japan, Canada, and Australia), conducted in regionally representative populations, overall did not find significant associations between obesity and depression.
It is possible that BMIs outside the normal status does not itself cause or lead to the development of depressive symptoms; rather, its’ development is associated with other psychological risk factors like weight perception. When weight perception was controlled for the BMI-depression model, it led to decreases in ORs and statistically significant decrease in underweight men (OR=0.62 to OR=0.45) and Whites (OR=0.39 to OR=0.30) was observed. This is in agreement with the results of studies that investigated the possible mediator effect of perception in the link between BMI and depression (Atlantis & Ball, 2007; Gaskin et al., 2013).
The stronger association of weight perception with depression might be attributed to the role that weight stigma play in the connection. Weight stigma or bias is the social rejection and devaluation of people who
16
deviate from societal norms of body weight and shape, and in some cases, is said to be more prevalent than racism and sexism (Puhl & Heuer, 2009). In a review of the evidence for the Cyclic Obesity/Weight-Based Stigma (COBWEBS) model by Tomiyama (Tomiyama, 2014), weight stigma is classified as a psychological stressor that could lead to stress-related psychological outcomes such as low self-esteem, body dissatisfaction, anxiety and depression. Furthermore, back-upped by the evidence from numerous studies, the review suggested that stress from weight stigma induces a cascade of “behavioral, emotional and physiological responses”, which eventually promote further weight gain. Both weight stigma and perception originate in psychological processes and substantial evidence on the research of subjective construal that supports the idea that perceptions are more important than objective realities (Griffin & Ross, 1991). With the weight stigma-induced stress and its psychological effects, perceptions of one’s weight can be easily distorted. The results of this study alone showed that 31.6% of men and 20% of women misperceived their weight and the results of the study on a nationally representative population done by Chang and Christakis (V. W. Chang & Christakis, 2001) found that self-evaluations of weight were not in concordance to the participants’ actual weight 29% of the time. Aside from self-evaluation, observers also misperceive body shapes as evidenced in a person perception study (Johnson Kerri, Iida, & Tassinary Louis, 2012) wherein the participants categorized the “average female body” as an anthropometrically extreme, thin shape. Existing literature and this study support the assumption that psychological effects from weight stigma may affect how an individual perceives or misperceives his weight and can also lead to psychological distress such as depression.
Weight Misperception
Research on weight misperception in adolescents is abundant but not for adults. To fill in the gaps from previous studies, weight misperception and its patterns were accounted in conjunction with both BMI and weight perception analyses in this study. Results showed that misperception, whether under- or overestimation, of weight did not exhibit an association with depression in analyses across sex. Older adults who overestimate their weight are as much likely to be depressed when they view themselves as underweight, showing a complex structure of weight perception in adults aged 60 and above; this warrants further research. Additionally, participants categorized as other race/ethnicity, including multiracial persons, who underestimated their weight seemed to have lower odds of depression. This finding is convergent with a study on Korean adults (Y. Kim, Austin, Subramanian, & Kawachi, 2018) where they have found that underestimation of weight status was protectively associated with depressive symptoms in women, and this association is especially pronounced in women with higher BMI values. Contrary to other studies (Byeon, 2015; Yan et al., 2018) and to common belief that accurate knowledge of one’s unhealthy weight is imperative to action, a number of longitudinal studies on adolescents also exhibited results that indicate that
17
weight misperception is protective for adult depression (Thurston et al., 2017), future weight gain(K. R. Sonneville et al., 2015), disordered weight control behaviors (Hazzard, Hahn, & Sonneville, 2017) and high blood pressure (Unger et al., 2017). This disparity in the results warrants further investigation in weight misperception and depression.
On the other hand, Blacks who underestimate their weight and Asians who overestimate their weight are 1.48 times and 1.91 times more likely to be depressed compared to their White counterparts. Since studies are dearth on the effect of race/ethnicity to the association of depression with BMI and weight perception, the effect of overestimation and underestimation of weight can be attributed to the internalized stigma and beauty ideals of each race/ethnicity. These differences will be discussed further in the patterns across race/ethnicity section.
Patterns across sex
Results of this study showed that BMI did not increase the risk of depression in both men and women, with obese men and overweight women even having lower odds of depression. This is conjunction with a longitudinal study on adolescents where they found that obesity was protective against depression in men (McCarty et al., 2009) and a community survey that showed significant decrease in ORs for both men and women after adjusting for factors such as physical ill health, lack of physical activity, poorer social support, less education and financial problems (Jorm et al., 2003).
Conversely, weight perceptions increased the odds of depression for both sexes. Men perceiving themselves as underweight is almost two times more likely to be depressed. This can be attributed to the socio-culturally transmitted construct of the ‘ideal body’ of men. Average men, across a range of cultures(McCabe & Ricciardelli, 2004), desire to be taller, have a muscular V-shaped body, well-developed upper body, six-pack abs and narrow waist and hips (Body image: A handbook of science, practice, and prevention, 2nd ed, 2011; Cash, 2011; Tiggemann, Martins, & Churchett, 2008). This pursuit for increased muscularity is linked to the use of steroids or supplements and compulsive exercise(Tiggemann et al., 2008). Additionally, it has been found that unlike women, being underweight – not obese, increased the risk for major depression (Carpenter, Hasin, Allison, & Faith, 2000) and body image dissatisfaction (McCabe & Ricciardelli, 2004) for men. Because of low numbers, as also evidenced in this study, the population of underweight men is rarely the focus in research and it is recommended to oversample the underweight population for future studies.
Women, on the other hand, had increased risk for depression if they view themselves as overweight, as compared to women who viewed their weight as normal. Psychological distress as a result of viewing oneself as overweight can be attributed to the societal beauty ideal for women which emphasizes the desirability of thinness (Cash, 2011). In a review by Wertheim, Paxton and Blaney, girls’ preference to be
18
thin starts as early as pre-adolescence, where 40-50% desire to be thin and this number increases to 70% in adolescence (Wertheim, 2009). In interviews discussed in Grogan’s Body Image book, women, regardless of age, reported dissatisfaction with their stomach, hips and thighs and were motivated to lose weight and be slimmer (Grogan, 2008). There is substantial evidence that female adolescents and adults who have poor body image and body dissatisfaction are more likely to have clinically significant depression (Al Mamun et al., 2007; Jackson et al., 2014; Veggi, Lopes, Faerstein, & Sichieri, 2004). Aside from the desire to be thin, psychological stress with weight in women can also be attributed to weight stigma. Compared to men, weight discrimination is more strongly directed to women in the various domains of home, interpersonal relationships, employment, education and health care (Puhl & Heuer, 2009), justifying the association of overweight perception to depressive symptoms.
Patterns across age
The assumption that weight perceptions hold stronger association with depression than BMI still stands with the analysis across age groups. The pattern across age-groups of pooled men and women participants indicates that odds for depression is greater when middle-aged adults (OR=2.09, 95% C.I. 1.01-4.43) and older adults (OR=2.41, 95% C.I. 1.44-4.06 vs overweight perception OR=1.70, 95% C.I. 1.16-2.50) view their weights as underweight. On the other hand, lower odds (OR= 0.56, 95% C.I. 0.40-0.79) of depression for overweight adults was observed.
The difference in the BMI-perception-depression association can be accounted for by understanding that body image evolves with physical, psychological and emotional changes that accompany aging. In addition, unlike a longitudinal study that follows-up the same individuals as they age, this cross-sectional study involved participants from different generations with varied constructs unique to their own age group (Cash, 2011).
The apparent effect of viewing oneself as underweight to depression is apparent in middle and older adults. Being underweight later in life is associated with various disabilities (Bowen, 2012), frailty (Lee et al., 2014) and undernutrition and in a study on body function and appearance in middle- and older adults, it was found that older adults value body function more (Reboussin et al., 2000). Additionally, a cohort in Norway has found that self-rated health rapidly declined with increasing age among the underweight participants (Lorem, Schirmer, & Emaus, 2017). Thus, it is plausible that middle- and older adults, who value body function more, are more vulnerable to psychological distress when they perceive themselves as underweight. In a socio-cultural perspective, the “jolly fat” hypothesis (Crisp & McGuiness, 1976), which posits that middle-aged and older adults with obesity have a lower risk for anxiety and depression (only men), might offer an alternative explanation. Crisp and McGuiness discussed possible mechanisms to explain this hypothesis, including higher consumption of certain nutrients that could relieve the vegetative symptoms of depression via increased serotonergic activity (Crisp, Queenan, Sittampaln, & Harris, 1980).
19
Studies which support this hypothesis are mainly cross-sectional studies in Asian, mostly Chinese, populations (H.-H. Chang & Yen, 2012; Ho, Niti, Kua, & Ng, 2008; Zhang et al., 2016) and can be rooted in the Chinese’ association of happiness and obesity, as in gaining weight means gaining good fortune and wealth(Zhang et al., 2016). Given the heterogeneity of the population in the US, an amalgamation of cultures is largely probable. It is important to note as well, that though underweight perception increases depression risk in older adults more than overweight perception, those who overestimate their weights are almost as likely to be depressed. This indicates a possible pattern that older adults would rather be in the normal range, than be on either end of the weight spectrum.
With the unique patterns of the BMI-weight perception-depression association observed in this study, the relationship is clearly complex, and it is recommended that future studies consider age-focused analyses separated by sex to further explore the differences.
Patterns across race/ethnicity
The inclusion of race/ethnicity analyses in this study considers the diversity of cultural contexts of embodiment and the expansion of research on non-Western societies. The varied patterns between different groups show that socio-cultural factors play a role in how weight perception and BMI affect depression. After adjusting for covariates, BMI was not associated with depression in any of the race/ethnicity groups while weight perceptions showed significant associations with varied patterns across groups.
Unlike all other groups whose depression risk were affected by either perception, White Americans had increased odds for depression with both underweight and overweight perceptions. This is in conjunction with a large literature showing that in White Americans, internalization of weight bias is the highest compared to other ethnicities (Puhl, Himmelstein, & Quinn, 2018), and adaptation of social beauty ideals and body dissatisfaction are highly prevalent (Gitimu et al., 2016).
On the other hand, results showing that Black Americans are only more likely depressed when they view themselves as underweight and if they underestimate their weight is in agreement with well-documented evidence that Black individuals celebrate a larger body ideal, have higher BMI as compared to other ethnicities, are more likely to be more comfortable with their weight (Body image: A handbook of science,
practice, and prevention, 2nd ed, 2011). Thus, they internalize less psychological stress from weight bias
compared to White adults (Himmelstein, Puhl, & Quinn, 2017).
Hispanic Americans also showed a different pattern; Mexican Americans were more than three times likely (vs. Whites) to be depressed when they view themselves as underweight while neither BMI nor perceptions affected depression in other Hispanics. The Hispanic or Latino body image is generally considered to be more accepting of a wider range of body weights and sizes compared to White communities, but studies on body attitudes and satisfaction greatly vary and are sometimes contradictory (Cash, 2011). Latinos are
20
usually discussed as with a “dual identity”, traversing two sets of values that may greatly in their approach to health and beauty ideals (Schooler, 2008) and acculturation to mainstream American culture have been found to play a role in the development of body image concerns and disordered eating in the Hispanic Americans (Cachelin, Phinney, Schug, & Striegel-Moore, 2006; Gordon-Larsen, Harris, Ward, & Popkin, 2003). If acculturation plays a big role in the formation of body image ideals and thus weight perceptions, it is sensible that there may be differences in outcomes within the group of Hispanic Americans. With this, it can also be assumed that it is not only the ethnic origin that affects a Hispanic American’s weight perception but also the amount of immersion to the predominantly white population. It is suggested for future studies to consider analyses within the Hispanic American group in order to determine the different patterns of weight perception and depression.
Asian Americans are over two times more likely to be depressed if they overestimate their weights. Again, this can be linked to body satisfaction and weight stigma present in the specific group. A study on Asian American women (Smart & Tsong, 2014) revealed that their most common problems in weight, body and eating include weight gain, body dissatisfaction and the desire to be thinner. Perceived causes of these problems include the Asian culture’s emphasis on thinness, weight criticism in the family, and comparison to other Asian women. It should be noted that there is not an abundance of studies on depression, BMI or weight perception with the Asian American population and studies focusing on this group or a comparative study on the specific ethnic groups of the Asian American can reveal unique patterns.
Lastly, this study showed that in other ethnicities including multiracial persons, weight underestimation seemed to be protective factor against depression. It can be assumed that despite the diverse racial-ethnic backgrounds, the psychological stress of perceiving one’s weight as to be more than the socially accepted normal contributes greatly to depressive symptoms. To the extent of our knowledge, there is no study of weight perception and depression that involves only the multiracial population. Future studies might consider focusing on the multi-racial population to reveal association patterns prevalent in the group, adjusting for unique depression and weight perception covariates for people with mixed-races/ethnicities.
Strengths and limitations
Strengths of this study include using a large, nationally representative sample of community-dwelling adults in the US, whose depression status were determined using a validated and commonly used diagnostic tool (Kroenke et al., 2001). Analyses were also adjusted for an extensive range of covariates including socio-demographic profiles, medical history and lifestyle factors. To our knowledge, this is the first BMI-weight-perception-depression study to include total physical activity, history of diabetes and high blood pressure, and self-rated health as covariates all together in the logistic model. The analyses have been rid of residual confounding effects brought by these physical, mental, emotional and health-related factors. Additionally,
21
unlike previous studies which employed self-reported weights for the BMI variable (Atlantis & Ball, 2007; D. S. Kim et al., 2008), weight and height were measured by trained professionals in MECs. This reduces the residual confounding effect brought by the cognitive overlap of self-reported weight and height with body self-perception and image. This study also adds to the few studies that include the underweight population in terms of BMI and depression research. Results support that psychological distress is present not only in overweight perception but in any direction of the BMI spectrum, as long as it is deviating from the normal ideal.
Though results strongly suggest the importance of weight perception than actual weight to depression, a causal relationship cannot be established due to the cross-sectional nature of this study. Additionally, to avoid a relevant decrease of participants in each cell and ensure statistical relevance, analysis for age and race/ethnicity were not further separated according to sex. For future studies to have a more comprehensive comparative analysis within age groups only or within race/ethnicity groups only, it is suggested that separated analyses for males and females be done. Another important limitation that should be noted is the small number of underweight participants compared to other BMI subgroups which might have affected the statistical results. Underweight populations have been largely ignored because of their small number and because of the focus on obesity. From the findings that men tend to be more likely depressed when they view themselves as underweight, an oversampling of the underweight population is proposed for future studies. Also, since participants in this study are non-institutionalized adults, the survey might have excluded people who are institutionalized because of severe depression or severe obesity, thus, possibly constraining statistical power. As this study only included the weight perception aspect of body image, it is also suggested to further study other specific measures of body image (e.g. a comprehensive model including perceived weight discrimination and body image/ shape measurements) or their conjunction to explore multiple aspects that shape one’s body image as a whole in terms of depression. In relation to that, there might be residual confounding factors that have not been included in the models, as body image and depression are both complex constructs and conditions.
22
CONCLUSION
This study has found that weight perception is more strongly associated with depression than directly measured BMI. Adults who view themselves as deviating from the societal ideal of normal body size and weight are more at risk of depression and this pattern is somehow consistent across sex, age groups, and race/ethnicities. The relationship between weight, perception, and depression is indeed complex and identifying underlying pathways and contributing factors to the obesity-depression link are important to improve research, prevention and intervention efforts for both.
Policy and clinical implications
The main take away from this study is that, regardless of their actual weight, the US adult population is receiving psychological distress from the perceptions of their weight. This reflects the expansive reach of weight stigma. According to the COBWEBS model (Tomiyama, 2014) and a systematic review of weight perception studies (Haynes, Kersbergen, Sutin, Daly, & Robinson, 2018b), stress with one’s weight due to discrimination would trigger unhealthy behaviors that lead to future weight gain (Haynes et al., 2018a; Sutin & Terracciano, 2015; Tomiyama, 2014), reduced physical activity(Fredrickson, Kremer, Swinburn, de Silva, & McCabe, 2015), disordered eating(Kendrin R. Sonneville, Thurston, Milliren, Gooding, & Richmond, 2016), and poor quality of life (Park, Lee, Hwang, & Kwon, 2017), all the while not translating into healthy weight-related behaviors (Fredrickson et al., 2015) and might even worsen the burden of obesity.
The results of this study suggest the possibility that mainstream research on obesity and depression are overlooking the important role that perception play and thus, it is recommended that weight perception be included in analyses as a confounder. Also, prospective and/or well-designed studies are warranted to better understand the relationship of weight perception with depression. In public health and clinical practice, the consideration of weight perception in designing weight loss interventions is suggested. Additionally, programs which cultivate a healthy body image and include parts that work on self-esteem and acceptance are encouraged. Additionally, since health behavior change is important in managing obesity (Teixeira & Marques, 2018), rather than just focusing on achieving a number for a normal BMI, it is recommended to focus on building healthy habits instead, shifting from outcome goals to behavioral goals. Finally, given the difference in the patterns of the association in each sub-population, it is warranted that weight perceptions and its effect on depression within each group be studied in depth to be able to plan and implement individualized or customized public health programs and promotion specifically fit for each population.
23
REFERENCES
Abdelaal, M., le Roux, C. W., & Docherty, N. G. (2017). Morbidity and mortality associated with obesity. Annals of translational medicine, 5(7), 161-161. doi: 10.21037/atm.2017.03.107 Al Mamun, A., Cramb, S., McDermott, B. M., O'Callaghan, M., Najman, J. M., & Williams, G. M.
(2007). Adolescents’ Perceived Weight Associated With Depression in Young Adulthood: A Longitudinal Study. Obesity, 15(12), 3097-3105. doi: 10.1038/oby.2007.369
Anne Harring, H., Montgomery, K., & Hardin, J. (2011). Perceptions of Body Weight, Weight
Management Strategies, and Depressive Symptoms Among US College Students (Vol. 59).
Atlantis, E., & Baker, M. (2008). Obesity effects on depression: systematic review of epidemiological studies. International Journal Of Obesity, 32, 881. doi: 10.1038/ijo.2008.54
Atlantis, E., & Ball, K. (2007). Association between weight perception and psychological distress.
International Journal Of Obesity, 32, 715. doi: 10.1038/sj.ijo.0803762
Berrington de Gonzalez, A., Hartge, P., Cerhan, J. R., Flint, A. J., Hannan, L., MacInnis, R. J., . . . Thun, M. J. (2010). Body-mass index and mortality among 1.46 million white adults. The New England
journal of medicine, 363(23), 2211-2219. doi: 10.1056/NEJMoa1000367
Bin Li, Z., Yin Ho, S., Man Chan, W., Sang Ho, K., Pik Li, M., Leung, G. M., & Hing Lam, T. (2004). Obesity and depressive symptoms in Chinese elderly. International Journal of Geriatric
Psychiatry, 19(1), 68-74. doi: 10.1002/gps.1040
Bjerkeset, O., Romundstad, P., Evans, J., & Gunnell, D. (2007). Association of Adult Body Mass Index and Height with Anxiety, Depression, and Suicide in the General Population: The HUNT Study.
American Journal of Epidemiology, 167(2), 193-202. doi: 10.1093/aje/kwm280
Blazer, D. G., Moody-Ayers, S., Craft-Morgan, J., & Burchett, B. (2002). Depression in diabetes and obesity: Racial/ethnic/gender issues in older adults. Journal of Psychosomatic Research, 53(4), 913-916. doi: https://doi.org/10.1016/S0022-3999(02)00314-8
Bloom B, J. L., Freeman G. (2013). Summary health statistics for U.S. children: National Health Interview Survey, 2012. National Center for Health Statistics, Vital Health Stat (10(258)).
Body image: A handbook of science, practice, and prevention, 2nd ed. (2011). New York, NY, US:
Guilford Press.
Bowen, M. E. (2012). The Relationship Between Body Weight, Frailty, and the Disablement Process. The
Journals of Gerontology: Series B, 67(5), 618-626. doi: 10.1093/geronb/gbs067
Byeon, H. (2015). Association between Weight Misperception Patterns and Depressive Symptoms in Korean Young Adolescents: National Cross-Sectional Study. PLOS ONE, 10(8), e0131322. doi: 10.1371/journal.pone.0131322
Cachelin, F. M., Phinney, J. S., Schug, R. A., & Striegel-Moore, R. H. (2006). Acculturation and Eating Disorders in a Mexican American Community Sample. Psychology of Women Quarterly, 30(4), 340-347. doi: 10.1111/j.1471-6402.2006.00309.x
24
Calle, E. E., Rodriguez, C., Walker-Thurmond, K., & Thun, M. J. (2003). Overweight, Obesity, and Mortality from Cancer in a Prospectively Studied Cohort of U.S. Adults. New England Journal of
Medicine, 348(17), 1625-1638. doi: 10.1056/NEJMoa021423
Carpenter, K. M., Hasin, D. S., Allison, D. B., & Faith, M. S. (2000). Relationships between obesity and DSM-IV major depressive disorder, suicide ideation, and suicide attempts: results from a general population study. American journal of public health, 90(2), 251-257.
Cash, T. F., & Smolak, L. (Eds.). (2011). Body image: A handbook of science, practice, and prevention,
2nd ed. New York, NY, US: Guilford Press.
Chang, H.-H., & Yen, S. T. (2012). Association between obesity and depression: Evidence from a longitudinal sample of the elderly in Taiwan. Aging & Mental Health, 16(2), 173-180. doi: 10.1080/13607863.2011.605053
Chang, V. W., & Christakis, N. A. (2001). Extent and determinants of discrepancy between
self-evaluations of weight status and clinical standards. Journal of General Internal Medicine, 16(8), 538-543. doi: 10.1046/j.1525-1497.2001.016008538.x
Cramer, P., & Steinwert, T. (1998). Thin is good, fat is bad: How early does it begin? Journal of Applied
Developmental Psychology, 19(3), 429-451. doi: https://doi.org/10.1016/S0193-3973(99)80049-5
Crandall, C. S. (1994). Prejudice against fat people: Ideology and self-interest. Journal of Personality and
Social Psychology, 66(5), 882-894. doi: 10.1037/0022-3514.66.5.882
Crisp, A. H., & McGuiness, B. (1976). Jolly fat: relation between obesity and psychoneurosis in general population. British medical journal, 1(6000), 7-9.
Crisp, A. H., Queenan, M., Sittampaln, Y., & Harris, G. (1980). ‘Jolly fat’ revisited. Journal of
Psychosomatic Research, 24(5), 233-241. doi: https://doi.org/10.1016/0022-3999(80)90013-6
de Wit, L., Luppino, F., van Straten, A., Penninx, B., Zitman, F., & Cuijpers, P. (2010). Depression and obesity: A meta-analysis of community-based studies. Psychiatry Research, 178(2), 230-235. doi: https://doi.org/10.1016/j.psychres.2009.04.015
de Wit, L. M., van Straten, A., van Herten, M., Penninx, B. W. J. H., & Cuijpers, P. (2009). Depression and body mass index, a u-shaped association. BMC public health, 9, 14-14. doi: 10.1186/1471-2458-9-14
Drukker, M., Wojciechowski, F., Feron, F., Mengelers, R., & van Os, J. (2009). A community study of psychosocial functioning and weight in young children and adolescents. International Journal of
Pediatric Obesity, 4(2), 91-97. doi: 10.1080/17477160802395442
Fredrickson, J., Kremer, P., Swinburn, B., de Silva, A., & McCabe, M. (2015). Weight perception in overweight adolescents: Associations with body change intentions, diet and physical activity.
Journal of Health Psychology, 20(6), 774-784. doi: 10.1177/1359105315580223
Gaskin, J. L., Pulver, A. J., Branch, K., Kabore, A., James, T., & Zhang, J. (2013). Perception or reality of body weight: Which matters to the depressive symptoms. Journal of Affective Disorders, 150(2), 350-355. doi: https://doi.org/10.1016/j.jad.2013.04.017