† 교신저자, 삼성물산(주) 건설부문, 기술연구소 E-mail : [email protected] * 삼성물산(주) 건설부문, 토목기술실 ** 한국기계연구원, 자기부상연구실
자기부상열차 시험노선의 궤도틀림 분석
Irregularity Analysis of Maglev Test Track
김상범† 강기동* 한형석** 이종민**
Saang Bum Kim Kee-Dong Kang Hyung-Suk Han Jong-Min Lee
ABSTRACT
Power spectral density (PSD) model of irregularities for the maglev test track is presented. Track irregularities (gauge, cant, twist and vertical) were calculated from the survey data of sleepers on the test track. PSD model was constructed from the estimated PSDs of each track irregularities. Versine (gauge, cant, twist, vertical and lateral) of the track is obtained and their PSDs were estimated, too. Presented PSD model can be used for the analysis of levitation stability and ride quality of the maglev system.
1. 서론 자기부상열차 시험노선의 궤도틀림을 분석하였다. 자기부상열차에서 부상제어시스템의 안정성과 주행성능 은 궤도틀림의 영향을 받는다. 주어진 궤도틀림에 대하여 부상안정성과 주행성능을 분석할 수 있으며, 원하는 부상안정성과 주행성능을 얻기 위해서는 궤도틀림에 대한 적절한 기준을 설정하고 관리하여야 한다. 궤도의 틀림을 검측하는 방법으로는, 검측차를 사용하여 Versine을 구하는 방법이 일반적이나 검측차와 검측방법에 의한 왜곡이 발생한다. 이번 연구에서는 SDL30 Digital Level과 SRX3를 사용하여 측량된, 자기부상열차 시 험노선의 궤도 좌표를 사용하여 궤도틀림 분석을 수행하였다. 측량을 통해 구한 좌우 궤도의 침목위 좌표로 부터 gauge, cant, twist, vertical 궤도틀림을 직접 구하고, 각각의 Power Sprectral Density (PSD)를 추 정하였다. 또한 궤도의 gauge, cant, twist, vertical 및 lateral Versine을 구하고 각각의 PSD를 추정하였 다. 기존의 도시형 자기부상열차 시스템 연구에 사용된 궤도틀림의 PSD model과 측량을 통해 추정된 PSD 를 비교하여, 자기부상열차 시험노선의 PSD model을 구성하였고, 구성된 PSD model을 만족하는 random signal을 생성하였다. 구성된 시험노선의 PSD model과 생성된 궤도틀림 random signal은 자기부상열차 교 량의 최적설계에 활용할 수 있을 것으로 예상된다. 2. 자기부상열차 시험노선 자기부상열차 시험노선은 거더 43개로 이루어진 주노선과 거더 5개로 이루어진 보조노선, 그리고 분 기기가 있다 (그림 1.). 특히 주노선에는 분기기 구간의 침목 34개를 포함하여 총 1092개의 침목이 설 치되어 있다. 이번 연구에서는 2008년 11월에 수행된 도시형 자기부상열차 시험선 개보수 시공자료를 기준으로 하여, 3차원 측량기(SRX3)를 사용하여 2009년에 측정된 좌우 궤도의 침목위 3차원 좌표와, SDL30 Digital Level을 사용하여 2009년과 2010년에 측정된 좌우 궤도의 침목위 고저 좌표를 사용하 여, 자기부상열차 시험노선의 gauge, cant, twist, vertical 궤도틀림을 구하였다.
G01 01 G01 01 G0920 G0920 G1813 G1813 G2524 G2524 G35 12 G35 12 G42 14 G42 14 Switch31 Switch31 2800 2900 3000 3100 3200 3300 3400 3500 5000 5050 5100 5150 5200 x y 0 50 100 150 200 250 300 51 52 53 54 55 ID Hei ght
m
(a) Layout (b) Vertical profile 1: straight line
53.450 50 100 150 200 250 53.46 53.47 53.48 53.49 53.50 53.51 ID He ig ht
m
53.480 50 100 150 200 250 53.50 53.52 53.54 53.56 ID He ig ht
m
(c) Vertical profile 2: curved line (d) Vertical profile 3: straight & switch
53.520 50 100 150 53.54 53.56 53.58 53.60 ID He ig ht
m
53.560 5 10 15 20 25 30 35 53.562 53.564 53.566 53.568 53.570 53.572 ID H ei ght
m
(e) Vertical profile 4: curved line (f) Vertical profile 5: straight line 그림 1. Profile of the KIMM's maglev test track
SDL30 Digital Level과 SRX32009년에 측량을 통해 구한 분기기 구간 침목의 높이방향 좌표를 그림 2.에 나타내었다. 매 측량시의 기준 고도의 변화를 감안하면, 측량을 통하여 구한 궤도의 좌표값의 신뢰 성을 확인할 수 있으며, 향후 보다 정밀한 오차분석이 필요하다고 판단된다.
그림 2. Vertical profile of sleepers at the switch section (Red: 2009 3D, Violet: 2009 Level, Blue: 2010)
3. 궤도틀림분석 측량을 통해 구한 자기부상열차 시험노선의 좌측궤도의 vertical irregularity는 다음과 같다. 0 200 400 600 800 1000 0.000 0.005 0.010 Distance
m
V er tic al Irr egular ity
m
(a) Vertical irregularity (b) PSD of vertical irregularity
0 200 400 600 800 1000 0.006 0.004 0.002 0.000 0.002 0.004 0.006 Distance
m
V ert ic al Irr egu lari ty
m
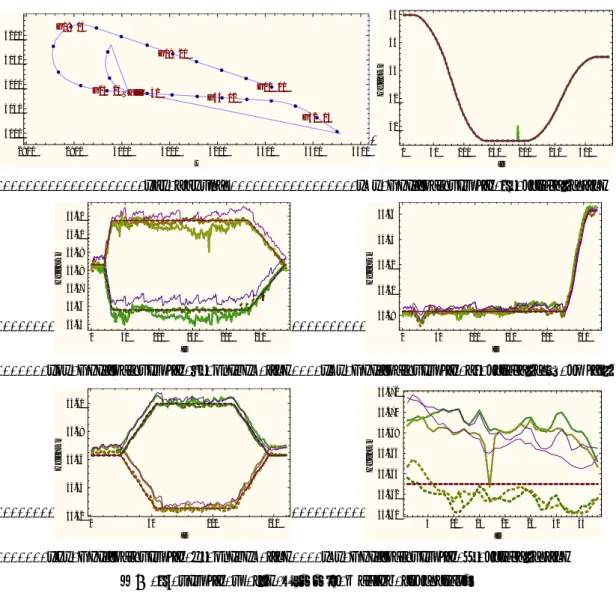
(c) Versine of vertical irregularity (d) PSD of vertical irregularity 그림 3. Vertical irregularity of left rail estimated from the surveying with level (2010) Versine은 chord 길이 1.2 m를 기준으로 하여 해석적으로 변환하여 구하였다. 초기 100 m 까지의 신호를 보면, Versine 변환을 통하여 장파장 경향이 사라지는 것을 알 수 있으며, PSD에서 0.833 cycle/m (= 1 / 1.2 m)의 정수배 spectral frequency에서 주기적으로 왜곡이 발생하는 것을 알 수 있다. 기존의 도시형 자기부상열차 시스템 연구에 사용된 궤도틀림의 PSD model과 측량을 통해 추정된 PSD를 비교하였다. 녹색은 고속철도에서 사용되는 PSD model이고, 붉은색은 프랑스의 Prud'homme이 제 안한 model이며, 점선은 Morita 등이 일본의 도시형 자기부상열차(LINIMO, HSST System) 연구에서 사용
한 model[2]을 기본으로 하여, 추정된 PSD에 맞게 구성한 model이다. 우측궤도의 vertical irregularity는 다음과 같다. 0 200 400 600 800 1000 0.005 0.000 0.005 0.010 Distance
m
V ert ic al Irr egu lari ty
m
0 200 400 600 800 1000 0.006 0.004 0.002 0.000 0.002 0.004 0.006 Distance
m
V ert ic al Irr egu lari ty
m
(c) Versine of vertical irregularity ('09, level) (d) PSD of vertical irregularity ('09, level)
0 200 400 600 800 1000 0.015 0.010 0.005 0.000 0.005 0.010 Distance
m
V ert ic al Irr egu lari ty
m
(e) Versine of vertical irregularity ('09, 3D) (f) PSD of vertical irregularity ('09, 3D) 그림 4. Vertical irregularity of right rail estimated from the surveying
좌측궤도와 우측궤도의 vertical irregularity는 비슷한 경향을 보이며, 3차원 측량기 (SRX3)으로 측 량한 결과가 다소 크게 나타났다. Gauge와 cant irregularity는 다음과 같다.
0 200 400 600 800 1000 1.405 1.410 1.415 1.420 1.425 1.430 Distance
m
V er tic al Irr egular ity
m
(a) Gauge irregularity (b) PSD of gauge irregularity
0 200 400 600 800 1000 0.08 0.06 0.04 0.02 0.00 0.02 0.04 0.06 Distance
m
C ant Ir regu lar ity
m
(c) Cant irregularity (d) PSD of cant irregularity 그림 5. Gauge and cant irregularities estimated from the surveying with SRX3
4. 궤도틀림의 PSD Model
측량을 통해 추정된 궤도틀림의 PSD로부터 자기부상열차 시험노선의 PSD model을 구성하였다. 구성된
모델은 Morita 등이 일본의 도시형 자기부상열차(LINIMO, HSST System) 연구에서 사용한 model[2]을 기
본으로 하였다.
S
z
2 ug 2 9
2L chord 1
2
12
2
12 (1) 여기서,S
z: PSD Model (m2
cycle
m)
: Spatial freqeuncy (cycle
m)
1: Cut-off spatial frequencyu
g: Upper limit of vertical versine during guideway construction and maintenanceL
chord: Length of the chord in measuring versine
(a) Simulated rail irregularity (b) PSD of simulated rail irregularity 그림 6. Simulated rail irregularity based on the PSD model
5. 결론
자기부상열차 시험노선의 궤도틀림을 분석하였다. 측량을 통해 구한 궤도틀림으로부터 Power Sprectral Density (PSD)를 추정하였다. 기존의 도시형 자기부상열차 시스템 연구에 사용된 궤도틀림의 PSD model과 측량을 통해 추정된 PSD를 비교하여, 자기부상열차 시험노선의 PSD model을 구성하였고, 구성된 PSD model을 만족하는 random signal을 생성하였다. 구성된 시험노선의 PSD model과 생성된 궤도틀림 random signal은 자기부상열차 교량의 최적설계에 활용할 수 있을 것으로 예상된다.
참고문헌
1. H. S. Han, B. H. Yim, N. J. Lee and Y. J. Kim, “Prediction of ride quality of a Maglev vehicle using a full vehicle multi-body dynamic model,” Vehicle Systme Dynamics, 47(10), pp.1271-1286, 2009.
2. M. Morita, M. Iwaya and M. Fujino, "The characteristics of the levitation system of LINIMO (HSST System)," Maglev 2006 Proceedings, Shanghai, China, 2004, pp.525-532, 2006.