Published by Canadian Center of Science and Education
Firm Size and Different Priorities in Capital Structure Policy
Seok Weon Lee1
1 Division of International Studies, Ewha Woman’s University, Seoul, Korea
Correspondence: Seok Weon Lee, Division of International Studies, Ewha Woman’s University, Seoul, Korea. Tel: 82-2-3277-4456. E-mail: [email protected]
Received: April 2, 2015 Accepted: April 30, 2015 Online Published: June 26, 2015 doi:10.5539/res.v7n11p15 URL: http://dx.doi.org/10.5539/res.v7n11p15
Abstract
The objective of this study is to empirically examine how the bank capital structure policy is related to bank asset size. More specifically, by partitioning the full sample banks into two groups, i.e., the group of larger asset size banks vs the group of smaller asset size banks, we examine whether there is any difference in the determinants of capital structure decision between the two groups. Based on a panel regression analysis for Korean banks over the sample period 2000-2008, this study finds that the determinants for capital structure are substantially different between the two groups. Asset size and profitability affect the capital structure of the two groups in the same way. However, small banks’ capital structure decision shows that their capital ratio is positively related to both loan ratio and nonperforming loan ratio. This implies that small banks appear to put higher priority on investment policy for future growth than financial policy. The positive relation between nonperforming loan ratio and capital ratio for small banks implies that small banks have the tendency to decrease their debt ratio with financial risk-management purpose when their risk status measured by nonperforming loan ratio is high. However, both loan ratio and nonperforming loan ratio turned out not to affect the capital structure decision of the group of large banks. Instead the proportion of outside shareholdings which is used as the measure of the bank ownership structure turns out to negatively affect the bank capital ratio. Overall, these results imply that small banks tend to consider their investment opportunities and risk status as important explanatory variables for the capital structure decision. In contrast, large banks put a priority on the ownership structure in making capital structure decision. These results may suggest that to achieve a stable capital healthiness of the banks which is one essential requirement for the safety and soundness of the banking industry, bank regulator may have to implement a discriminatory regulatory policy between the group of large banks and small banks. Ignoring bank asset size and different characteristics, and imposing a one-way capital-structure regulatory policy would not be effective in making capital structure of the banks sound and healthy.
Keywords: capital strength, firm size, investment, financing, regulation 1. Introduction
A seminal paper by Modigliani and Miller (1958) shows that the value of the firm value is independent of how equity and debt claims are mixed in perfect capital markets. In practice, however, capital markets are imperfect and financing method does matter. The issue of capital structure has been one of the most important issues in corporate finance for a long time. There are three theories that seek to explain the mechanism of determining the capital structure of the firm. Tradeoff theory says that firms will borrow to the point that the marginal value of the tax benefit equals the marginal cost of financial distress. This is the point where the firm achieves the optimal capital structure. Pecking order theory emphasizes the information asymmetry between insiders (managerial owners) and outside investors. This theory says that firms prefer internal capital to external financing. But when external financing is needed firms want to issue the least risky securities because of information asymmetry. Thus debt financing is preferred to equity financing. It implies no existence of optimal capital structure. Finally, the agency cost theory says that optimal capital structure is achieved at the point where the agency cost, conflict of interest between shareholders and debtholders, is minimized.
Numerous researches have been conducted to explain the determinants of firms’ capital structure. The followings are some of them. Martin et al. (1988) found a positive relation between the size of firms and capital ratio. Kim and Sorensen (1986), Titman and Wessels (1988) found a negative relationship between growth rate and debt level. Kester (1986), Friend and Hasbrouck (1989), Friend and Lang (1988) show that negative relationship exist between the level of debt and profitability. Myers and Majluf (1984), Jensen, Solberg and Zorn (1992) found a
positive relation between profitability and equity ratio. Bradley, Jarrel and Kim (1984) found a negative relation between the firm’s risk and the level of debt financing.
The objective of this study is to add some more evidences to the literature of capital structure issues by empirically examining how the bank capital structure policy is related to bank asset size. More specifically, by partitioning the full sample banks into two groups, i.e., the group of larger asset size banks vs the group of smaller asset size banks, we examine whether there is any difference in the determinants of capital structure decision between the two groups. Based on a panel regression analysis for Korean banks over the sample period 2000-2008, this study finds that the determinants for capital structure are substantially different between the two groups. Asset size and profitability affect the capital structure of the two groups in the same way. However, small banks’ capital structure decision shows that their capital ratio is positively related to both loan ratio and nonperforming loan ratio. Considering that loan ratio may be one of the best measures capturing the possibility of the bank’s future growth or investment opportunity, this result that small banks tend to decrease debt financing when loan ratio is high represents that the small banks strategically prepare for the needs of future cash spending by decreasing debt financing when the loan ratio is high. Thus this implies that small banks appear to put higher priority on investment policy for future growth than financial policy. The positive relation between nonperforming loan ratio and capital ratio for small banks implies that small banks have the tendency to decrease their debt ratio with financial risk-management purpose when their risk status measured by nonperforming loan ratio is high. However, both loan ratio and nonperforming loan ratio turned out not to affect the capital structure decision of the group of large banks. Instead the proportion of outside shareholdings which is used as the measure of the bank ownership structure turns out to negatively affect the bank capital ratio. Overall, these results imply that small banks tend to consider their investment opportunities and risk status as important explanatory variables for the capital structure decision. In contrast, large banks put a priority on the ownership structure in making capital structure decision. These results may suggest that to achieve a stable capital healthiness of the banks which is one essential requirement for the safety and soundness of the banking industry, bank regulator may have to implement a discriminatory regulatory policy between the group of large banks and small banks. Ignoring bank asset size and different characteristics, and imposing a one-way capital-structure regulatory policy would not be effective in making capital structure of the banks sound and healthy.
Data, estimation model and hypotheses are described in next section. Section 3 presents test results, and section 4 discusses concluding comments.
2. Data, Estimation Model and Hypotheses
The database for this research comes from the Statistics of Bank Management from the Korean Financial Supervisory Service. The sample period covers 2000-2008. During this sample period, we collect some important bank characteristic variables for each bank measuring bank asset size, asset portfolio composition, ownership structure, profitability, risk as well as capital (financial) structure.
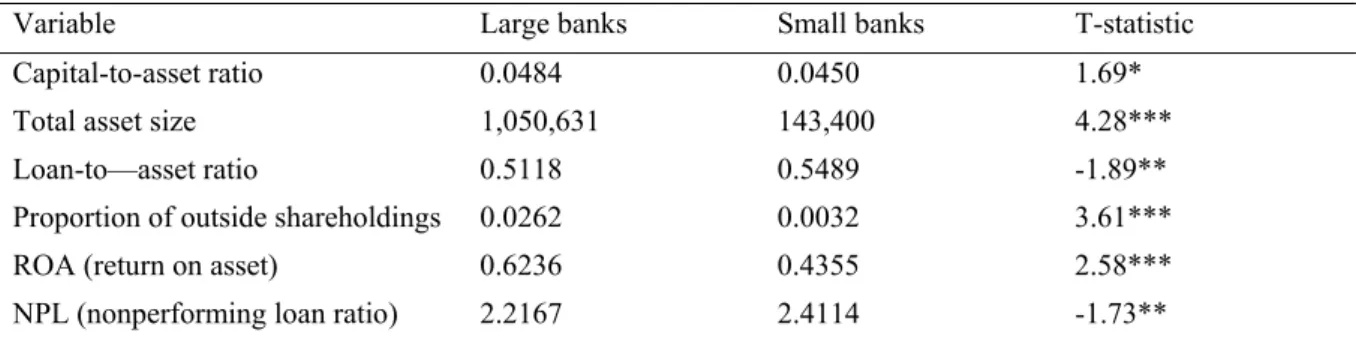
Table 1 provides t-test result for the difference of the mean value of the variables used in the study between larger and smaller banks. Each year, each bank is classified into either larger or smaller banks based on its asset size relative to the median value for all the banks’ asset size. It is shown in the table that the capital-to-asset ratio is significantly greater for the group of larger banks. Loan-to-asset ratio is greater for the group of smaller banks. Ownership structure measured by the bank’s proportion of outside shareholdings is greater for the larger banks. Profitability measured by the bank ROA (return on asset) is greater for the larger banks. NPL (nonperforming loan ratio) is lower for the larger banks.
Table 1. T-test for the difference of the means between large banks and small banks
Variable Large banks Small banks T-statistic
Capital-to-asset ratio 0.0484 0.0450 1.69*
Total asset size 1,050,631 143,400 4.28***
Loan-to—asset ratio 0.5118 0.5489 -1.89**
Proportion of outside shareholdings 0.0262 0.0032 3.61***
ROA (return on asset) 0.6236 0.4355 2.58***
NPL (nonperforming loan ratio) 2.2167 2.4114 -1.73**
To investigate how the determinants of the capital structure decision differ between the large banks and small banks, the following multivariate panel regression equation is estimated over the period 2000-2008 for both groups separately. Each year, each bank is classified as either large or small bank based on its asset size compared to the median value of all the banks.
(Capital-to-asset)i,t = β0+β1(Total asset size)i,t+β2(Loan-to-asset)i,t +β3(Ownership structure)i,t+β4(Profit)i,t+β5(NPL)i,t +εi,t --(1)
As the measure of the bank’s healthiness of capital structure, bank capital-to-asset ratio is used as the dependent variable of the regression. As the independent variables that are presumed to affect bank capital structure, we include bank’s total asset size, loan-to-asset ratio, ownership structure which is measured by the proportion of outside shareholdings, profitability which is measured by the bank ROA (return on asset), and the nonperforming loan ratio.
Based on the implication of finance literature, the following relations between the above explanatory variables and bank capital ratio are expected.
Asset size is expected to be negatively related to bank capital ratio. Other things being equal, larger banks are presumed to have lower possibility of bankruptcy by investors, and even bank regulators are unwilling to let large banks fail because of its potential damage to the whole economy. Also, large banks would have better abilities to diversify and manage their asset portfolios. These characteristics would give large banks greater incentives to use more debt and less capital.
The relation between bank loan-to-asset ratio and capital structure is two-way. Loans are generally considered to be the most important source of bank profit and future growth opportunity. Accordingly loans are the highest risk category asset because its future performance heavily depends on future economic condition. The first argument focuses on the role the bank loan is playing with respect to bank investment decision. The second argument focuses on the role the bank loan is playing with respect to bank financial risk management. If the first effect dominates, the loan ratio and capital ratio would be negatively related because bank would try to maximize its future profit and growth by choosing higher financial leverage. On the other hand, if the second effect dominates, the bank with greater loan ratio would need to increase its capital ratio for a safer financial structure.
Regarding the relation between bank ownership structure and capital ratio, there is not any general agreement. The main hypothesis focusing on the effect of the agency cost of debt predicts a positive relation between the proportion of outside shareholding and capital ratio. On the other hand, if the incentives by the insiders or managerial owners who want to minimize the risks of losing their jobs and employment are a dominating effect, the relation between the proportion of outside shareholding and capital ratio would be negative.
The relations between bank profit and capital ratio, NPL and capital ratio are quite clear. The greater ROA represents, other thing being equal, greater retained earnings, which is leaded into higher capital ratio. Overall, higher NPL represents riskier status, and therefore, as the motivation for risk management, the bank would try to increase its capital ratio.
3. Empirical Results
3.1 Estimation Results for Full Sample
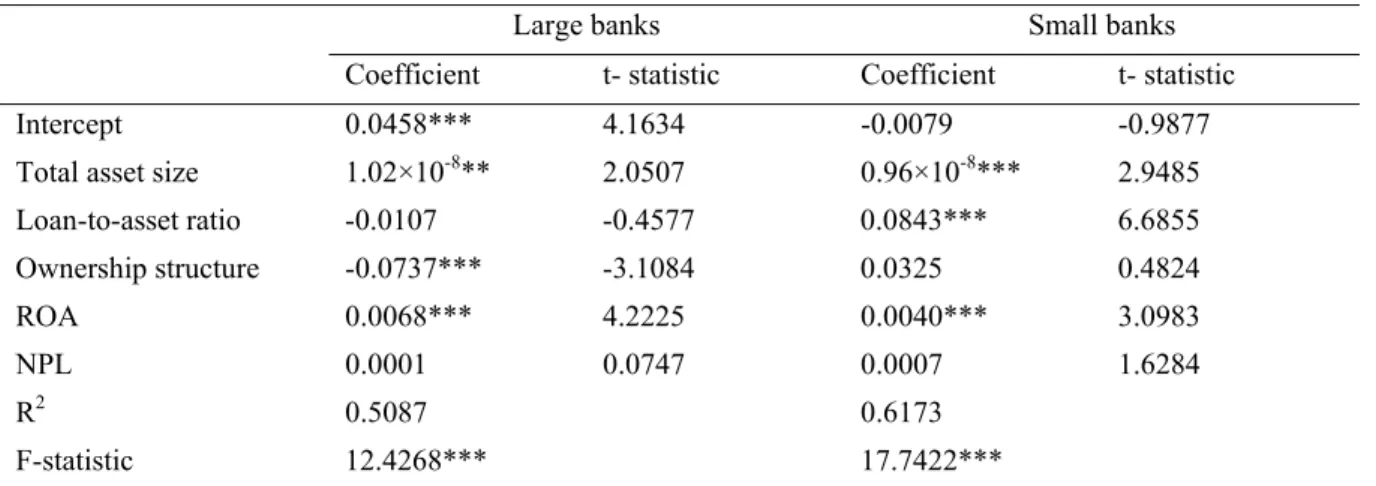
Table 2 shows the estimation results for the difference in capital structure decision between the group of large and small banks. First of all, the table shows that both asset size and ROA are significantly positively related to bank capital ratio of both small and large banks. The positive relation between ROA and capital ratio is the one expected. The higher the ROA, the more the retained earnings the firm will have, which will increase the firm’s capital ratio. However, unlike our expectation, the bank asset size turned out to be positively related to bank capital ratio. We presume this result would be related to the capital strength requirement associated with bank assets size during the sample period of this study. In the process of overcoming the financial crisis prevailing over the late 1997s through the early 2000s. many financially unhealthy and small banks were acquired by financially safer and larger banks. And therefore, bank regulator strengthen supervision for the soundness of the capital structure of large banks.
Table 2 shows more interesting and important differences on the capital ratio determinants between large and small banks. It shows significant differences with respect to loan ratio and nonperforming loan ratio between large and small banks. Loan ratio is significantly positively related to the capital ratio for small banks, however, is insignificant for large banks. This result may imply that the two group banks may different priorities in capital structure policy. The significant positive relation of small banks’ loan ratio on capital ratio implies that the small
banks tend to decrease (increase) the debt ratio (capital ratio) when their loan ratios are high. Higher loan ratio, generally, implies that the banks have more opportunities of making future profit and are aggressively involved in investment risk taking which may be associated with more future needs of funds. Thus, the result that small banks tend to decrease debt financing represents that the small banks strategically prepare for this needs of future cash spending. Thus this implies that small banks appear to put higher priority on investment policy for future growth than financial policy. However, this behavior does not occur in large banks. One reason for this result may be attributed to the fact that large banks have better access to external capital market to raise funds.
Regarding nonperforming loan ratio, the positive relation at 11% significance level for small banks implies that small banks have some tendency to decrease their debt ratio with financial risk-management purpose when their risk status measured by nonperforming ratio is high. This tendency does not appear to exist in large banks. With respect to the proportion of outside shareholding, it is significantly negatively related to capital ratio only for large banks. For small banks, the coefficient is not significant. Large banks tend to adopt more aggressive capital structure policy when there are a large proportion of outside shareholders. This result implies that the request of outside shareholders toward bank management to increase the bank leverage taking various advantages associated with large asset size such as better abilities for access to external capital market and lower possibility of bankruptcy may be stronger for the banks with larger asset size.
Overall, the results in table 2 imply that there is a significant difference in the capital structure determination between large and small banks. Small banks appear to consider their investment opportunities and risk status as important explanatory variables. In contrast, large banks pus a priority on the governance structure in making capital structure decision.
Table 2. Regression results for the group of large banks and small banks
Large banks Small banks
Coefficient t- statistic Coefficient t- statistic
Intercept 0.0458*** 4.1634 -0.0079 -0.9877
Total asset size 1.02×10⁻⁸** 2.0507 0.96×10⁻⁸*** 2.9485
Loan-to-asset ratio -0.0107 -0.4577 0.0843*** 6.6855 Ownership structure -0.0737*** -3.1084 0.0325 0.4824 ROA 0.0068*** 4.2225 0.0040*** 3.0983 NPL 0.0001 0.0747 0.0007 1.6284 R2 0.5087 0.6173 F-statistic 12.4268*** 17.7422***
*, **, *** indicate statistical significance at the 10, 5, or 1% significance level, respectively.
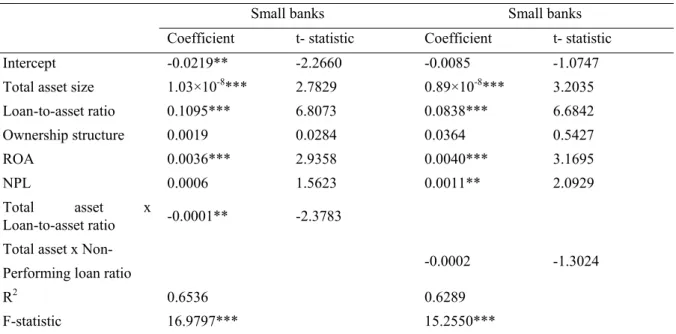
3.2 Interaction Effect Test
To find more implications about the banks’ capital structure decision with respect to asset size, we conduct some interaction effect test for the explanatory variables included in the equation 1. In table 3, we include the interaction variable between the two significant explanatory variables and asset size for the group of small banks. That is the variables, “asset size x loan ratio” and “asset size x nonperforming loan ratio” are added in the estimation equation 1. The results in table 3 show that the coefficient on “asset size x loan ratio” is significantly negative. This result indicates that, given the significantly positive relation between capital ratio and loan ratio of the small banks, the tendency for the small banks to decrease the debt ratio when the loan ratio is high gets less as the asset size gets larger. Thus, small banks’ tendency to put the priority on investment policy for future growth gets weaker when the bank asset size gets larger. This result may be attributed to the various advantages associated with large asset size. Similar implication can be found from the second table in the significantly negative coefficient on the interaction variable “asset size x nonperforming loan ratio”. This result indicates that small banks’ need to make financial risk-management decision by decreasing debt ratio when the nonperforming loan ratio is high gets weaker as their asset size gets larger. We conduct interaction effect tests for the other explanatory variables, too. However all of them report insignificant results, and are available from the authors upon request.
Table 3. Regression results for the Interaction effects
Small banks Small banks
Coefficient t- statistic Coefficient t- statistic
Intercept -0.0219** -2.2660 -0.0085 -1.0747
Total asset size 1.03×10⁻⁸*** 2.7829 0.89×10⁻⁸*** 3.2035
Loan-to-asset ratio 0.1095*** 6.8073 0.0838*** 6.6842 Ownership structure 0.0019 0.0284 0.0364 0.5427 ROA 0.0036*** 2.9358 0.0040*** 3.1695 NPL 0.0006 1.5623 0.0011** 2.0929 Total asset x Loan-to-asset ratio -0.0001** -2.3783
Total asset x Non-
Performing loan ratio -0.0002 -1.3024
R2 0.6536 0.6289
F-statistic 16.9797*** 15.2550***
*, **, *** indicate statistical significance at the 10, 5, or 1% significance level, respectively.
3.3 Step-Wise Regression
In table 4, we run step-wise regression by omitting the insignificant explanatory variables one by one from the estimation results in table 2. For the group of large banks, nonperforming loan ratio was omitted first, and both nonperforming loan ratio and loan ratio were omitted second. For the group of small banks, the proportion of outside shareholdings was omitted first, and both proportion of outside shareholdings and nonperforming loan ratio were omitted second. The results and findings are exactly the same as the original regression results in table 2.
Table 4. Step-wise regression results
Large banks Large banks
Coefficient t- statistic Coefficient t- statistic
Intercept 0.0460*** 4.4717 0.0413*** 16.3510
Total asset size 1.01×10⁻⁸*** 2.0856 0.89×10⁻⁸** 2.4510
Loan-to-asset ratio -0.0109 -0.4698
Ownership structure -0.0735*** -3.1433 -0.0723*** -3.1303
ROA 0.0067*** 5.2720 0.0067*** 5.2877
R2 0.5087 0.5069
F-statistic 15.7896*** 21.2463***
*, **, *** indicate statistical significance at the 10, 5, or 1% significance level, respectively.
Small banks Small banks
Coefficient t- statistic Coefficient t- statistic
Intercept -0.0066 -0.8815 -0.0001 -0.0087
Total asset size 1.01×10⁻⁸*** 2.9867 1.02×10⁻⁸*** 2.7521
Loan-to-asset ratio 0.0824*** 6.9326 0.0748*** 6.8005
NPL 0.0006 1.5715
R2 0.6157 0.5987
F-statistic 22.4269*** 28.3485***
*, **, *** indicate statistical significance at the 10, 5, or 1% significance level, respectively.
3.4 Further Tests
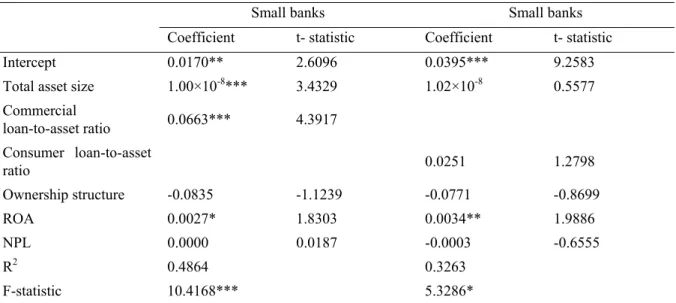
In table 5, we replace the loan ratio by the other two alternative variables to better understand the capital structure decision of the small banks. Loan ratio is replaced by the commercial loan ratio and consumer loan ratio, respectively. Table 5 shows that the commercial loan ratio is significantly positively related to the bank capital ratio, but the consumer loan ratio is not significant. Thus this result says that the small group banks’ behavior of decreasing debt when the loan ratio is high occurs for the bank commercial loan ratio. This might indicate that the banks may interpret the lending to corporate sector as a more meaningful opportunity for future growth than consumer loans. This result is understandable considering that the return on commercial loan is very highly correlated with general development of economic condition. Systematic risk may be a more germane type of risk having a greater influence on the firm’s profit.
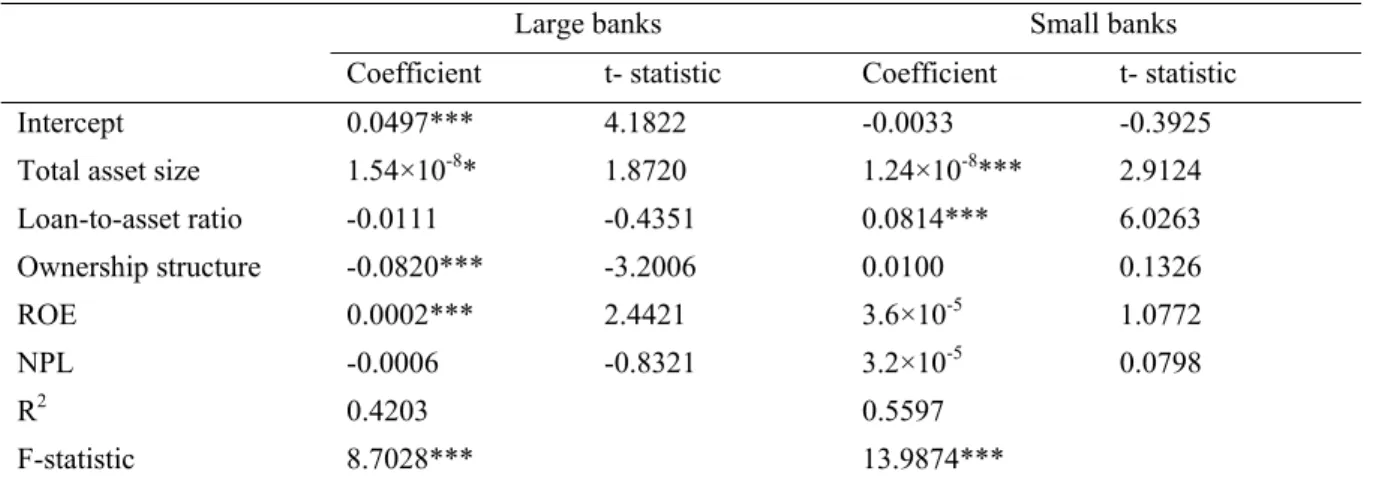
As an additional further test, we employ another profitability measure of the firm ROE (return on equity) instead of ROA, and estimate the equation 1 for both groups. As shown in table 6, the main findings are very similar to those in table 2 in which ROA was used. There is a significant positive relationship between loan ratio and capital ratio for the group of small banks, and there is a significant negative relationship between outside shareholders and capital ratio for the group of large banks.
Table 5. Regression results for the further tests
Small banks Small banks
Coefficient t- statistic Coefficient t- statistic
Intercept 0.0170** 2.6096 0.0395*** 9.2583
Total asset size 1.00×10⁻⁸*** 3.4329 1.02×10⁻⁸ 0.5577
Commercial loan-to-asset ratio 0.0663*** 4.3917 Consumer loan-to-asset ratio 0.0251 1.2798 Ownership structure -0.0835 -1.1239 -0.0771 -0.8699 ROA 0.0027* 1.8303 0.0034** 1.9886 NPL 0.0000 0.0187 -0.0003 -0.6555 R2 0.4864 0.3263 F-statistic 10.4168*** 5.3286*
Table 6. Regression results for the group of large banks and small banks
Large banks Small banks
Coefficient t- statistic Coefficient t- statistic
Intercept 0.0497*** 4.1822 -0.0033 -0.3925
Total asset size 1.54×10-8* 1.8720 1.24×10⁻⁸*** 2.9124
Loan-to-asset ratio -0.0111 -0.4351 0.0814*** 6.0263 Ownership structure -0.0820*** -3.2006 0.0100 0.1326 ROE 0.0002*** 2.4421 3.6×10⁻⁵ 1.0772 NPL -0.0006 -0.8321 3.2×10⁻⁵ 0.0798 R2 0.4203 0.5597 F-statistic 8.7028*** 13.9874***
*, **, *** indicate statistical significance at the 10, 5, or 1% significance level, respectively.
4. Concluding Comments
The objective of this study is to empirically examine how the bank capital structure policy is related to bank asset size. More specifically, by partitioning the full sample banks into two groups, i.e., the group of larger asset size banks vs the group of smaller asset size banks, we examine whether there is any difference in the determinants of capital structure decision between the two groups. Based on a panel regression analysis for Korean banks over the sample period 2000-2008, this study finds that the determinants for capital structure are substantially different between the two groups. Asset size and profitability affect the capital structure of the two groups in the same way. However, small banks’ capital structure decision shows that their capital ratio is positively related to both loan ratio and nonperforming loan ratio. This implies that small banks appear to put higher priority on investment policy for future growth than financial policy. The positive relation between nonperforming loan ratio and capital ratio for small banks implies that small banks have the tendency to decrease their debt ratio with financial risk-management purpose when their risk status measured by nonperforming loan ratio is high. However, both loan ratio and nonperforming loan ratio turned out not to affect the capital structure decision of the group of large banks. Instead the proportion of outside shareholdings which is used as the measure of the bank ownership structure turns out to negatively affect the bank capital ratio. Overall, these results imply that small banks tend to consider their investment opportunities and risk status as important explanatory variables for the capital structure decision. In contrast, large banks put a priority on the ownership structure in making capital structure decision. These results may suggest that to achieve a stable capital healthiness of the banks which is one essential requirement for the safety and soundness of the banking industry, bank regulator may have to implement a discriminatory regulatory policy between the group of large banks and small banks. Ignoring bank asset size and different characteristics, and imposing a one-way capital-structure regulatory policy would not be effective in making capital structure of the banks sound and healthy.
References
Bradley, M., Jarrell, G., & Kim, E. H. (1984). On the Existence of an Optimal Capital Structure: Theory and Evidence. The Journal of Finance, 857-878. http://dx.doi.org/10.1111/j.1540-6261.1984.tb03680.x
Friend, I., & Hasbrouck, J. (1989). Determinants of Capital Structure. In A. Chen (Ed.), Research in Finance (pp. 1-19). JAI Press Inc.
Friend, I., & Lang, L. (1988). An Empirical Test of the Impact of Managerial Self-Interest on Corporate Capital Structure. The Journal of Finance, 271-281. http://dx.doi.org/10.1111/j.1540-6261.1988.tb03938.x
Jensen, G. R., Solberg, D. P., & Zorn, T. S. (1992). Simultaneous Determination of Insider Ownership, Debt, and Dividend Policies. Journal of Financial and Quantitative Analysis, 247-263. http://dx.doi.org/10.2307/2331370
Kester, C. W. (1986). Capital and Ownership Structure: A comparison of United States and Japanese Manufacturing Corporation. Financial Management, 5-16. http://dx.doi.org/10.2307/3665273
Kim, W., & Sorensen, E. (1986). Evidence on the Impact of the Agency Costs of Debt on Corporate Debt Policy.
Martin J. D. et al. (1988). The Theory of Finance: Evidence and Application. Chicago: The Dryden Press.
Myers, S., & Majluf, N. S. (1984). Corporate Financing and Investment Decisions When Firms Have Information That Investors Do Not Have. Journal of Financial Economics, 187-221. http://dx.doi.org/10.1016/0304-405X(84)90023-0
Titman S., & Wessel, R. (1988). The Determinants of Capital Structure Choices. The Journal of Finance, 1-19. http://dx.doi.org/10.1111/j.1540-6261.1988.tb02585.x
Copyrights
Copyright for this article is retained by the author(s), with first publication rights granted to the journal.
This is an open-access article distributed under the terms and conditions of the Creative Commons Attribution license (http://creativecommons.org/licenses/by/3.0/).