R E S E A R C H
Open Access
Gender-specific cephalometric features
related to obesity in sleep apnea patients:
trilogy of soft palate-mandible-hyoid bone
Seok Hyun Cho
1, Jae-Yun Jeon
2, Kun-Soo Jang
2, Sang Yoon Kim
3,4, Kyung Rae Kim
1, Seungho Ryu
5and
Kyung-Gyun Hwang
2*Abstract
Background: The aim of this study is to investigate the relationship between gender-specific and obesity-related airway anatomy in patients with obstructive sleep apnea (OSA) by using cephalometric analyses.
Methods: We retrospectively evaluated 206 patients with suspected OSA undergoing polysomnography and anthropometric measurements such as body mass index, neck circumference, and waist-hip ratio. We checked lateral cephalometry to measure tissue landmarks including angle from A point to nasion to B point (ANB), soft palate length (SPL), soft palate thickness (SPT), retropalatal space (RPS), retrolingual space (RLS), and mandibular plane to hyoid (MPH).
Results: Male with OSA showed significantly increased SPL (P = .006) compared with controls. SPL and MPH had significant correlation with apnea-hypopnea index (AHI) and central obesity. Female with OSA showed significantly increased ANB (P = .013) and SPT (P = .004) compared with controls. The receiver operating characteristic curves revealed that SPT in male and ANB and SPT in female were significant in model 1 (AHI ≥ 5) and model 2 (AHI ≥ 15). MPH was also significant for male in model 2.
Conclusion: Male and female with OSA had distinct anatomic features of the upper airway and different interactions among soft palate, mandible, and hyoid bone.
Keywords: Central obesity, Cephalometry, Gender, Sleep disorders, Airway Background
Obstructive sleep apnea (OSA) refers to sleep-disordered breathing showing repetitive episodes of upper airway col-lapse during sleep [1]. The risk factors for OSA have been reported as old age, male, smoker, alcohol use, obesity, and craniofacial abnormality [2–6]. Therefore, the patho-genesis of OSA may be related to altered anatomy (small box) and physiology (increased collapsibility) of the upper airway. However, the exact mechanism of OSA has not been fully elucidated. Our previous study demonstrated that a predictor variable neck circumference (NC) is reli-able anthropometry for male with OSA [7]. However, it is
not clear how this localized obesity in the neck alters the anatomy of the upper airway.
Polysomnography (PSG) is the gold standard test to diagnose the presence of OSA and to estimate its sever-ity. And, apnea-hypopnea index (AHI) criteria with the mean and lowest SpO2are used for treatment planning.
However, they do not provide the anatomic locations of obstruction.
Most sleep surgeons perform upper airway imaging studies such as awake and sleep endoscopy, lateral cephal-ometry, fluoroscopy, computed tomography (CT), or mag-netic resonance imaging (MRI) in order to determine surgical versus medical (CPAP, weight control, and oral appliances) management for OSA. The lateral cephalom-etry is a traditional dental radiograph that shows two-dimensional structures of bony and soft tissues. Riley et al. [8] reported anatomical characteristics of OSA patients © The Author(s). 2019 Open Access This article is distributed under the terms of the Creative Commons Attribution 4.0
International License (http://creativecommons.org/licenses/by/4.0/), which permits unrestricted use, distribution, and reproduction in any medium, provided you give appropriate credit to the original author(s) and the source, provide a link to the Creative Commons license, and indicate if changes were made.
* Correspondence:[email protected]
2Department of Dentistry/Oral and Maxillofacial Surgery, School of Medicine,
Hanyang University, 222-1 Wangshimniro, Seongdong-gu, Seoul 133-792, Korea
with cephalometric analysis in 1983, and thereafter, a series of analyses on OSA patients have been performed to validate its sensitivity as a diagnostic tool for OSA [9– 12]. However, the diagnostic values of lateral cephalom-etry in previous studies remained uncertain. Our hypoth-esis was that compared with females, males with OSA may have different characteristics of the upper airway which can be influenced by genetics (sex) and environ-ments (central obesity).
This study measured the anthropometry (body mass index (BMI), neck circumference (NC), waist circumfer-ence (WC), and waist-hip ratio (WHR)) and obtained a full-night PSG and lateral cephalometry. The aim of this study was to evaluate the relationships between the upper airway anatomy (lateral cephalometry) and an-thropometry in patients with OSA. In addition, we in-vestigated the gender-specific and obesity-related anatomy of the upper airway in OSA patients to aid the treatment approach and management.
Methods
Patients
There were 288 patients with OSA symptoms (e.g., excessive daytime sleepiness, loud snoring, or observed apnea epi-sodes) who visited the sleep clinic at University Hospital. Ex-clusion criteria were as follows: (1) patient younger than 18 years (n = 5); (2) non-Asian patients (n = 10); (3) patients who refused to undergo PSG (n = 22); and lateral cephalom-etry (n = 45). A total of 206 patients were included in this study. The symptom questionnaire was used to assess day-time sleepiness (Epworth Sleepiness Scales (ESS)) and sleep quality (Pittsburgh Sleep Quality Index (PSQI)). Detailed medical history was obtained, and anthropometry (BMI, NC, WC, and WHR) was measured prior to PSG. All study protocol was approved by the local Institutional Review Board, and all subjects provided written informed consent (HY-2019-01-007-001).
Polysomnography
In-laboratory PSG was performed per standard clinical guideline s[13] and included full EEG, EOG, chin EMG, leg EMG, ECG, airflow recorded with nasal/oral thermistor and nasal/oral cannula, pulse oximetry, and body position. Ac-cording to the American Academy of Sleep Medicine (AASM) Sleep Apnea Definitions Task Force defined in 2012, apnea was scored when there is a drop in the peak sig-nal excursion by≥ 90% of pre-event baseline using an orona-sal thermal sensor lasting ≥ 10 s. Hypopneas were scored when (1) the peak signal excursions drop by≥ 30% of pre-event baseline using nasal pressure lasting ≥ 10 s and (2) there is≥ 3% oxygen desaturation from pre-event baseline or the event is associated with an arousal. The AHI was calcu-lated as the number of apnea plus hypopnea per hour of sleep [14]. The cutoff point for OSA was an AHI≥ 5.
Cephalometric measurements
Lateral cephalometry was taken after performing PSG and was taken using a standard protocol. All patients were positioned such that the FH plane was parallel to ground level with upper and lower lips, tongue relaxed, and teeth in centric occlusion while holding the breath at the end of the expiratory phase. The length and angu-lar parameters of bony and soft tissue landmarks were measured using the picture archiving and communica-tion system (PACS, Piview STAR, INFINITT, Korea) and analyzed the data using the V-ceph 5.0 software (Cybermed Inc., Seoul, Korea). Cephalometric analyses were corrected for cranio-cervical inclination in order to standardize the data and correction of head position [15]. SNA (angle from sella (S) to nasion (N) to A point), SNB (angle from S to N to B point), and ANB (angle from A point to N to B point) were measured to obtain protrusion angles of maxilla and mandible from the cra-nium. Posterior airway space (PAS) was measured at two locations: retropalatal space (RPS) and retrolingual space (RLS). Anatomy of the soft palate was measured with its length (SPL) and thickness (SPT). The linear distance along the perpendicular plane from the hyoid bone man-dibular plane (MPH) was measured (Table1and Fig.1).
Statistical analysis
All measured values were presented as mean (standard deviation) for continuous variables and as frequencies and percentages for categorical variables. Student’s t test was used to assess the differences among continuous variables, and the categorical variables between genders were analyzed by chi-square test. Pearson’s correlation coefficient was used to determine the correlations be-tween AHI and anthropometric and cephalometric data. Cutoff values and its sensitivity, specificity, and positive and negative predictive values were calculated for each gender. All cephalometric parameters were compared in terms of
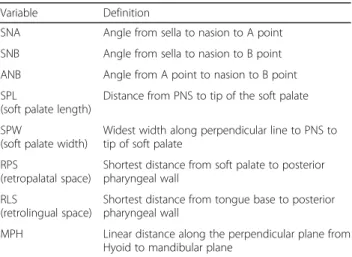
Table 1 Cephalometric measurements
Variable Definition
SNA Angle from sella to nasion to A point SNB Angle from sella to nasion to B point ANB Angle from A point to nasion to B point SPL
(soft palate length)
Distance from PNS to tip of the soft palate SPW
(soft palate width)
Widest width along perpendicular line to PNS to tip of soft palate
RPS
(retropalatal space)
Shortest distance from soft palate to posterior pharyngeal wall
RLS
(retrolingual space)
Shortest distance from tongue base to posterior pharyngeal wall
MPH Linear distance along the perpendicular plane from Hyoid to mandibular plane
their receiver operating characteristic (ROC) curves. This method compares the diagnostic properties of the test by ex-pressing sensitivity as a function of 1 – specificity. Results were considered significant at a value ofP < .05 and with a confidence interval (CI) of 95%. All analyses were performed with Statistical Package for the Social Sciences (SPSS) version 18.0 (SPSS Inc., Chicago, IL, USA).
Results
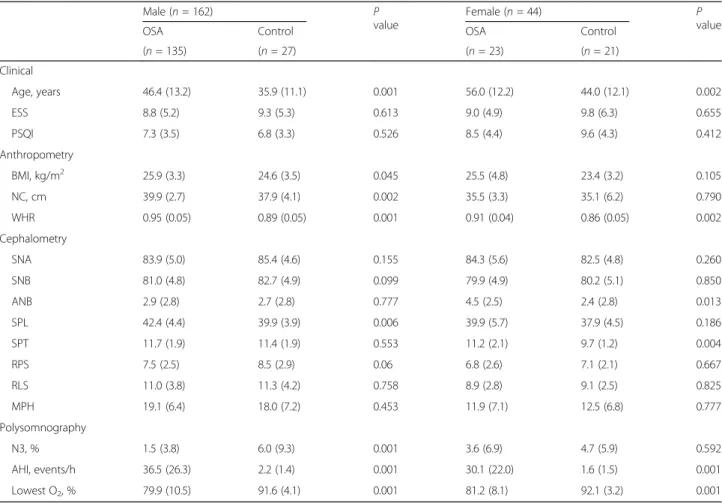
Two hundred six subjects were enrolled in the study and Table2shows their clinical characteristics with anthropom-etry, cephalomanthropom-etry, and polysomnography results. OSA groups were older than corresponding control groups with-out any differences in ESS and PSQI. In male with OSA, BMI, NC, and WHR were significantly elevated than controls and showed significant correlations with AHI (Table 3). However, WHR was the only parameter with higher values in female with OSA and also had a significant correlation
with AHI. All patients with OSA showed significantly worsen AHI and lowest nadir SpO2than controls.
Gender-specific characteristics of the upper airway anatomy in OSA
Male and female with OSA had different cephalometric pro-files (Table 2). In male, SPL (P = .006) was significantly
in-creased in the OSA group but there was no difference in other parameters. However, in female, ANB (P = .013) and SPT (P = .004) were significantly higher in the OSA group but there was no difference in other parameters.
Gender differences in associations between the upper airway anatomy and AHI
Male and female showed different associations between the upper airway anatomy (lateral cephalometry) and AHI (Table 3). In male, SPL (r = .267, P = .001) and
MPH (r = .292, P = .001) showed significant correlations Fig. 1 Linear and angular measurements for bony and soft tissue framework in lateral cephalometry. S (sella), midpoint of the fossa hypophysealis; N (nasion), anterior point at the frontonasal suture; A, the deepest anterior point in the concavity of the anterior maxilla; B, the deepest anterior point in the concavity of the anterior mandible; PNS (posterior nasal spine), the most posterior point on the nasal spine; Go (gonion), a mid-point at the gonial angle located by bisecting the posterior and inferior borders of the mandible; Gn (gnathion), the most anteroinferior point on the chin bone; Me (menton), the most inferior point on the chin bone; P, the inferior tip of the soft palate; H, the most anterosuperior point on the hyoid bone; MP (mandibular plane), a tangent line from Me to the inferior mandibular border
with AHI. However, in female, SPT (r = .386, P = .01) showed a significant correlation with AHI.
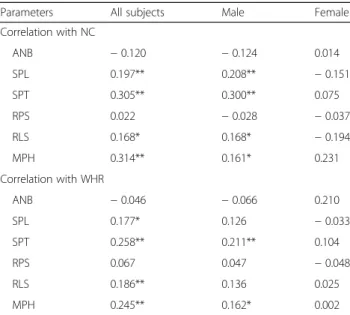
Gender-specific effects of central obesity on the upper airway anatomy
Central obesity had different impacts on the upper airway anatomy measured with lateral cephalometry (Table 4). In male, NC showed significant correlations with SPL (r = .208, P = .008), SPT (r = .3, P = .001), RLS (r = .168, P = .033), and MPH (r = .161, P = .042). And WHR showed significant cor-relation with SPT (r = .211, P = .007) and MPH (r = .162, P = .04). However, in female, none of the cephalometric in-dexes had any correlations with NC or WHR.
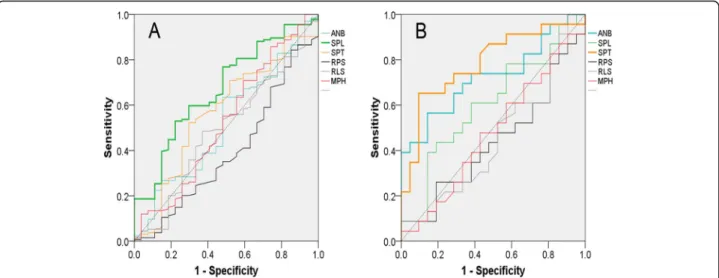
Cutoff values and areas under the ROC curve of lateral cephalometry in male and female with OSA
In male and female, ROC curves were constructed for each cephalometric factor to evaluate their diagnostic power to OSA and calculated cutoff values (Fig. 2). Table 5 gives the areas under the ROC curve for ceph-alometric variables and their significance in predicting OSA. In model 1 (AHI ≥ 5), the areas under the ROC
Table 2 Gender effects on cephalometric differences between OSA and control patients
Male (n = 162) P
value
Female (n = 44) P
value
OSA Control OSA Control
(n = 135) (n = 27) (n = 23) (n = 21) Clinical Age, years 46.4 (13.2) 35.9 (11.1) 0.001 56.0 (12.2) 44.0 (12.1) 0.002 ESS 8.8 (5.2) 9.3 (5.3) 0.613 9.0 (4.9) 9.8 (6.3) 0.655 PSQI 7.3 (3.5) 6.8 (3.3) 0.526 8.5 (4.4) 9.6 (4.3) 0.412 Anthropometry BMI, kg/m2 25.9 (3.3) 24.6 (3.5) 0.045 25.5 (4.8) 23.4 (3.2) 0.105 NC, cm 39.9 (2.7) 37.9 (4.1) 0.002 35.5 (3.3) 35.1 (6.2) 0.790 WHR 0.95 (0.05) 0.89 (0.05) 0.001 0.91 (0.04) 0.86 (0.05) 0.002 Cephalometry SNA 83.9 (5.0) 85.4 (4.6) 0.155 84.3 (5.6) 82.5 (4.8) 0.260 SNB 81.0 (4.8) 82.7 (4.9) 0.099 79.9 (4.9) 80.2 (5.1) 0.850 ANB 2.9 (2.8) 2.7 (2.8) 0.777 4.5 (2.5) 2.4 (2.8) 0.013 SPL 42.4 (4.4) 39.9 (3.9) 0.006 39.9 (5.7) 37.9 (4.5) 0.186 SPT 11.7 (1.9) 11.4 (1.9) 0.553 11.2 (2.1) 9.7 (1.2) 0.004 RPS 7.5 (2.5) 8.5 (2.9) 0.06 6.8 (2.6) 7.1 (2.1) 0.667 RLS 11.0 (3.8) 11.3 (4.2) 0.758 8.9 (2.8) 9.1 (2.5) 0.825 MPH 19.1 (6.4) 18.0 (7.2) 0.453 11.9 (7.1) 12.5 (6.8) 0.777 Polysomnography N3, % 1.5 (3.8) 6.0 (9.3) 0.001 3.6 (6.9) 4.7 (5.9) 0.592 AHI, events/h 36.5 (26.3) 2.2 (1.4) 0.001 30.1 (22.0) 1.6 (1.5) 0.001 Lowest O2, % 79.9 (10.5) 91.6 (4.1) 0.001 81.2 (8.1) 92.1 (3.2) 0.001 All values are reported as mean (SD). OSA, obstructive sleep apnea; ESS Epworth Sleepiness Scale, PSQI Pittsburgh Sleep Quality Index, NC neck circumference, WHR waist-hip ratio, SE sleep efficiency, N3 deep sleep, AHI apnea-hypopnea index
Table 3 Correlation of anthropometric and cephalometric parameters with AHI
Parameters All subjects Male Female Anthropometry BMI 0.356** 0.368** 0.240 NC 0.361** 0.387** 0.103 WHR 0.428** 0.384** 0.397** Cephalometry ANB 0.079 0.042 0.384* SPL 0.284** 0.267** 0.141 SPT 0.234** 0.150 0.386** RPS − 0.048 − 0.053 − 0.208 RLS 0.137* 0.108 − 0.024 MPH 0.339** 0.292** 0.253
*P < 0.05; **P < 0.01. Numbers are Pearson’s correlation coefficient (r values). AHI apnea-hypopnea index, BMI body mass index, NC neck circumference, WHR waist-hip ratio, ANB angle from A point to nasion to B point, SPL soft palate length, SPT soft palate thickness, RPS retropalatal space, RLS retrolingual space, MPH mandibular plane to hyoid
curve for male with OSA were significant for SPL (P = .005). In female, the areas under the ROC curve for OSA were significant for SPT (P = .001). In model 2 (AHI ≥ 15), both SPL (P = .004) and MPH (P = .001) were sig-nificant for male with OSA. However, in female, SPT (P = .003) remained significant for OSA.
Discussion
This study investigated the anatomic variants of the upper airway (lateral cephalometry) related to sex and central obesity in Asian patients with OSA. The different phenotypes of OSA determined by sex and central obes-ity may permit us to make appropriate therapeutic plans for OSA patients. The key findings of this study were as follows: (1) Soft palate was found to be the main target of OSA and its anatomic changes show significant corre-lations with AHI. (2) Phenotypes of soft palate were dif-ferent between sexes: increased length for male and increased thickness for female. (3) Only male OSA pa-tients showed clear associations between central obesity and the upper airway anatomy. (4) MPH was a male-specific parameter especially for moderate and severe OSA and showed a significant correlation with both AHI and central obesity.
Male with OSA showed typical characteristics of cen-tral obesity with increased NC and WHR. There have been many studies demonstrating the altered neck anat-omy in male with OSA including increased neck circum-ference (anthropometry) and parapharyngeal fat deposition (CT or MRI) [16–18]. Therefore, it is
reasonable to state that central obesity (thick neck) in male with OSA may cause the altered anatomy of the upper airway. To illustrate OSA-related upper airway anatomy, a total of eight well-known parameters on lat-eral cephalometry were used for craniofacial anatomy (SNA, SNB, and ANB), upper airway (SPL, SPT, and RPS), and lower airway (RLS and MPH). Lateral cephal-ometry does not show that the volume of airway and cephalometric analysis was affected by the head position. Nevertheless, it has been used in maxillofacial deformity analysis and orthodontic diagnosis. The lateral cephal-ometry has been used for its simplicity and economical method for measuring anatomical structure related to the airway. In this study, we standardized the data by correcting the cranio-cervical inclination in order to ob-tain accurate measurements of parameters of the airway. This study clearly demonstrated that the upper airway anatomy measured with lateral cephalometry had differ-ent characteristics and associations with AHI and cdiffer-entral obesity, depending on sex.
SNA, SNB, and ANB were used to evaluate the anterior-posterior position of maxilla and mandible to cranial base on lateral cephalometry. Retrognathia is well-known anatomic phenotype affecting the pathogen-esis of OSA [19–22]. Lowe et al. [21] showed that pa-tients with OSA had the smaller and posteriorly positioned mandible which decreased the overall airway space on lateral cephalometry. In contrast, others re-ported that there was no difference in upper airway vol-ume based on the intermaxillary relationship using cone beam computed tomography (CBCT) [23]. However, our study demonstrated that mandible was positioned pos-teriorly in female with OSA (increased ANB) which was independent with obesity and had significant correla-tions with AHI. Thus, retrognathia is an important ana-tomic phenotype affecting the presence and severity of OSA in female.
There are many reports using lateral cephalometry to investigate the influence of soft tissues on OSA. Previous studies reported that increased soft palate length and thickness are associated with OSA on lateral cephalom-etry [21, 24–27]. In the study targeting 62 males, Yu et al. [28] also reported that longer SPL was associated with higher prevalence of OSA. In contrast, Cillo et al. [29] reported that there were no significant changes in SPL in OSA. However, in this study, we found that male with OSA had a different phenotype of the soft palate compared with female with OSA. Male with OSA had significantly increased SPL which showed significant as-sociation with AHI and NC. Alternatively, female with OSA had significantly increased SPT which showed sig-nificant association with AHI but not with central obes-ity (NC and WHR). Therefore, the soft palate may become elongated in conjunction with the weight gain
Table 4 Effect of central obesity (anthropometry) on the upper airway anatomy (cephalometry)
Parameters All subjects Male Female Correlation with NC ANB − 0.120 − 0.124 0.014 SPL 0.197** 0.208** − 0.151 SPT 0.305** 0.300** 0.075 RPS 0.022 − 0.028 − 0.037 RLS 0.168* 0.168* − 0.194 MPH 0.314** 0.161* 0.231 Correlation with WHR ANB − 0.046 − 0.066 0.210 SPL 0.177* 0.126 − 0.033 SPT 0.258** 0.211** 0.104 RPS 0.067 0.047 − 0.048 RLS 0.186** 0.136 0.025 MPH 0.245** 0.162* 0.002
*P < 0.05; **P < 0.01. Numbers are Pearson’s correlation coefficient (r values). NC neck circumference, WHR waist-hip ratio, ANB angle from A point to nasion to B point, SPL soft palate length, SPT soft palate thickness, RPS retropalatal space, RLS retrolingual space, MPH mandibular plane to hyoid
which can aggravate the upper airway narrowing in male. However, female may have an intrinsic variance of SPT which is independent with central obesity. Female with thick palate may have increased risk for the devel-opment of OSA (Fig.3).
Retro-palatal and retro-lingual spaces are the most common sites of upper airway narrowing in OSA [30,
31]. Dynamic studies such as drug-induced sleep endos-copy (DISE) also reported that there are isolated or mul-tiple sites of upper airway collapse in OSA [32]. However, in our cephalometric study, there was no difference in RPS and RLS between OSA and controls regardless of the sex. Moreover, they did not show any correlation with AHI and central obesity. Thus, we con-cluded that 2-dimensional analysis of the upper airway space may have limitations to represent OSA. To investi-gate the space anatomy, upper airway endoscopy may be advantageous to show 3-dimensional views and dynam-ics in OSA.
The position of the hyoid bone is related to the retro-lingual space, and lower hyoid indicates the nar-rowing of RLS and also is associated with weak ton-icity of the genioglossus muscle. De berry et al. [33] reported that the hyoid bone in the lower position could displace the base of the tongue further down-ward leading to the airway obstruction of hypophar-ynx more easily. However, in our study, there was no difference in MPH between OSA and controls regard-less of sex. By subgroup analysis, MPH in male showed significant associations with AHI and central obesity (NC and WHR). Moreover, ROC curves showed that MPH is an anatomic factor representing the moderate-to-severe OSA in male. Whittle et al. [16] reported that male had larger soft tissue volume around the airway compared with female which is consistent with our study. Thus, both intrinsic soft tissue volumes of the upper airway and obesity-related central fat deposition (NC) may affect the MPH in male. By comparison, MPH in female did not show any relationship with AHI and obesity, and Fig. 2 Receiver operating characteristic curves in male (a) and female (b) for angle from sella to nasion to A point (ANB), soft palate length (SPL), soft palate thickness (SPT), retropalatal space (RPS), retrolingual space (RLS), linear distance along the perpendicular plane from hyoid to mandibular plane (MPH)
Table 5 Comparison of areas under the receiver operating characteristic curves in male and female
Male Female
AUC P value AUC P value
Model 1 (AHI≥ 5) ANB 0.519 0.751 0.725 0.011* SPL 0.670 0.005** 0.605 0.235 SPT 0.568 0.265 0.784 0.001** RPS 0.396 0.087 0.437 0.474 RLS 0.493 0.912 0.452 0.589 MPH 0.527 0.656 0.477 0.796 Model 2 (AHI≥ 15) ANB 0.547 0.310 0.736 0.009** SPL 0.635 0.004** 0.498 0.981 SPT 0.568 0.144 0.772 0.003** RPS 0.481 0.675 0.461 0.090 RLS 0.549 0.294 0.511 0.089 MPH 0.648 0.001** 0.523 0.094
*P < 0.05; **P < 0.01. AUC area under the ROC curve, AHI apnea-hypopnea index, ANB angle from A point to nasion to B point, SPL soft palate length, SPT soft palate thickness, RPS retropalatal space, RLS retrolingual space, MPH mandibular plane to hyoid
therefore, the narrowing of RLS may be not involved in the pathogenesis of female OSA.
The authors acknowledge the weaknesses and limita-tions of our study. The lateral cephalometry was taken in a standing position and awake state which does not represent accurate measurements of the upper airway in the sleeping state. Also, the number of female was rela-tively fewer than male. Despite the above-mentioned limitations, our study clearly demonstrated the role of gender on the upper airway anatomic variation and its association with central obesity.
Conclusion
Phenotypes of the upper airway in OSA differ with the sex. Increased SPL and MPH contributed to OSA in male. However, retrognathia and increased SPT are in-volved in the pathogenesis of OSA in female. Altered upper airway anatomy is significantly associated with central obesity in male, but these interactions were not found in female.
Male and female may have distinct upper airway anat-omy, and different risk factors are involved in the patho-genesis of OSA. Central obesity may increase SPL and MPH and, therefore, aggravate the upper and lower air-way collapse in OSA. By comparison, developmental ret-rognathia and thick soft palate independent with obesity may affect OSA in female.
Our study demonstrated the hidden and useful fea-tures of lateral cephalometry for the evaluation of the upper airway in OSA. When considering sex-specific therapeutic plan for OSA, obesity-susceptible upper air-way narrowing may indicate the effectiveness of weight control for male with OSA. And retrognathia and thick palate in female may predict the lack of success rate of the palate surgery without tonsillar hypertrophy. Further
study will be necessary to demonstrate the values of these anatomy-based treatment plans for OSA.
Abbreviations
ANB:A point to nasion to B point; BMI: Body mass index; CPAP: Continuous positive airway pressure; MPH: Mandibular plane to hyoid; OSA: Obstructive sleep apnea; PSG: Polysomnography; RLS: Retrolingual space;
RPS: Retropalatal space; SPL: Soft palate length; SPT: Soft palate thickness Acknowledgements
This work was supported by the National Research Foundation of Korea Grant funded by the Korean Government (NRF-2017 M3A9F 1027928). Authors' contributions
SH, JY, KS, and SY carried out the experiments and wrote the manuscript. KG and KR conceived this experiment and reviewed this manuscript. SR analyzed the data. All authors were involved in writing the paper. All authors read and approved the final manuscript.
Funding
This study received no specific grant from any funding agency in the public, commercial, or not-for-profit sectors.
Availability of data and materials
Data sharing is not applicable to this article as no data sets were generated or analyzed during the current study.
Ethics approval and consent to participate
This case report was reviewed by the Institutional Review Board (IRB) of Hanyang University Hospital and was approved from deliberation (HY-2019-01-007-001).
Consent for publication
This manuscript does not contain any individual person’s identifier Competing interests
The authors declare that they have no competing interests. Author details
1
Department of Otorhinolaryngology-Head and Neck Surgery, School of Medicine, Hanyang University, Seoul, Korea.2Department of Dentistry/Oral
and Maxillofacial Surgery, School of Medicine, Hanyang University, 222-1 Wangshimniro, Seongdong-gu, Seoul 133-792, Korea.3Department of Oral
and Maxillofacial Surgery, Massachusetts General Hospital, Harvard Medical School, Boston, USA.4Vienna, USA.5Department of Occupational Medicine,
Kangbuk Samsung Hospital, School of Medicine, Sungkyunkwan University, Seoul, Korea.
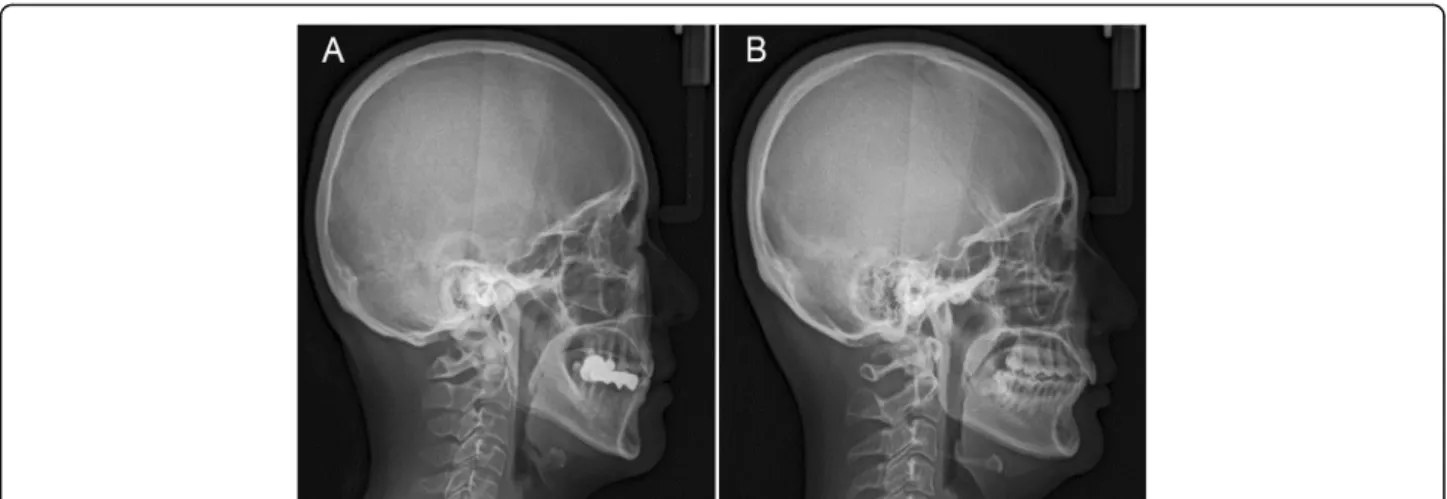
Fig. 3 Representative views of lateral cephalometry show the different morphology of the soft palate, mandible, and hyoid bone between male (a) and female (b) with obstructive sleep apnea
Received: 17 July 2019 Accepted: 27 November 2019
References
1. Sleep-related breathing disorders in adults: recommendations for syndrome definition and measurement techniques in clinical research (1999) The report of an American Academy of Sleep Medicine Task Force. Sleep. 22: 667–689
2. Bixler EO, Vgontzas AN, Ten Have T, Tyson K, Kales A (1998) Effects of age on sleep apnea in men: I. Prevalence and severity. Am J Respir Crit Care Med 157:144–148
3. Dancey DR, Hanly PJ, Soong C, Lee B, Shepard J Jr, Hoffstein V (2003) Gender differences in sleep apnea: the role of neck circumference. Chest 123:1544–1550
4. Romero-Corral A, Caples SM, Lopez-Jimenez F, Somers VK (2010) Interactions between obesity and obstructive sleep apnea: implications for treatment. Chest 137:711–719
5. Jamieson A, Guilleminault C, Partinen M, Quera-Salva MA (1986) Obstructive sleep apneic patients have craniomandibular abnormalities. Sleep. 9:469–477 6. Jang SI, Ahn J, Paeng JY, Hong J (2018) Three-dimensional analysis of
changes in airway space after bimaxillary orthognathic surgery with maxillomandibular setback and their association with obstructive sleep apnea. Maxillofac Plastic Reconstruc Surg 40:33–44
7. Lim YH, Choi J, Kim KR, Shin J, Hwang KG, Ryu S, Cho SH (2014) Sex-specific characteristics of anthropometry in patients with obstructive sleep apnea: neck circumference and waist-hip ratio. Ann Otol Rhinol Laryngol 123:517–523 8. Riley R, Guilleminault C, Herran J, Powell N (1983) Cephalometric analyses and
flow-volume loops in obstructive sleep apnea patients. Sleep. 6:303–311 9. Guilleminault C, Riley R, Powell N (1984) Obstructive sleep apnea and
abnormal cephalometric measurements. Implications for treatment. Chest. 86:793–794
10. Riley R, Guilleminault C, Powell N, Simmons FB (1985) Palatopharyngoplasty failure, cephalometric roentgenograms, and obstructive sleep apnea. Otolaryngol Head Neck Surg. 93:240–244
11. Cho HW, Kim IK, Cho HY, Seo JH, Lee DH, Park SH (2015) Retrospective study of changes in pharyngeal airway space and position of hyoid bone after mandibular setback surgery by cephalometric analysis. Maxillofac Plast Reconstruc Surg 37:38–44
12. Riley R, Powell N,(1986) Guilleminault C. Cephalometric roentgenograms and computerized tomographic scans in obstructive sleep apnea. Sleep. 9: 514-515
13. Annals of Otology RaL.(1999) Sleep-related breathing disorders in adults: recommendations for syndrome definition and measurement techniques in clinical research. The Report of an American Academy of Sleep Medicine Task Force. Sleep. 22:667-689
14. Berry RB, Budhiraja R, Gottlieb DJ, Gozal D, Iber C, Kapur VK, Marcus CL, Mehra R, Parthasarathy S, Quan SF, Redline S, Strohl KP, Davidson Ward SL, Tangredi MM (2012) Rules for scoring respiratory events in sleep: update of the 2007 AASM Manual for the Scoring of Sleep and Associated Events. Deliberations of the Sleep Apnea Definitions Task Force of the American Academy of Sleep Medicine. J Clin Sleep Med 8:597–619
15. Anegawa E, Tsuyama H, Kusukawa J (2008) Lateral cephalometric analysis of the pharyngeal airway space affected by head posture. Int J Oral Maxillofac Surg 37:805–809
16. Whittle AT, Marshall I, Mortimore IL, Wraith PK, Sellar RJ, Douglas NJ (1999) Neck soft tissue and fat distribution: comparison between normal men and women by magnetic resonance imaging. Thorax 54:323–328
17. Isono S (2012) Obesity and obstructive sleep apnoea: mechanisms for increased collapsibility of the passive pharyngeal airway. Respirology. 17:32–42 18. Suto Y, Matsuo T, Kato T, Hori I, Inoue Y, Ogawa S, Suzuki T, Yamada M,
Ohta Y (1993) Evaluation of the pharyngeal airway in patients with sleep apnea: value of ultrafast MR imaging. AJR Am J Roentgenol 160:311–314 19. Imes NK, Orr WC, Smith RO, Rogers RM.(1977) Retrognathia and sleep
apnea. A life-threatening condition masquerading as narcolepsy. JAMA.237: 1596-1597
20. Tangugsorn V, Skatvedt O, Krogstad O, Lyberg T (1995) Obstructive sleep apnoea: a cephalometric study. Part I. Cervico-craniofacial skeletal morphology. Eur J Orthod 17(1):45–56
21. Lowe AA, Ozbek MM, Miyamoto K, Pae EK, Fleetham JA (1997)
Cephalometric and demographic characteristics of obstructive sleep apnea: an evaluation with partial least squares analysis. Angle Orthod 67:143–153
22. Schellenberg JB, Maislin G, Schwab RJ (2000) Physical findings and the risk for obstructive sleep apnea. The importance of oropharyngeal structures. Am J Respir Crit Care Med 162:740–748
23. Di Carlo G, Polimeni A, Melsen B, Cattaneo PM (2015) The relationship between upper airways and craniofacial morphology studied in 3D. A CBCT study. Orthod Craniofac Res 18:1–11
24. Haponik EF, Smith PL, Bohlman ME, Allen RP, Goldman SM, Bleecker ER (1983) Computerized tomography in obstructive sleep apnea. Correlation of airway size with physiology during sleep and wakefulness. Am Rev Respir Dis 127:221–226
25. Tangugsorn V, Skatvedt O, Krogstad O, Lyberg T (1995) Obstructive sleep apnoea: a cephalometric study. Part II. Uvulo-glossopharyngeal morphology. Eur J Orthod 17(1):57–67
26. Lyberg T, Krogstad O, Djupesland G (1989) Cephalometric analysis in patients with obstructive sleep apnoea syndrome: II. Soft tissue morphology. J Laryngol Otol 103:293–297
27. Bacon WH, Turlot JC, Krieger J, Stierle JL (1990) Cephalometric evaluation of pharyngeal obstructive factors in patients with sleep apneas syndrome. Angle Orthod. 60:115–122
28. Yu X, Fujimoto K, Urushibata K, Matsuzawa Y, Kubo K (2003) Cephalometric analysis in obese and nonobese patients with obstructive sleep apnea syndrome. Chest 124:212–218
29. Cillo JE Jr, Thayer S, Dasheiff RM, Finn R (2012) Relations between obstructive sleep apnea syndrome and specific cephalometric measurements, body mass index, and apnea-hypopnea index. J Oral Maxillofac Surg 70:e278–e283
30. Abramson Z, Susarla S, August M, Troulis M, Kaban L (2010) Three-dimensional computed tomographic analysis of airway anatomy in patients with obstructive sleep apnea. J Oral Maxillofac Surg 68:354–362
31. Yucel A, Unlu M, Haktanir A, Acar M, Fidan F (2005) Evaluation of the upper airway cross-sectional area changes in different degrees of severity of obstructive sleep apnea syndrome: cephalometric and dynamic CT study. AJNR Am J Neuroradiol. 26:2624–2629
32. Schoenberg SO, Floemer F, Kroeger H, Hoffmann A, Bock M, Knopp MV (2000) Combined assessment of obstructive sleep apnea syndrome with dynamic MRI and parallel EEG registration: initial results. Invest Radiol 35: 267–276
33. deBerry-Borowiecki B, Kukwa A, Blanks RH (1988) Cephalometric analysis for diagnosis and treatment of obstructive sleep apnea. Laryngoscope. 98:226–234
Publisher’s Note
Springer Nature remains neutral with regard to jurisdictional claims in published maps and institutional affiliations.