저작자표시-비영리-변경금지 2.0 대한민국 이용자는 아래의 조건을 따르는 경우에 한하여 자유롭게 l 이 저작물을 복제, 배포, 전송, 전시, 공연 및 방송할 수 있습니다. 다음과 같은 조건을 따라야 합니다: l 귀하는, 이 저작물의 재이용이나 배포의 경우, 이 저작물에 적용된 이용허락조건 을 명확하게 나타내어야 합니다. l 저작권자로부터 별도의 허가를 받으면 이러한 조건들은 적용되지 않습니다. 저작권법에 따른 이용자의 권리는 위의 내용에 의하여 영향을 받지 않습니다. 이것은 이용허락규약(Legal Code)을 이해하기 쉽게 요약한 것입니다. Disclaimer 저작자표시. 귀하는 원저작자를 표시하여야 합니다. 비영리. 귀하는 이 저작물을 영리 목적으로 이용할 수 없습니다. 변경금지. 귀하는 이 저작물을 개작, 변형 또는 가공할 수 없습니다.
1
Impact of Dialysis Modality on Left
Ventricular Geometry in End Stage Renal
Disease Patients
by
Jeoung-sook Shin
Major in Medicine
Department of Medical Science
The Graduate School, Ajou University
2
Impact of Dialysis Modality on Left Ventricular Geometry
in End Stage Renal Disease Patients
by
Jeoung-sook Shin
A Dissertation Submitted to The Graduate School of
Ajou University in Partial fulfillment of The Requirements for
The Degree of Master of Medicine
Supervised by
Gyu-Tae Shin, M.D., Ph.D.
Major in Medicine
Department of Medical Science
The Graduate School, Ajou University
3
This certifies that the dissertation
of Jeoung-sook Shin is approved
.
SUPERVISORY COMMITTEE
Gyu-Tae Shin
Gyu-Tae Shin
Heung-Soo Kim
Heung-Soo Kim
Ki-Soo Pai
Ki-Soo Pai
The Graduate School, Ajou University
i
-ABSTRACT-
Impact of Dialysis Modality on Left Ventricular Geometry in
End Stage Renal Disease Patients
Background: Left ventricular hypertrophy (LVH) is an independent risk factor for
morbidity and mortality in patients with end stage renal disease (ESRD). This study aimed to evaluate impact of dialysis modality on LV geometry by using
echocardiography.
Methods: We retrospectively evaluated change in LV mass index (LVMI), relative wall
thickness (RWT) and LV geometry, assessed by 2D transthoracic echocardiography, in patients starting dialysis while hospitalized from 2002 to 2012. Patients were classified into hemodialysis (HD) group and peritoneal dialysis (PD) group. Follow-up duration performing echocardiogram was 15±7months in HD group and 17±8 months in PD group. LV geometry was divided into 4 groups as normal LV geometry, concentric remodeling, concentric LVH and eccentric LVH according to LVMI and RWT using cutoff values of 115 (men) or 95 (women) g/m² for LVMI and 0.42 for RWT, both men and women. Severity of LVH was followed ASE recommendation (for men; mild: 116-131g/m2, moderate: 132-148 g/m², severe: ≥149 g/m², for women; mild: 96-108 g/m², moderate:109-121 g/m², severe: ≥122 g/m²) of LVMI. The multivariate analysis was performed to evaluate the independent predictors 10% reduction of LVMI
Results: 84 patients with HD (age 55±13years, 51% male) and 36 patients with PD (age
50±14years, 61% male) were enrolled. Before initiation of dialysis, there were no significant difference of ejection fraction, LVMI, RWT (56±14% vs. 56±14%, p=0.810; 166.7±46.0g/m² vs. 167.8±54.6g/m², p=0.910; 0.46±0.10 vs. 0.46±0.08, p=0.960, respectively). Concentric LVH was most common in both groups before initiating
ii
dialysis (58% vs. 64%). In HD group, there was no difference in LVMI
(166.7±46.0g/m2 vs. 165.5±47.2g/m2, p=0.799) at follow-up, PD group had significant reduction of LVMI (164.8±54.6g/m2 vs. 145.1±43.1g/m2, p=0.021). Incidence of 10% reduction of LVMI was higher in PD group (33% vs. 56%, p=0.026). Predominance of concentric LVH did not changed in both groups at follow-up (61% vs. 61%). Patients with PD had decrease of severe LVH 67% to 50% and increase of normal LV 6% to 22% but it was no significant difference (p=0.090). By multivariable linear regression for predicting 10% LVMI regression, Independent predictors were presence of PD (odds ratio[OR]:2.119, 95% confidence interval [CI]:1.041-4.736, p=0.048), Diabetes
mellitus (OR:0.464, 95%CI: 0.203-8.213, p=0.033), coronary artery disease (OR:0.339, 95%CI: 0.339-8.213, p=0.037 ), serum calcium (OR:0.579, 95%CI:0.293-1.134,
p=0.011).
Conclusion: Otherwise there was no difference in prevalence of LV geometry pattern
on baseline and follow up echocardiography, PD patients had reduction of LVMI and PD was an independent predictor for LVMI reduction
iii
TABLE OF CONTENTS
ABSTRACT ··· i
TABLE OF CONTENTS ··· iii
LIST OF FIGURES ··· iv
LIST OF TABLES ··· v
I. INTRODUCTION ···1
II. MATERIAL AND METHODS ···2
A. PATIENTS ···2
B. DIALYSY ···2
C. PHYSICAL PARAMETERS & LABARATORY PARAMETERS···2
D. ECHOCARDOGRAPHIC PARAMATERTS···3
E. STATISTICS···4
III. RESULTS ···5
A. BASELINE CHARACTERISTICS ···5
B. COMPARISON IN CHANGE OF LABORATORY AND ECHOCARDIOGRAPHIC PARAMETERS AFTER DIAYSIS ···9
IV. DISCUSSION ···17
V. CONCLUSION ···20
REFERENCES ···21
iv
LIST OF FIGURE
Fig 1. Individual ΔRWT and ΔLVMI over time···11
Fig 2. Distributions of LV geometry of baseline and follow-up echocardiography ···12
Fig 3. Comparison of severity of LVH at baseline and follow-up echocardiography ···14
v
LIST OF TABLES
Table 1. Baseline characteristics···6
Table 2. Baseline echocardiographic parameters···8
Table 3. Comparison of changes in clinical indexes and echocardiographic parameters ···10
Table 4. Comparison of LV geometry···13
Table 5. The output from a multivariable linear regression to predict >10% of LVMI ···16
1
I.
INTRODUCTION
Cardiovascular complications are major cause of morbidity and mortality in patients with end stage renal disease (ESRD)(Morton, 1998). Progression of left ventricular hypertrophy (LVH) was associated with 62% 3-year cardiovascular events risk in hemodialysis patients (Zoccali et al., 2004). In 1992, Ganau et al.(Ganau et al., 1992) was classified LV geometry with normal, concentric remodeling, concentric hypertrophy, eccentric hypertrophy. There are some reports describing predominance of concentric LVH (40-63%) in ESRD patients (Levin et al., 1996; London and Parfrey, 1997; Ha et al., 1998; Li et al., 2009) and patients with ESRD had known to progress of LVH after starting dialysis, There was no data comparing longitudinal change of LV geometry after start of dialysis in hemodialysis (HD) and peritoneal dialysis (PD). This study aimed to investigate impact of dialysis modality on LV geometry by using echocardiography.
2
II. Material and Method
A. Patents
Study population consisted of impending end stage renal disease patients referred to our hospital for starting dialysis form 2002 and 2012, we enrolled all patients who started dialysis and maintained one modality. We included patients who performed echocardiography at least one month prior to start dialysis and performed follow-up echocardiography within 6-36months. We excluded patients who had the following exclusion criteria: age less than 18 years, overt cardiac comorbidities (dilated cardiomyopathy, hypertrophic cardiomyopathy, restrictive cardiomyopathy, severe arrhythmia, symptomatic aortic stenosis or more than moderate aortic and mitral regurgitation). Finally 120 patents were recruited into present study, comprising 84 HD patients and 36 PD patients.
B. Dialysis
The dialysis modality was determined by clinical decision of nephrologist and patients. All HD patients received a conventional twice or thrice-weekly HD and all PD patients received continuous ambulatory peritoneal dialysis.
C. Physical parameters & Laboratory parameters
Baseline physical parameters (blood pressure, heart rate, height and weight) were calculated as average value of all recording taken during the month before initiating the dialysis. For the follow-up physical parameters, in hemodialysis patients physical parameters were obtained by measured value at pre-dialysis period preceding the follow-up echocardiography. In PD patients the blood pressure, heart rate and weight were obtained by averaging measured value during the month preceding follow-up
3
echocardiography. /Blood sampling for the biochemical measurements were performed before echocardiography. Laboratory parameters were used data done before following dialysis in HD patients. In PD patients, we used parameters performed at a routine follow-up visit day. Biochemical parameters such as hemoglobin, serum creatinine, serum uric acid, serum albumin, serum calcium, serum phosphate and intact parathyroid hormone were measured. Corrected calcium was calculated as follows:
Corrected calcium (mg/dL) = total calcium+ (0.8 x (4.0-albumin[in g/dL])
D. Echocardiographic parameters
Echocardiographic measurements were performed based on the recommendations of American Society of Echocardiography (ASE) (Lang et al., 2005). Follow-up
echocardiography was performed during the dialysis interval in HD patients and with an empty abdomen in PD patients. Ventricular dimensions were assessed through 2-D guided M-mode tracing. Echocardiographic parameters including left ventricular end diastolic diameter (LVEDD), inter ventricular septum diastolic thickness (IVSDT) and left ventricular posterior wall thickness (PWT) were measured at end-diastole. LV mass(LVM) was calculated according to Devereux formula (Devereux et al., 1994):
LVM (g) =0.8 x (1.04 x [(LVEDD + IVSDT + PWT)3-(LVEDD)3] + 0.6 LVM index (LVMI) was obtained by dividing LVM by BSA.
Relative wall thickness (RWT) was calculated by following formula: RWT=2 x PWT/LVEDD
LVH was defined according to ASE recommendation (male, LVMI>115g/m2; female, LVMI>95g/m2) and classified as concentric LVH when RWT is>0.42, eccentric LVH
4
when RWT ≤0.42. Concentric remodeling was considered when RWT >0.42 with normal LVMI. Severity of LVH was followed ASE recommendation(for men; mild: 116-131g/m2, moderate: 132-148 g/m², severe: ≥149 g/m², for women; mild:96-108 g/m², moderate:109-121 g/m², severe: ≥122 g/m². Regression of LVH defined as 10% reduction of LVMI on follow-up echocardiography compared to the baseline value.
E. Statistics
Continuous variables were expressed as mean± standard deviation (SD), catergrized variables were expressed as number and percentage. Inter-group, intra-group statistical comparisons used the paired and unpaired t-tests and chi square test. Multivariable linear regression was performed to identify independent predictors of regression of LVH. A series of variables were selected as independent variables in this model, such as age, sex, modality of dialysis, presence of diabetes mellitus (DM), coronary artery disease, previous myocardial infarction (MI), LV dysfunction (ejection fraction<45%) , SBP, HR, serum hemoglobin, calcium-phosphate product. For dialysis modality HD was defined as 1 (used as reference) and PD as 2. A two-tailed p value less than .05 considered significant. All analyses were performed using SPSS version 18.0 statistical software (SPSS Inc, Chicago, IL, USA).
5
III. Results
A. Baseline characteristics
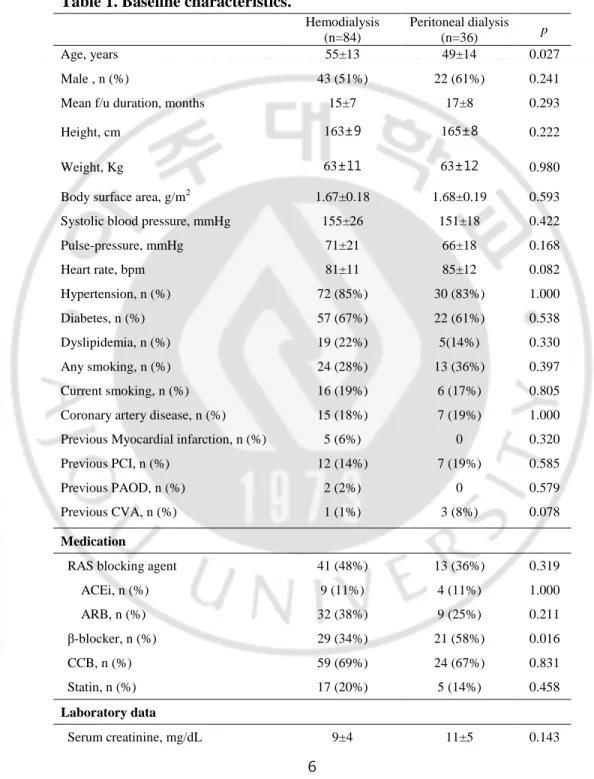
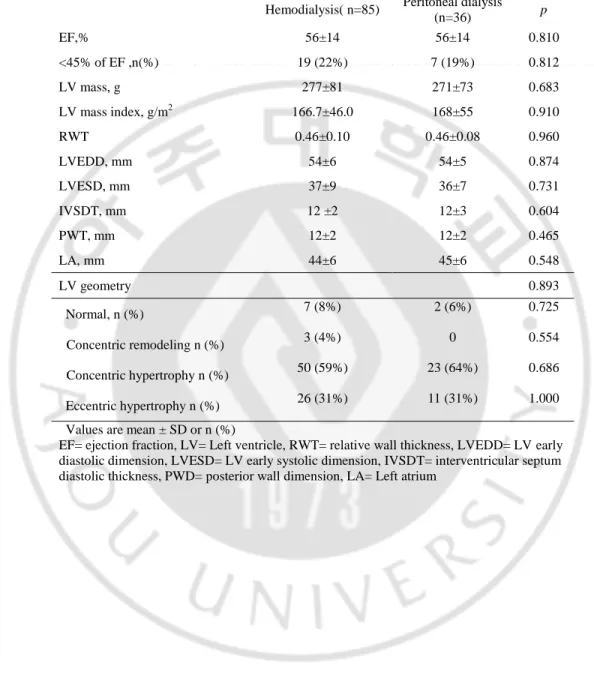
HD group was older than PD group (55±13years vs. 49±14years). Briefly, there were no significant differences between the two groups in sex, duration of dialysis, comorbidities, medications and laboratory parameters (Table 1). Baseline echocardiographic parameters were no significant differences between two groups except E/E’ was higher in PD group (7.8±9.0 vs. 18.3±7.1, p=0.001). Concentric LVH was most common in both groups (58.8% vs. 63.9%) and distribution of LV geometry did not differ (Table 2).
6
Table 1. Baseline characteristics.
Hemodialysis (n=84) Peritoneal dialysis (n=36) p Age, years 55±13 49±14 0.027 Male , n (%) 43 (51%) 22 (61%) 0.241 Mean f/u duration, months 15±7 17±8 0.293
Height, cm 163±9 165±8 0.222
Weight, Kg 63±11 63±12 0.980
Body surface area, g/m2 1.67±0.18 1.68±0.19 0.593 Systolic blood pressure, mmHg 155±26 151±18 0.422 Pulse-pressure, mmHg 71±21 66±18 0.168 Heart rate, bpm 81±11 85±12 0.082 Hypertension, n (%) 72 (85%) 30 (83%) 1.000 Diabetes, n (%) 57 (67%) 22 (61%) 0.538 Dyslipidemia, n (%) 19 (22%) 5(14%) 0.330 Any smoking, n (%) 24 (28%) 13 (36%) 0.397 Current smoking, n (%) 16 (19%) 6 (17%) 0.805 Coronary artery disease, n (%) 15 (18%) 7 (19%) 1.000 Previous Myocardial infarction, n (%) 5 (6%) 0 0.320 Previous PCI, n (%) 12 (14%) 7 (19%) 0.585 Previous PAOD, n (%) 2 (2%) 0 0.579 Previous CVA, n (%) 1 (1%) 3 (8%) 0.078
Medication
RAS blocking agent 41 (48%) 13 (36%) 0.319 ACEi, n (%) 9 (11%) 4 (11%) 1.000 ARB, n (%) 32 (38%) 9 (25%) 0.211 β-blocker, n (%) 29 (34%) 21 (58%) 0.016 CCB, n (%) 59 (69%) 24 (67%) 0.831 Statin, n (%) 17 (20%) 5 (14%) 0.458 Laboratory data Serum creatinine, mg/dL 9±4 11±5 0.143
7
Serum calcium, mg/dL 7±1 8±1 0.069 Serum phosphate, mg/dL 6±2 6±2 0.114 Ca x PO4 46±14 44±16 0.513 Serum uric acid, mg/dL 9±2 9±3 0.476 Serum albumin, g/dL 3 ±1 3±1 0.522 Serum hemogrobin, g/dL 8±2 8±2 0.443 Serum iPTH, pg/mL 276±273 262±251 0.845 Values are mean ± standard deviation (SD)
HD= hemodialysis, PD= peritoneal dialysis, PCI= percutaneous coronary intervention, PAOD= peripheral artery obstructive disease, CVA= cerebrovascular accident, ACEi= angiotensin converting enzyme inhibitor, ARB= angiotensin receptor blocker, CCB= calcium channel blocker, iPTH= intact parathyroid hormone
8
Table 2. Baseline echocardiographic parameters.
Hemodialysis( n=85) Peritoneal dialysis (n=36) p EF,% 56±14 56±14 0.810 <45% of EF ,n(%) 19 (22%) 7 (19%) 0.812 LV mass, g 277±81 271±73 0.683 LV mass index, g/m2 166.7±46.0 168±55 0.910 RWT 0.46±0.10 0.46±0.08 0.960 LVEDD, mm 54±6 54±5 0.874 LVESD, mm 37±9 36±7 0.731 IVSDT, mm 12 ±2 12±3 0.604 PWT, mm 12±2 12±2 0.465 LA, mm 44±6 45±6 0.548 LV geometry 0.893 Normal, n (%) 7 (8%) 2 (6%) 0.725 Concentric remodeling n (%) 3 (4%) 0 0.554 Concentric hypertrophy n (%) 50 (59%) 23 (64%) 0.686 Eccentric hypertrophy n (%) 26 (31%) 11 (31%) 1.000 Values are mean ± SD or n (%)
EF= ejection fraction, LV= Left ventricle, RWT= relative wall thickness, LVEDD= LV early diastolic dimension, LVESD= LV early systolic dimension, IVSDT= interventricular septum diastolic thickness, PWD= posterior wall dimension, LA= Left atrium
9
B. Comparison in change of laboratory and echocardiographic parameters after dialysis
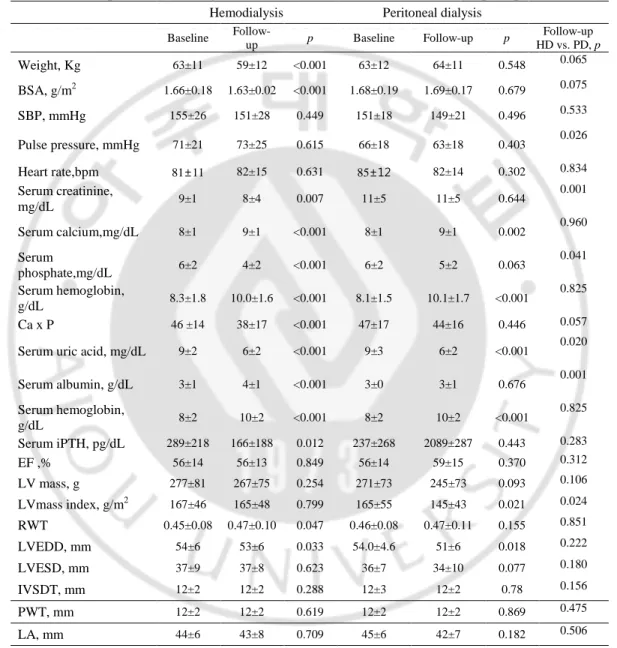
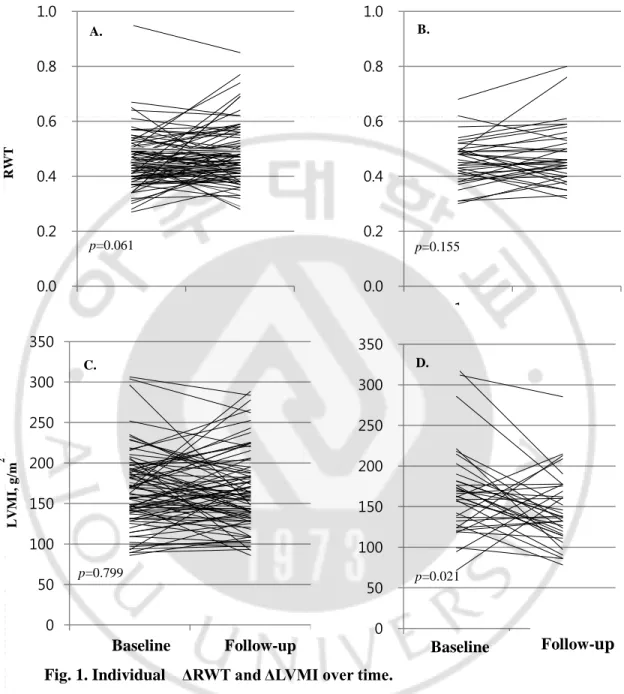
Both groups showed significant reduction of BSA (1.66±0.18 g/m2 vs. 1.63±0.02 g/m2, p<0.001; 1.68±0.19 g/m2 vs. 1.63±0.19 g/m2, p<0.001, respectively), improvement of anemia (8.3±1.8 g/dL vs. 10.0±1.6g/dL p=0.001; 8.1±1.5 vs. 10.1±1.7, p<0.001) at follow-up (Table 3.). In HD group, Significant reductions of serum calcium-phosphate product and intact PTH (46.3±14.0 vs. 38.1±17.0, p<0.001; 277.3±81.1 pg/mL vs. 165.5±188.3 pg/mL, p=0.012) were observed. Other clinical indexes were no difference between two groups after starting dialysis. LVEDD was reduced in both groups after dialysis but there was no difference between the inter-groups. Figure 1. showed individual ΔRWT and ΔLVMI over time. Only PD patients showed significant regression of LVMI (164.8±54.6 g/m2 vs. 145.1±43.1 g/m2,
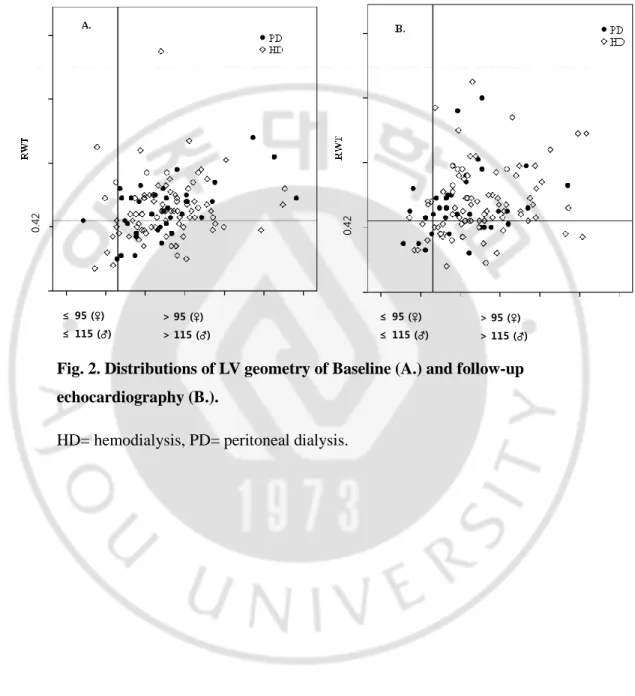
p=0.021) (Figure 1.). Distributions of LV geometry were no significant change at
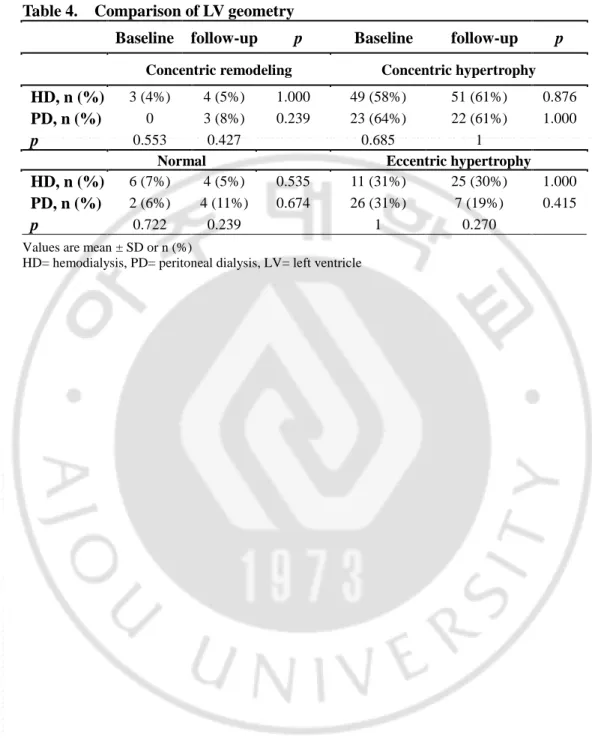
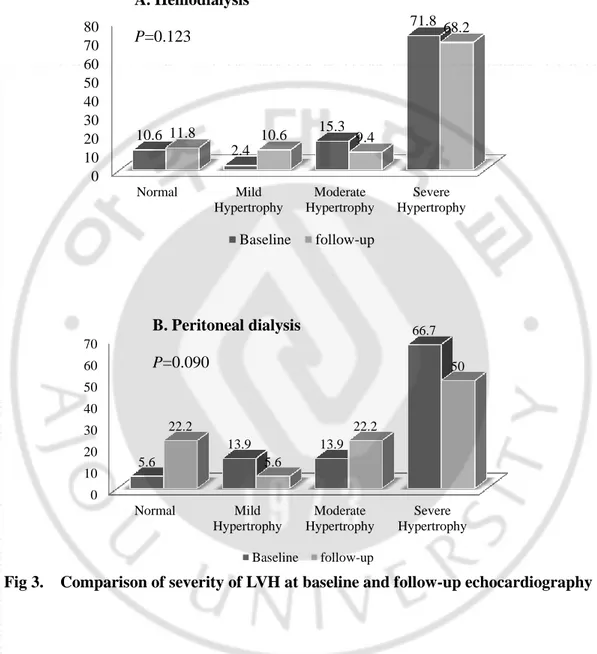
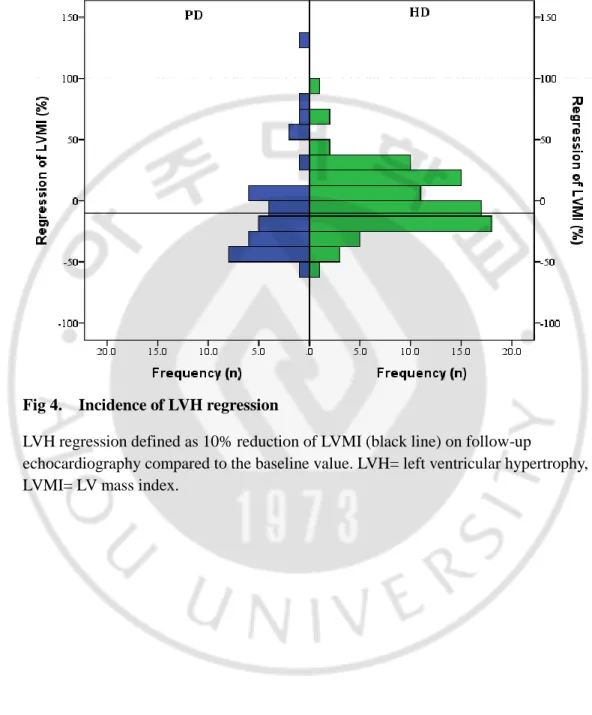
follow-up in both groups (Figure 2.,Table 4). Severe hypertrophy was predominant on baseline and follow-up echocardiography in both groups. Patients with PD had decrease of severe LVH 66.7% to 50% and increase of normal LV 5.6% to 22.6% but it was no significant difference (p=0.090) (Fig. 3.). Incidence of >10% regression of LVMI was higher in PD patients (32.9% vs. 55.6%, p=0.026) (Figure 4.). By multivariable linear regression for predicting 10% LVMI regression, Independent predictors were presence of DM, CAD, PD, serum calcium (R2=0.438, p<0.001) (Table 5.).
10
Table 3. Comparison of changes in clinical indexes and echocardiographic parameters.
Hemodialysis Peritoneal dialysis
Baseline Follow-up p Baseline Follow-up p Follow-up HD vs. PD, p Weight, Kg 63±11 59±12 <0.001 63±12 64±11 0.548 0.065 BSA, g/m2 1.66±0.18 1.63±0.02 <0.001 1.68±0.19 1.69±0.17 0.679 0.075 SBP, mmHg 155±26 151±28 0.449 151±18 149±21 0.496 0.533 Pulse pressure, mmHg 71±21 73±25 0.615 66±18 63±18 0.403 0.026 Heart rate,bpm 81±11 82±15 0.631 85±12 82±14 0.302 0.834 Serum creatinine, mg/dL 9±1 8±4 0.007 11±5 11±5 0.644 0.001 Serum calcium,mg/dL 8±1 9±1 <0.001 8±1 9±1 0.002 0.960 Serum phosphate,mg/dL 6±2 4±2 <0.001 6±2 5±2 0.063 0.041 Serum hemoglobin, g/dL 8.3±1.8 10.0±1.6 <0.001 8.1±1.5 10.1±1.7 <0.001 0.825 Ca x P 46 ±14 38±17 <0.001 47±17 44±16 0.446 0.057
Serum uric acid, mg/dL 9±2 6±2 <0.001 9±3 6±2 <0.001 0.020
Serum albumin, g/dL 3±1 4±1 <0.001 3±0 3±1 0.676 0.001 Serum hemoglobin, g/dL 8±2 10±2 <0.001 8±2 10±2 <0.001 0.825 Serum iPTH, pg/dL 289±218 166±188 0.012 237±268 2089±287 0.443 0.283 EF ,% 56±14 56±13 0.849 56±14 59±15 0.370 0.312 LV mass, g 277±81 267±75 0.254 271±73 245±73 0.093 0.106 LVmass index, g/m2 167±46 165±48 0.799 165±55 145±43 0.021 0.024 RWT 0.45±0.08 0.47±0.10 0.047 0.46±0.08 0.47±0.11 0.155 0.851 LVEDD, mm 54±6 53±6 0.033 54.0±4.6 51±6 0.018 0.222 LVESD, mm 37±9 37±8 0.623 36±7 34±10 0.077 0.180 IVSDT, mm 12±2 12±2 0.288 12±3 12±2 0.78 0.156 PWT, mm 12±2 12±2 0.619 12±2 12±2 0.869 0.475 LA, mm 44±6 43±8 0.709 45±6 42±7 0.182 0.506
Values are mean ± SD or n (%)
SBP= systolic blood pressure, BSA= body surface area, iPTH= intact parathyroid hormone, EF= ejection fraction, LV= Left ventricular, RWT= relative wall thickness, LVEDD= LV end diastolic diameter, IVSDT= interventricular septum diastolic thickness
11 0.0 0.2 0.4 0.6 0.8 1.0 1 2 0 50 100 150 200 250 300 350 1 2 0 50 100 150 200 250 300 350 1 2 0.0 0.2 0.4 0.6 0.8 1.0 1 2
B
Hemodialysis
Peritoneal dialysis
Baseline Follow-up Baseline Follow-up
LV M I, g /m 2 RW T p=0.061 p=0.155 p=0.799 p=0.021 A. B. C. D.
Fig. 1. Individual ΔRWT and ΔLVMI over time.
ΔRWT (A.) and ΔLVMI (C.) in Hemodialysis patients. ΔRWT (B.) and ΔLVMI (D.) in Peritoneal dialysis patients. RWT= relative wall thickness, LVMI= left ventricular mass index.
12 ≤ 95 (♀) ≤ 115 (♂) > 95 (♀) > 115 (♂) ≤ 95 (♀) ≤ 115 (♂) > 95 (♀) > 115 (♂) 0. 42 0. 42
Fig. 2. Distributions of LV geometry of Baseline (A.) and follow-up echocardiography (B.).
13
Table 4. Comparison of LV geometry
Baseline follow-up p Baseline follow-up p
Concentric remodeling Concentric hypertrophy
HD, n (%) 3 (4%) 4 (5%) 1.000 49 (58%) 51 (61%) 0.876
PD, n (%) 0 3 (8%) 0.239 23 (64%) 22 (61%) 1.000
p 0.553 0.427 0.685 1
Normal Eccentric hypertrophy
HD, n (%) 6 (7%) 4 (5%) 0.535 11 (31%) 25 (30%) 1.000
PD, n (%) 2 (6%) 4 (11%) 0.674 26 (31%) 7 (19%) 0.415
p 0.722 0.239 1 0.270
Values are mean ± SD or n (%)
14 0 10 20 30 40 50 60 70 Normal Mild Hypertrophy Moderate Hypertrophy Severe Hypertrophy 5.6 13.9 13.9 66.7 22.2 5.6 22.2 50 Baseline follow-up 0 10 20 30 40 50 60 70 80 Normal Mild Hypertrophy Moderate Hypertrophy Severe Hypertrophy 10.6 2.4 15.3 71.8 11.8 10.6 9.4 68.2 Baseline follow-up A. Hemodialysis P=0.123 B. Peritoneal dialysis P=0.090
15
Fig 4. Incidence of LVH regression
LVH regression defined as 10% reduction of LVMI (black line) on follow-up
echocardiography compared to the baseline value. LVH= left ventricular hypertrophy, LVMI= LV mass index.
16
Table 5. The output from a multivariable linear regression to predict >10% of LVMI regression. Variable β (coefficient) 95% CI p PD 2.119 1.041-4.736 0.048 CAD 0.339 0.339-8.213 0.037 DM 0.464 0.203-8.213 0.033 Serum calcium 0.576 0293-1.134 0.011
The initial model included following variables: age, sex, modality of dialysis, presence of diabetes mellitus (DM), coronary artery disease, previous myocardial infarction, heart failure (ejection fraction [EF] <45%) , systolic blood pressure, diastolic pressure, heart rate, serum hemoglobin, serum calcium, calcium-phosphate product, serum intact PTH. variables of volumetric data included multivariate analysis were selected by p value < 0.02 of correlation analysis. LVMI= Left ventricular mass index, PD= peritoneal dialysis, CAD= coronary artery disease, PTH= parathyroid hormone, R2=0.438, p<0.001.
17
IV. Discussion
LVH assessed by echocardiography was known as risk factor of cardiovascular disease apart from the conventional risk factors (Levy et al., 1990). ~70 to 80% of patients with stage 4 to 5 CKD have LVH before the initiation of dialysis. Systolic arterial hypertension and elevated pulse pressure are strongly associated with LVH in patients with advanced CKD, suggesting that fluid overload , increase of systolic blood pressure, arterial stiffness play a role in progression to LVH (Paoletti et al., 2005), in addition anemia, secondary hyperparathyroidism and chronic micro-inflammation had known to contribute developing LVH (Harnett et al., 1994). In this study, 90% of patients had LVH in pre-dialysis period and among them, 70.2% had severe LVH. We conducted subgroup analysis to evaluate effect of LVH on cardiovascular events (composite with cardiac death, myocardial infarction, coronary artery revascularization). There was no significant difference, but patients with LVH had higher incidence of cardiovascular events (23.0% vs. 9.5% p=0.239).
A few studies had conducted comparing the impact of dialysis modality on LV remodeling. According to Previous study, on patients with PD had lower incidence of LVH in PD patients after short duration of dialysis by maintaining residual renal function and more adequate volume control (Tian et al., 2008), in contrast Enia et al. reported long-term PD patients had severe LVH compared to HD patients because long-term PD had deterioration of residual renal function and progressive loss of peritoneal ultrafiltration capability (Enia et al., 2001). But other two studies showed higher prevalence of LVH in HD patients at short-term and long term duration of dialysis (Hiramatsu et al., 2007; Tian et al., 2008). These results are consistent with ours. Hiramasu et al. compared longitudinal changes in echocardiographic parameter but they based on this study just 26 patients, and Tian et al. conducted cross sectional study. Our study is based on patients with ‘real world’ practice of dialysis, though echocardiography follow-up duration was shorter than those studies. And we had
18
conducted study with larger number of patients and compared longitudinal change of echocardiographic and clinical parameter. After initiating dialysis, patients in both groups did not reduced systolic blood pressure after dialysis. Pulse-pressure was lower in PD groups after dialysis (72.5±24.7 vs. 63.3±18.3 p=0.026). Though prevalence of LVH was similar in both groups (88% vs.77.8%, p=0.166) and severe LVH was predominant, There was significant reduction of LVMI in patients with PD (165.5±47.2 vs. 145.1±43.1 p=0.028). Tian et al. showed more appropriate control of ECW in PD group and Hiramasu et al showed more stable cardiac parameters after long term dialysis. We did not checked ECW but more regression of LVEDD showed indirect evidence of appropriate ability of volume control in PD. Besides there was improvement of anemia, intact PTH and serum calcium-phosphate in HD group, there was no reduction of LVMI. HD have some co-factors affecting LVH in addition to blood pressure and volume status. Previous study reported that large flow arterio-venous fistular contributed to progression of LVH by lowering vascular resistance, resulting in an increase of venous return. And conventional thrice-weekly diffusive hemodialysis, excessive ultrafiltration and inter-dialytic hypotension associated with myocardial injury (Burton et al., 2009).
LV geometry classified by LVMI and RWT as 4 types, it determined by predominant pathogenetic factor whether afterload related factor or preload related factor (Ganau et al., 1992). Afterload related factors are systemic arterial resistance, elevated systolic (and diastolic) arterial blood pressure, and large vessel compliance and increased afterload lead to myocardial cell thickening and concentric LVH. Preload related factors are expansion of intravascular volume (water and salt loading), anemia, large flow arterio-venous fistula. Increase of preload cause lengthening of myocardial cell and eccentric LVH. (Krumholz et al., 1995). But it is difficult to anticipate change of LV geometry in patients with ESRD after initiating dialysis because of afterload related factor and preload related factor are not independent and they are closely related to each other in ESRD patients. Many studies demonstrated a predomination of
19
concentric LVH (40-63%) in ESRD (London and Parfrey, 1997; Ha et al., 1998; Li et al., 2009). Our result consisted with previous studies, most common type was concentric hypertrophy in both groups before and after dialysis. Perhaps predominance of concentric hypertrophy is because continued higher rate of HTN. Though significant geometric change did not observed in both group, there were reduction of eccentric LVH (30.6% to 19.4%) and increase of normal geometry (5.6% to 11.1%) in PD group. To define the impact of dialysis modality on LV geometry should be more patients and long term data. And insufficient correction of confounding factor for LVH such as SBP, anemia and serum calcium-phosphate might influence no change of LV geometry in both groups. London et al. reported 10% regression LVM reduce 28% cardiovascular mortality. Previous study reported factors associated with LV mass reduction as younger age, lower pulse pressure, higher GFR (McMahon et al., 2004). According to our results, patients with PD had lower pulse pressure and significantly reduced LVMI. And PD and absence of CAD remained independent predictor for ≥10% LVMI regression (London et al., 2001).
This study has some limitations. First, this study is observational, retrospective, it includes possibility of incomplete data collection and a dependency on previous recorded data in the medical records. Second this study made up of small number of patients and we did not showed long-term outcome. Third, there is lack of factors relating volume status such as residual renal function and dialysis adequacy. To conduct accurate comparison, it is necessary to correcting aforementioned limitations.
20
V. Conclusion
We compared longitudinal change of echocardiographic and clinical parameter after start of dialysis in HD and PD patients who received “real world” conventional practice and tried to investigate impact of dialysis morality on LV geometry. Though this study did not showed significant geometric change of LV after start of dialysis, in PD patients had significant LVMI regression and PD was independent predictor for LVMI regression. We could conclude that PD is more feasible than HD aspect of reduction of LVH.
21
REFERENCES
1. Burton JO, Jefferies HJ, Selby NM, McIntyre CW: Hemodialysis-induced cardiac injury: determinants and associated outcomes. Clin J Am Soc Nephrol 4: 914-920, 2009
2. Devereux RB, de Simone G, Ganau A, Roman MJ: Left ventricular hypertrophy and geometric remodeling in hypertension: stimuli, functional consequences and prognostic implications. J Hypertens Suppl 12: S117-127, 1994
3. Enia G, Mallamaci F, Benedetto FA, Panuccio V, Parlongo S, Cutrupi S, Giacone G, Cottini E, Tripepi G, Malatino LS, Zoccali C: Long-term CAPD patients are volume expanded and display more severe left ventricular hypertrophy than haemodialysis patients. Nephrol Dial Transplant 16: 1459-1464, 2001
4. Ganau A, Devereux RB, Roman MJ, de Simone G, Pickering TG, Saba PS, Vargiu P, Simongini I, Laragh JH: Patterns of left ventricular hypertrophy and geometric remodeling in essential hypertension. J Am Coll Cardiol 19: 1550-1558, 1992
5. Ha SK, Park HS, Kim SJ, Park CH, Kim DS, Kim HS: Prevalence and patterns of left ventricular hypertrophy in patients with predialysis chronic renal failure.
J Korean Med Sci 13: 488-494, 1998
6. Harnett JD, Kent GM, Barre PE, Taylor R, Parfrey PS: Risk factors for the development of left ventricular hypertrophy in a prospectively followed cohort of dialysis patients. J Am Soc Nephrol 4: 1486-1490, 1994
7. Hiramatsu T, Furuta S, Kakuta H: Impact of dialysis modality on ultrasonographic cardiovascular parameters in elderly patients. Adv Perit Dial 23: 94-97, 2007
22
8. Krumholz HM, Larson M, Levy D: Prognosis of left ventricular geometric patterns in the Framingham Heart Study. J Am Coll Cardiol 25: 879-884, 1995 9. Lang RM, Bierig M, Devereux RB, Flachskampf FA, Foster E, Pellikka PA,
Picard MH, Roman MJ, Seward J, Shanewise JS, Solomon SD, Spencer KT, Sutton MS, Stewart WJ, Chamber Quantification Writing G, American Society of Echocardiography's G, Standards C, European Association of E: Recommendations for chamber quantification: a report from the American Society of Echocardiography's Guidelines and Standards Committee and the Chamber Quantification Writing Group, developed in conjunction with the European Association of Echocardiography, a branch of the European Society of Cardiology. J Am Soc Echocardiogr 18: 1440-1463, 2005
10. Levin A, Singer J, Thompson CR, Ross H, Lewis M: Prevalent left ventricular hypertrophy in the predialysis population: identifying opportunities for intervention. Am J Kidney Dis 27: 347-354, 1996
11. Levy D, Garrison RJ, Savage DD, Kannel WB, Castelli WP: Prognostic implications of echocardiographically determined left ventricular mass in the Framingham Heart Study. N Engl J Med 322: 1561-1566, 1990
12. Li AL, Ke YN, Zeng YJ, Li WG, Bian WJ: [Echocardiographic evaluation of left ventricular geometry and function in maintenance hemodialysis uremic patients]. Zhonghua Xin Xue Guan Bing Za Zhi 37: 913-916, 2009
13. London GM, Pannier B, Guerin AP, Blacher J, Marchais SJ, Darne B, Metivier F, Adda H, Safar ME: Alterations of left ventricular hypertrophy in and survival of patients receiving hemodialysis: follow-up of an interventional study. J Am
Soc Nephrol 12: 2759-2767, 2001
14. London GM, Parfrey PS: Cardiac disease in chronic uremia: pathogenesis. Adv
Ren Replace Ther 4: 194-211, 1997
15. McMahon LP, Roger SD, Levin A, Slimheart Investigators G: Development, prevention, and potential reversal of left ventricular hypertrophy in chronic kidney disease. J Am Soc Nephrol 15: 1640-1647, 2004
23
16. Morton CC: U.S. dialysis survival strategy. Ann Intern Med 128: 514-516, 1998 17. Paoletti E, Bellino D, Cassottana P, Rolla D, Cannella G: Left ventricular hypertrophy in nondiabetic predialysis CKD. Am J Kidney Dis 46: 320-327, 2005
18. Tian JP, Wang T, Wang H, Cheng LT, Tian XK, Lindholm B, Axelsson J, Du FH: The prevalence of left ventricular hypertrophy in Chinese hemodialysis patients is higher than that in peritoneal dialysis patients. Ren Fail 30: 391-400, 2008 19. Zoccali C, Benedetto FA, Mallamaci F, Tripepi G, Giacone G, Stancanelli B,
Cataliotti A, Malatino LS: Left ventricular mass monitoring in the follow-up of dialysis patients: prognostic value of left ventricular hypertrophy progression.
24 -국문 요약-
말기 신부전 환자에서 투석 방법에 따른
좌심실 형태 변화의 영향
배경: 좌심방 비대는 말기 신부전 환자에서 사망률을 증가시키는 독립인자이 다. 본 연구는 심장 초음파를 이용하여 투석 방법이 좌심방 형태에 미치는 영향을 밝히고자 한다. Methods: 후향적으로 2002년에서 2012년 사이 투석을 시작한 환자에서 2D-경흉부 초음파를 이용하여 좌심방 질량지수(LVMI), 상태적 벽두께 (RWT), 좌심방 형태의 변화를 조사하였다. 투석 방법에 따라 혈액 투석군 과 복막 투석 군으로 나누었다. 추적 심초음파를 시행한 시기는 혈액투석 15±7 개월, 복막투석군이 17±8 개월로 양군에서 차이는 없었다. 좌심실 형태는 LVMI 가 남자는 115g/m2, 여자는 95g/m2 이하, RWT가0.42 이하 를 정상치로하고, 정상 LVMI 와 RWT 가 0.42이상인 군을 구심성 재구성, LVMI가 정상치 이상인 경우 RWT 이 0.42이상인 경우 구심성 비대, 0.42 이하인 경우 원심성비대로 구분하였다. 좌심실 비대의 중증도는 American society of echocardiography 의 권고에 따라 나눴다 (남자; mild: 116-131g/m2, moderate: 132-148 g/m², severe: ≥149 g/m², 여자; mild: 96-108 g/m², moderate: 109-121 g/m², severe: ≥122 g/m² of LVMI). 10% LVMI 감소의 예측인자를 구하기 위하여 다변량 분석을 이용 하였다.결과: 84명의 혈액투석 환자 (age 55±13years, 50% male) 와 36 명의 복막투석 (age 49±14 years, 62% male) 환자를 대상으로 하였고, 투석
25 시작 전 양 군에서 좌심실 구축율과 LVMI, RWT 의 차이는 없었고 (56± 14% vs. 56 ±14%, p=0.810; 166.7±46.0g/m² vs. 167.8±54.6g/m², p=0.910; 0.456±0.094 vs. 0.455±0.082, p=0.96, respectively), 투석 전 구심성 비대가 가장 많았다. (59% vs. 64%). 투석 후 혈액투석군에서 LVMI 의 변화는 없었고 (166.7±46.0g/m2 vs. 165.5±47.2g/m2, p=0.799), 복막 투석군에서 LVMI가 의미있게 감소하였고(164.8± 54.6g/m2 vs. 145.1±43.1g/m2, p=0.021), 혈액 투석 군보다 LVMI 가 10% 이상 감소한 비율이 높았다(33% vs. 56%, p=0.026). 추적 심초음파에서 양군 모두 구심성 심비대의 우세는 변하지 않았으나 (61% vs. 61%) 복막 투석 환자군에서 중증 심비대가 의미있지는 않았으나 67% 에서 50%로 감소하였다. 다변량 분석에서 복막투석과 (odds ratio[OR]:2.119, 95% confidence interval [CI]:1.041-4.736, p=0.048), 당뇨 (OR:0.464, 95%CI: 0.203-8.213, p=0.033), 심혈관질환 (OR:0.339, 95%CI: 0.339-8.213, p=0.037 ), serum calcium (OR:0.579, 95%CI:0.293-1.134,
p=0.011)이 LVMI 10%이상 감소의 독립인자였다.
Conclusion: 두 군에서 투석 전후 좌심실 형태의 분포의 차이는 보이지 않 았으나 복막 투석 환자에서 LVMI 가 의미있게 감소하였으며 복막 투석은 LVMI 10%이상 감소의 독립인자였다.