Figure1. Location of the site
1 INTRODUCTION
The largely-deformed reinforced earth wall, a part of the main line of the Tottori expressway, is bounded by the valley of the mountain area located at the end of the expressway in Hyogo, Japan. A tributary of a second-grade river flows in front of it. The wall is a reinforced earth wall with geo-textile that was constructed with the local soils. The retaining wall was designed using a method to install the anchor in the beginning, but later a method of construction was re-examined according to the change of the design horizontal seismic intensity (0.12g Æ0.16g). As a result, a spike-grid wall method was employed. In November of 2006, deformation of the wall was observed at the sixth stage of the construction, and thus, reconstruction and cement stabilization were done after removing some parts of the reinforced earth wall. Also, in April of 2007, the wall was again largely deformed at the eleventh stage of the construction being almost the planned height of the wall. Therefore, after demolishing the wall, the wall was reconstructed involved with cement stabilization of the backfill. In addition, at that time, a layer for drainage was mounted in the middle part of the reinforced earth wall. This project examined thoroughly the current state of the reinforced earth wall by means of various techniques such as a surface wave survey, boring, and a
series of laboratory tests in order to grasp the cause of deformation of the reinforced earth wall. The results are described in Part I. In this Part II, it was attempted to elucidate the deformation mechanism of the reinforced earth wall by means of a numerical analysis, and also to establish efficient countermeasures. Finally, the stability of the reinforced earth wall involved with the countermeasures was evaluated.
CASE STUDY ON SEVERELY-DAMAGED REINFORCED EARTH WALL
WITH GEO-TEXTILE IN HYOGO, JAPAN
Part II: Numerical simulation into causes and countermeasures
JINSUK HUR i), SHUNZO KAWAJIRI i), MINSU JUNG ii) and SATORU SHIBUYA iii)
ABSTRCT
Numerical analysis was carried out in order to simulate the development of the large deformation that took place on the reinforced earth wall, a part of the Tottori expressway planned to pass Hyogo, Japan. Since this reinforced earth wall had experienced unexpected deformation of the wall during construction, the wall was re-constructed twice. However, the wall deformation showed no sign to cease even at the final stage of the construction. Countermeasures to re-stabilize the wall were demanded. In part I of this paper, it was manifested that subsidence of a 3-meter weak soil due to seepage flow was responsible for the large deformation. A part of concrete panel wall was severely damaged due to extremely large pulling force of geotextile induced by the hammock state. As for the countermeasures, “grouting with slag system” was applied to fill voids of the backfill, and also to prevent further development of settlement in the weak soil layer. “Ground anchor” was also considered to achieve the prescribed factor of safety.
Key Words : Reinforced earth wall, Numerical simulation, Deformation , Stability, Hammock state
i) Doctoral student, Graduate school of Civil Engineering, Kobe University, Japan ([email protected], [email protected]) ii) Research Associate, Graduate School of Civil Engineering, Kobe University, Japan ([email protected])
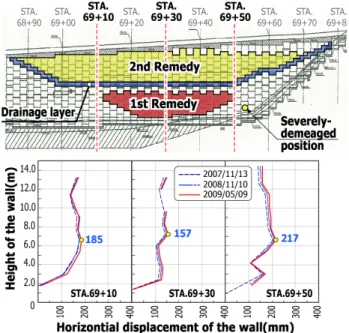
Figure 2. Observed deformations of the wall facing
2 AN INVESTIGATION INTO THE CAUSE OF DEFORMATION OF THE WALL BY NUM-ERICAL ANALYSIS
According to the measurement for the wall deformation, the range for the maximum value of horizontal deformation was 150 to 200mm (Fig.2). This corresponds to deformation rates of 1.0 to 1.5% against the height of the wall. In this study, various site investigations were carried out to find the cause of deformation of the reinforced earth wall. In this chapter, a numerical analysis using widely used numerical program was conducted to identify clearly the cause of deformation of the reinforced earth wall, and to take appropriate measures. First, in order to conduct a numerical analysis, a back analysis was performed by using the results of the displacement of the wall, together with estimated soil properties. Second, various analyses were carried out to examine the factors influencing the deformation of the reinforced earth wall. In this study, widely used programs of FLAC and PLAXIS were used.
Figure 3 shows a representative cross section used in the numerical analysis, Note that the cross section of STA69+50 corresponds to the portion where the wall was severely damaged.
2.1 Estimating soil properties using a back analysis
This study considered on-site topographical con-ditions, sequences of construction and rain records to estimate soil properties of the site. The back analysis was conducted by employing the Mohr-Coulomb (MC) model installed in FLAC. The geogrids employed for the reinforcement were not modeled independently, and were regarded as compound ground that was integrated with the backfilled soils. The internal friction angle (φ) of the compound ground employed in the MC model was reflected in the analysis by considering the result of the small-scale plane strain compression tests using a specimen strengthened in the tension side. It was also postulated that neither the reinforcement materials (i.e., geogrid) nor the filling materials (i.e., soil) have cohesion.
Conversely, the portions of the backfill improved by cement stabilization at the time of the first and second remedies exhibit some cohesive strength. In addition, the back analysis was performed by a total stress analysis, in which that any seepage was not considered at all. Figure 4 shows a set of deformed mesh of the reinforced earth wall formulated by a back analysis, and the results from field observation are also indicated. Table 1 shows soil properties of the site estimated by the back analysis.
Figure3. Cross section used in the numerical analysis
Figure 4. Deformed mesh of the reinforced earth wall
2.2 Influences of seepage water
Figure 5 shows the record of rainfall at the site. It shows that the measured displacement increased after raining. This result may be interpreted due to the effects of infiltration water caused by heavy rains, which remained inside the embankment, despite that the drainage layer was made at the time of the second remedy construction. Therefore, this paper numerically examined the influences of the ground water as well as surface water flowing from the valleys.
This analysis was conducted using the PLAXIS that is convenient and suitable for an effective stress analysis. Each analysis of a groundwater level at ordinary times and a ground-water level in case of rain was performed, and the results were also compared and analyzed. In addition, this study supposed that the geogrids display normal tensions to clarify the influences of the groundwater level. In the meantime, this research separately performed modeling of the geogrids using “GEOGRID ELEMENT” of the PLAXIS (Fig.6). Figure 7 shows how the reinforced earth wall was deformed according to the increase in the ground water level. The maximum amount of displacement without raining is 148.3mm, and that in case of rain is 211.5mm. This observation strongly suggests that the infiltration water permeating the reinforced earth wall has an influence on the movement of the wall.
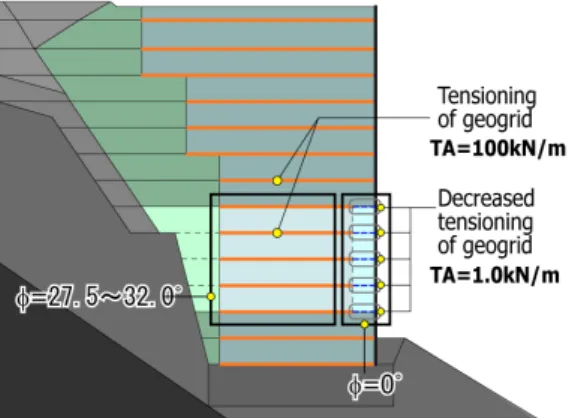
2.3 Deformation of reinforced earth wall caused by the Hammock state
In general, in the case that the wall surface of the reinforced earth wall is constructed with materials that are less stiff like the panel type, the partial compression failure that took place at the lower part can be connected with the whole deformation or the panel can be removed because of a poor combination of the wall and the geogrids, leading to collapse of the wall finally.
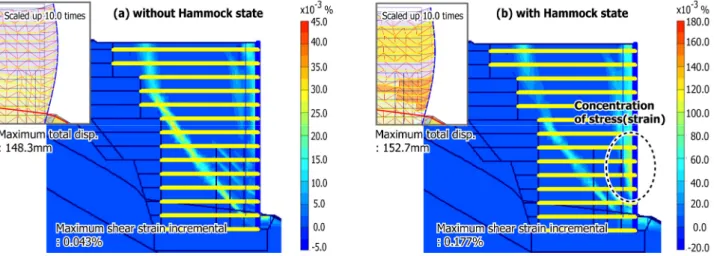
At the site, deformation of the wall surface was monitored under construction, and thus construction was done twice and the work of stabilization by cement was performed. As a result, the earth press increased by the high reinforced earth wall was accumulated on the lower layer that cement stabilization was not performed, causing relatively big compression on this part. Since the geogrids are unable to display their own designed tensile force and the shear strength of the ground decreases in the condition of Hammock, it is possible (it is feared) that the vertical earth press increased by multi-step filling will not be completely delivered to the sublayer. This chapter examined that the condition of Hammock is the cause of the deformation of the wall surface using a numerical analysis. Figure 9 shows the results to analyze the case of normal geogrid and the case of geogrid in the condition of Hammock. This result reveals that the shear strains of the war surface of
Figure 6. Element types employed for the Figure 7. Deformed meshs due to the increase in a water level analysis by PLAXIS
Figure 5. Record of rainfalls at the site
the part that the strength of geogrids and filling materials decreased had been increased. This result also proves that deformation of the wall surface increased.
2.4 Deformation Mechanism of the Reinforced Earth wall
Since a river flows in front of the reinforced earth wall and there are mountainous areas on the back side of the wall, the water in the valley can be easily penetrated into the rear side of the reinforced earth wall. In addition, the result of a laboratory test using samples collected from the test pit of the filling has revealed that some layers of the reinforced earth wall were constructed using clayey soils with abundant fine grained soils. This geomaterial exhibited two characteristics. First, it is difficulty to compact properly due to high fines content. Second, a considerable amount of settlement takes place on soaking. By performing a numerical analysis, it was manifested that a reduction in effective stress inside the filling caused by infiltrated water, induced a considerable amount of deformation of the wall, and the Hammock state was the cause to increase the shear deformation giving rise to partial stress concentration on the wall
surface.
The deformation mechanism from the results of the site investigation as well as the numerical analysis can be summarized as follows. First, the filling materials with a high compressibility existed on some layers inside the backfill. Next, rainwater and the water in a valley infiltrated into the layers, which in turn induced compression settlement. As a result of the generation of settlement in the weak soil layer, so-called Hammock state (refer to Part I) in which the weight of the upper filling was partially supported by the geogrids was formed. This condition applied very powerful tensile strength to the geogrid, and caused stress concentration on the concrete panel wall surface connected to the geogrid. In the end, a type of compression failure took place on the wall surface.
3 AN EXAMINATION OF THE COUNTERMEA-SURES BY THE NUMERICAL ANALYSIS
While an examination of the causes and countermea-sures was underway over the few months, the deformation of the wall surface was continuously developed. Appropriate countermeasures was desperately needed to secure the stability of the reinforced earth wall by considering the traffic load and the paving load that will be applied to the wall in service. Therefore, this chapter examined the effects of countermeasure works by means of a numerical analysis.
3.1 Deformation Behavior of the wall by increasing the stiffness of the weak Layer
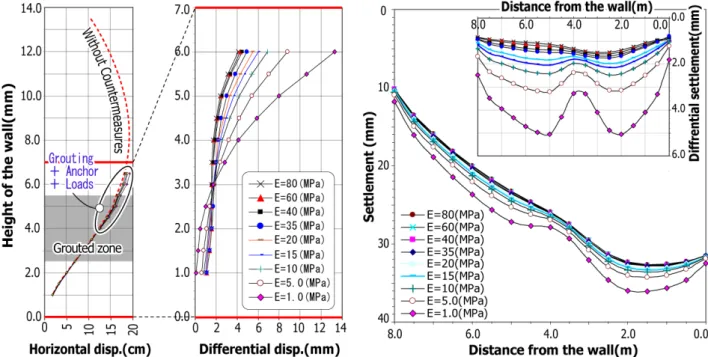
This study examined the effects for the case that cement grouting was filled in the soft layer observed through site investigations. A parametric study was carried out to see the effects of Young’s modulus of the targeted section. Figure 12 shows the result showing the tendency of the settlement occurrence when Young’s modulus of the grouted body is changed from 40MPa to 1,000MPa (a total of 11cases). In this figure, the Figure 9. Incremental shear strains in the fill, together with the deformed meshs near the wall facing
settlement behavior at three sections; i.e., the upper part, the middle part, and the lower part is shown. In case that traffic loads and paving loads are applied on the upper part of the reinforced earth wall after grouting, the settlement is expected to be 13cm to 50cm on the upper part, 12cm to 47cm on the middle part, and 9cm to 32cm on the lower part. Figure13 shows a normalized graph to show the effectiveness of grouting, and in this graph, the maximum settlement in case that applied loads on the reinforced earth wall without grouting was taken as 100%. According to the graph, the effec-tiveness of grouting is the highest for the Young’s modulus between 50MPa and 100MPa. In the meantime, the effectiveness in the range exceeding 200 MPa is relatively low.
3.2 A Combination of Ground Anchor and Grout
As described in the above, Figure 13 shows that the economic strengthening effectiveness is below 20% of grounting, In this case, Young’s modulus is about 80MPa to 100 MPa. However, after grouting, a considerable deformation in excess of 20cm due to the settlement was still expected. Therefore, we had reached a decision that the ground improvement by grouting has limits in preventing deformation of the wall. Accordingly, a numerical examination for the ground anchor method, i.e., a proactive method to prevent deformation, was performed.
Figure 14 shows the displacement that was caused on the wall surface in case that applied traffic loads and paving loads after using ground anchors, together with grouting. The result reveals that the deformation of the reinforced earth wall can be prevented by the tensile force of the ground anchor even in case that Young’s modulus of the grouted body is not so high.
Figure 16 shows the transformed gradients of geogrid according to the change of E50 of the grouting zone. The purpose of grouting is to reduce the vertical displacement by traffic loads and paving loads to be applied on the wall after construction by increasing the ground stiffness of the soft layer and also to prevent instabilities of the reinforced earth wall by improving the Hammock state of the geogrids. In this sense, it can be regarded appropriate that E=20MPa of the inflection point is taken as a target point as shown in Figure 16, in which the relationship between the tilted angle and E50 is given. The tilted angle at this point is about 0.02 degree and the settlement of the upper part of the grouted body is about 2mm. The strain obtained from E50 of unconfined compression test is about 0.5% to 1.0 % (Fig.17(a)). In the meantime, the compression strain of the weak layer in case of E50=20MPA is about 0.56% (Fig.17(b)).
Considering the strain level dependence of Young’s modulus, it is considered that the elastic Young’s modulus of the original ground will be a little higher than E50 obtained from unconfined compression test. On the basis of the results of the laboratory test and a numerical analysis, the injection rate of grouting was determined at the value of about 10%.
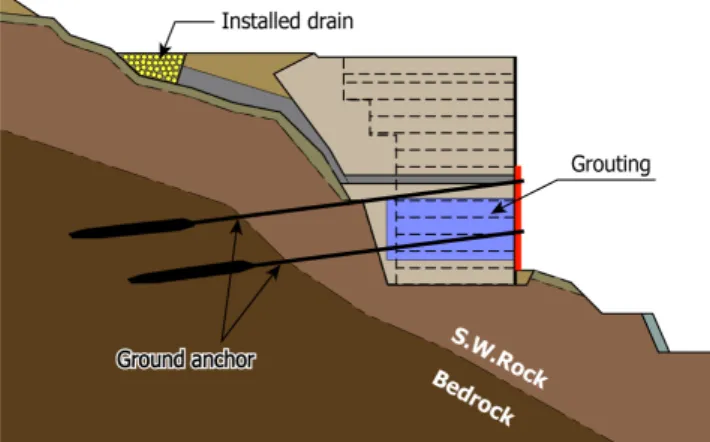
Figure 11. Scheme of countermeasurs to re-stabilize the wall
Table 2. Soil properties used for the analysis
Figure 12. Predicted settlement in the grouted zone Figure 13. Relationship between E50
Figure 14. Deformation of the wall facing Figue 15. Settlement of the weak soil layer
Figure 16. Inclination of the geogrid Figure 17. Elastic modulus of the grouted zone
3.3 Countermeasures
Based on the aforementioned examination of the site, together with the results of numerical analysis, a water cut-off method was employed to prevent penetration of
the ground water supply from the valley. Grouting in the weak layers of the reinforced earth wall , together with ground anchors were employed to increase the stability of the wall.
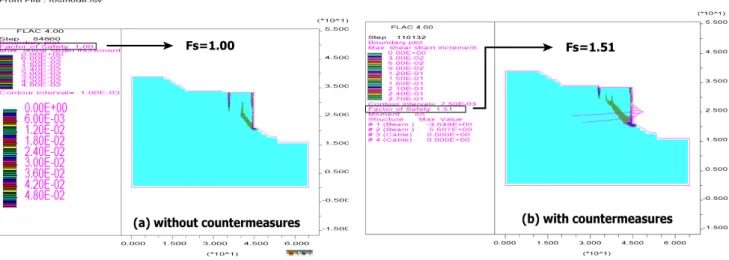
Figure 18 shows the result of the stability analysis of the overall reinforced earth wall after applying countermeasures. The analysis was conducted by means of Phi-c reduction method. The minimum rate for the safety factor was Fs=1.51 after implementing the countermeasures, the value of which exceeds Fs=1.25 of the allowable rate for the safety factor in design. Table 3. Countermeasures against severely-damaged wall
4 CONCLUSIONS AND LESSONS LEARNT
In this paper, the causes of a large deformation estimated from site investigations and laboratory tests were interpreted by means of numerical analysis. Moreover, the effects of countermeasures were examined. The main outcomes obtained from this research are outlined below.
(1) This research explained that the surface water and/or the water in the valley can be easily infiltrated into a backfilled ground because of the topography of the site. The infiltration water increases the deformation of the wall, reducing the shear strength of the filling materials. This result represents that even when reinforced earth walls are constructed, an efficient drainage system is needed.
(2) In case of the reinforced earth wall comprising concrete panels, when the Hammock state inside the backfill was formed involved with compressive settlements at the sub layer, the shear strength between the geo-grids and the soils is lost, and as a result, the wall is subjected to a large deformation l. Therefore, in the course of construction of a reinforced earth wall with a flexible wall, it is essential that a care is needed to use a high-quality geomaterial for compaction, together with a thorough management of compaction work.
(3) In this case study, the injection rate of grouting suggested to increase the stiffness of the soft ground by about 10% turned out to be efficient. However, considering loads applied to the ground after construction, the method to use only grouting was not enough to prevente further development of the wall deformation. Therefore, ground anchors with grouting are suggested as an efficient construction method to prevent the wall deformation, and also to secure the required rate for safety factor.
REFERENCES
1) Moraci, N., Rimoldi,P., Mandaglio,M.C. (2006): “A design procedure for geosynthetic reinforced soil structures”, Geosynthetics, J. Kuwano & J. Koseki. Pp.1249~1254
2) Chirica, A., Baicu, A.M. (2006): “Some considerations about the calculus of earth retaining structures reinforced with geosynthectics”, Geosynthetics, J. Kuwano & J. Koseki. Pp.1271~1274
3) Queiroz, P.I.B., Gomes, R.C. (2006): “Numerical tools for geosynnthetic reinforced walls design: A performance assessment on the basis of laboratory-scale models results”, Geosynthetics, J. Kuwano & J. Koseki. Pp.1335~1338 4) Bathurst, R.J., Hatami, K. (2006): “Parametric analysis of
reinforced soil walls with different height and reinforcement stiffness”, Geosynthetics, J. Kuwano & J. Koseki. Pp.1343~ 1346