저작자표시-동일조건변경허락 2.0 대한민국 이용자는 아래의 조건을 따르는 경우에 한하여 자유롭게 l 이 저작물을 복제, 배포, 전송, 전시, 공연 및 방송할 수 있습니다. l 이차적 저작물을 작성할 수 있습니다. l 이 저작물을 영리 목적으로 이용할 수 있습니다. 다음과 같은 조건을 따라야 합니다: l 귀하는, 이 저작물의 재이용이나 배포의 경우, 이 저작물에 적용된 이용허락조건 을 명확하게 나타내어야 합니다. l 저작권자로부터 별도의 허가를 받으면 이러한 조건들은 적용되지 않습니다. 저작권법에 따른 이용자의 권리는 위의 내용에 의하여 영향을 받지 않습니다. 이것은 이용허락규약(Legal Code)을 이해하기 쉽게 요약한 것입니다. Disclaimer 저작자표시. 귀하는 원저작자를 표시하여야 합니다. 동일조건변경허락. 귀하가 이 저작물을 개작, 변형 또는 가공했을 경우 에는, 이 저작물과 동일한 이용허락조건하에서만 배포할 수 있습니다.
Development of Nanoprobes for the Biological
Imaging Using Positive Charged Quantum Dots
and Upconversion Nanoparticles
by
Junghan Lee
Major in Molecular Medicine
Department of Biomedical Sciences
The Graduate School, Ajou University
Development of Nanoprobes for the Biological
Imaging Using Positive Charged Quantum Dots
and Upconversion Nanoparticles
by
Junghan Lee
A Dissertation Submitted to The Graduate School of
Ajou University in Partial Fulfillment of the Requirements for
The Degree of Ph. D. in Biomedical Sciences
Supervised by
Sun Park, M.D., Ph.D.
Major in Molecular Medicine
Department of Biomedical Sciences
The Graduate School, Ajou University
This certifies that the dissertation
of Junghan Lee is approved.
SUPERVISORY COMMITTEE
Sun Park
Kyongmin Kim
Myung-Hee Kwon
Sang Nae Cho
Rita Song
The Graduate School, Ajou University
December, 23rd, 2010
- ABSTRACT -
Development of Nanoprobes for the Biological Imaging Using
Positive Charged Quantum Dots and Upconversion
Nanoparticles
Nanoparticles (NPs) have unique physicochemical properties due to the quantum confinement effect. Semiconductor quantum dots (QDs) or upconversion nanoparticles (UCNPs) exhibit interesting properties such as high photoluminescence, photostability, dual magnetic/optical modality. In this study, biocompatible and stable NPs were developed through the various surface modifications. NPs were functionalized by its conjugation with various molecules including antibody for detection of kappa opioid receptor, small peptide for detection of integrin ανβ3 and oligonucleotides for the detection of influenza virus. These
functionalized NPs were useful to visualize the endocytosis of kappa opioid receptor in live cell, to acquire in vivo imaging of tumor expressing integrin ανβ3 in mice, and to detect
sequence-specific oligonucleotides. These results show the potential of these nanoprobes to apply for the drug screening and in vivo multiplex imaging.
Key words: QD, UCNP, kappa opioid receptor, integrin ανβ3, influenza virus, endocytosis,
TABLE OF CONTENTS
ABSTRACT ··· ⅰ TABLE OF CONTENTS ··· ⅱ LIST OF FIGURES ···ⅴ LIST OF TABLES ···ⅸ . Ⅰ INTRODUCTION ···1A. Surface modification of Quantum Dots (QDs)···2
1. Pegylated amine functionalized QD ···3
2. QD-DNA sensor based on FRET ···3
B. Application of QD for the target protein detection ···5
1. QD labeled kappa opioid receptor and drug induced endocytosis···5
2. Application of nanoprobes to drug screening method ···7
C. Development of multimodal imaging nanoprobe ···8
1. Development of nanoprobes for in vivo tumor targeting ···8
2. Multi-imaging modality of UCNP···8
. Ⅱ MATERIALS AND METHODS ···9
A. MATERIALS ···9
1. CdSe/ZnS QDs synthesis and surface modification with various ligands and polymer···9
2. Positively charged QD and oligonucleotide complex as a target DNA sensing material ···9
4. Cyclo RGD conjugated UCNP and integrin ανβ3 binding experiment···11
B. METHODS···12
1. Nanoparticle synthesis and surface modification ···12
2. Preparation of QD-antibody conjugates and GPCR targeting···17
3. UCNP-cRGD peptide conjugates and in vivo tumor targeting···19
4. General characterization methods ···23
. Ⅲ RESULTS···25
A. Nanoparticle synthesis and surface modification ···25
1. Synthesis of CdSe/ZnS QDs and polymer coating ···25
2. Characterization of DEDEA ligand exchanged QD and pegylation···26
3. Complex formation of cationic QD with single-stranded oligonucleotides ····31
4. Preparation of FRET-based QD-DNA probes···34
5. FRET efficiency of the QD-DNA complexes ···35
6. Detection of target oligonucleotides ···36
B. Nanoparticles functionalized with biomolecules for in vitro protein imaging ···39
1. Amine functionalization of QD ···39
2. Preparation of QD-anti-HA antibody conjugates ···40
3. Specific binding of QD-anti-HA antibody conjugates to κ-OR ···42
4. Endocytosis of QD labeled κ-opioid receptor by agonist ···43
5. Real time tracking of κ-opioid receptor internalization ···44
6. Endocytosis of κ-OR dependent on its specific agonist···45
8. The concentration-dependent effect of κ-OR agonist is visualized using
QD-anti-HA antibody conjugates ···47
C. Nanomaterials for deep tissue and in vivo imaging study ···48
1. Cyclo RGD peptide-conjugated UCNPs···48
2. UCNP-(cRGD)2 bound to U87MG cells highly expressing integrin ανβ3···49
3. T1 weighted MR/micro PET images of mouse bearing U87MG glioma···51
4. Visualization of UCNP in tumor tissue···55
. Ⅳ DISCUSSION ···57
A. Pegylated DEDEA-QD and application to production of the QD-DNA probe···57
B. QD-antibody conjugates for κ-ORs targeting and application to drug screening method ···58
C. Synthesis of UCNP-(cRGD)2 conjugates and in vivo tumor imaging···59
. CONCLUSION ···61
REFERENCES ···63
LIST OF FIGURES
Fig. 1. Synthesis of 6, 8-dimercapto octanoic acid-2, 2’-(ethylenedioxy) bis
(ethylamine)···13
Fig. 2. DEDEA ligand modified QD and PEG conjugation ···15
Fig. 3. Synthesis of polymer coated CdSe/ZnS QD ···16
Fig. 4. Synthesis of QD-anti-HA antibody conjugates ···18
Fig. 5. Synthesis of UCNP-(cRGD)2 conjugates by using EDC coupling method···20
Fig. 6. Iodination of tyrosine residues of protein by iodosulfonamide modified beads···20
Fig. 7. Absorption/emission spectra of CdSe and CdSe/ZnS QDs···25
Fig. 8. UV and PL spectra and TEM images of three different sized QDs···26
Fig. 10. Electrophoretic mobility of pegylated QDs and fluorescence images
of QDs in TFA solution···29
Fig. 11. Stability test of QDs and PL spectra···30
Fig. 12. Hydrodynamic size measured by dynamic light scattering (DLS) ···30
Fig. 13. Endocytosis of pegylated DEDEA-QDs by HeLa cells···31
Fig. 14. FRET between 5’-Cy5 labeled 17-mer oligonucleotides (p17a) and AET-ligand exchanged QD605 in the QD-DNA complex···33
Fig. 15. Fluorescence spectra of QD530-DNA (p25) and PL intensity of p25···34
Fig. 16. Dynamic light scattering analysis of QD530-DNA complexes prepared at various molar ratios of TAMRA-DNA (p25) to QD530···35
Fig. 17. FRET efficiency of the QD530-DNA complexes at the various molar ratios of DNA (p25) to QD (1 ~ 10)···36
Fig. 19. Fluorescence recovery of QD by DNA and sequence-specific
detection of 25-mer target DNA ···38
Fig. 20. PL spectra of QD-DNA probes targeting 100-mer target DNA derived from H5N1 influenza virus ···39
Fig. 21. Gel electrophoretic mobility of QDs ···40
Fig. 22. QD-anti-HA antibody conjugates using LC-SPDP and sulfo-SMCC (A) and gel electrophoresis (B) ···41
Fig. 23. HA-tagged κ-opioid receptors in U2OS cells were detected with QD-anti-HA antibody conjugates ···42
Fig. 24. Agonist (U69593) induced κ-opioid receptor endocytosis ···43
Fig. 25. Real time images of U2OS cell after U69593 agonist treatment ···44
Fig. 26. Internalization of κ-ORs and A3ARs by stimulation of their agonists ···45
Fig. 27. Blocking experiment of κ-OR endocytosis ···46
Fig. 29. Gel electrophoretic mobility of UCNP-(cRGD)2 conjugates ···49
Fig. 30. Fluorescence image of UCNP-(cRGD)2 treated into the U87MG cell ···50
Fig. 31. MR T1 weighted images of 124I-(cRGD)
2-UCNP in U87MG
xenograft model ···52
Fig. 32. PET images of 124I-(cRGD)2-UCNP in U87MG xenograft mice ···54
LIST OF TABLES
Table 1. Oligonucleotides used in this study···10
Table 2. Dissociation of electrostatically bound DNA (p18) with the increase of pH···32
Table 3. Hydrodynamic size and zeta-potential of amine functionalized QD···40
. INTRODUCTION
Ⅰ
Nanoparticles smaller than 100 nanometers, containing 20 – 15,000 of atoms, which exhibit unique optical and electrical properties, can be widely used to biological and medical applications such as fluorescent biological labeling, drug and gene delivery, detection of proteins, MRI contrast enhancement (Weissleder, et al., 1990; Bruchez, et al., 1998; Chan and Nie, 1998; Wang, et al., 2002; Nam, et al., 2003; Medintz, et al., 2005).
The synthesis of nanoparticles has been greatly progressed during the past two decades using organometallic precursors at high temperature to obtain monodisperse and highly luminescent nanomaterials, especially in the case of CdSe/ZnS core/shell quantum dots (QDs) (Murray, et al., 1993; Dabbousi, et al., 1997; Thunemann, et al., 2006). The unique optical properties of QDs make them appealing as in vivo and in vitro fluorophores in a variety of biological investigation, in which traditional fluorescent labels based on organic molecules fail to provide long-term stability and simultaneous detection of multiple signals (Michalet, et al., 2005).
Recently, upconversion nanoparticles (UCNPs) also have been reported for their application for in vivo imaging using their unique optical properties (Xiong, et al., 2010; Zhou, et al., 2010). Compared to organic fluorophores, UCNPs exhibit high photochemical stability, sharp emission bandwidths, and large anti-stokes shifts. In addition, high penetration depth and absence of autofluorescence due to the excitation of near infrared (NIR) source make them ideal materials for biological labeling and in vivo imaging. Especially, NaGdF4 UCNP doped with Yb3+ and RE3+ (RE = Er or Tm) having dual-modality
2009; Vetrone, et al., 2009).
In this study, we focused on the preparation of nanoparticles functionalized with a lot of molecules including PEG, target specific peptides, antibodies and oligonucleotides. We then applied these nanoprobes to several model systems and confirmed that the functional molecules retained their original binding, recognizing or targeting properties.
A. Surface modification of Quantum Dots (QDs)
The generation of water-soluble and biocompatible quantum dots (QDs), which maintain high photoluminescence (PL) and stability in turbid biological fluids still remains as a great challenge. Such approaches include the use of polymer coating, micelle formation and ligand exchange methods (Dubertret, et al., 2002; Wu, et al., 2003). Although polymer coating has been considered as a most efficient capping method because the QDs prepared by this method exhibit high stability and high photoluminescence, it is well known that these QDs are rather large in size (>10 nm) and difficult to control the size. The use of QD micelles also suffers from the same limitations and their stability is sometimes worse due to their instability under the critical micelle concentration (CMC). As a result, the fundamental studies on the, for example, Förster resonance energy transfer (FRET), a process that occurs within the range <10 nm between the donor and acceptor fluorophores, are definitely limited in QD-mediated system (Clapp, et al., 2004).
The most common laboratory method used for the preparation of small sized water-soluble QDs is ligand exchange process using a thiol-containing ligand (Gill, et al., 2005). The major drawback of this method is the decrease of quantum yield (QY) which usually drops to the range of 5 – 10 % after ligand exchange reaction. In addition, these QDs are lack
of the long-term stability and show strong quenching in acidic media (Boldt, et al., 2006). Ligand exchange using dihydrolipoic acid (DHLA) has been used to prepare relatively stable water-soluble QDs by formation of a chelate via bidentate thiol ligands (Wuister, et al., 2003; Huang and Tomalia, 2005; Uyeda, et al., 2005). However, these DHLA modified QDs also show a severe decrease in photoluminescence and the conjugation reactions with several biomolecules are sometimes unsuccessful due to the formation of aggregates. Moreover, these QDs often lead to significant non-specific binding with cell membrane. On the other hand, amine-functionalized small QDs are not easily available because of their severe aggregation in neutral solutions and the strong quenching in acidic media. Therefore, the needs to obtain aggregation-free QDs retaining their initial individual size are still strongly raised to gain access to FRET studies and to reduce non-specific binding with biomolecules.
1. Pegylated amine functionalized QD
In this study, the syntheses of water soluble QDs functionalized with amine containing multidentate ligand originated from DHLA are described and their properties and stabilities are also presented. These QDs were found to exhibit high quantum yields and remarkable stability under harsh environmental conditions, for example, even at pH 2.
2. QD-DNA sensor based on FRET
High quantum yield (QY) and tunable narrow emission band of QD highlights their potential as an excellent energy donor in FRET-based sensors (Gill, et al., 2005; Clapp, et al., 2006; Sapsford, et al., 2006). The Mattoussi group pioneered FRET sensor using dye-labelled protein-QD systems to detect proteins or small molecules (Goldman, et al., 2002;
Medintz, et al., 2005), where the increase in the fluorescence of an acceptor dye was observed upon binding with analytes. On the other hand, Dyadyusha et al. reported the use of QD-DNA probes pre-quenched with gold nanoparticles (Au NP) to detect single stranded (ss) DNA in solution (Dyadyusha, et al., 2005). In this ‘signal-off’ approach, the effective quenching of QD-DNA conjugate was achieved by hybridization of complementary Au NP-DNA conjugates.
Recently, Peng et al. demonstrated the specific detection of unlabeled nucleic acids using a cationic polymer bridge which allows for electrostatic binding of negatively charged CdTe QD with dye-labelled DNA (Peng, et al., 2007). This approach is based on the fact that the hybridized double stranded (ds) DNA becomes more rigid than ssDNA, resulting in an increase in distance between dye-labelled DNA and QD. Despite the simplicity of this strategy, the decrease in QD photoluminescence (PL) due to the instability of QD upon hybridization remains to be resolved. As an effort to overcome the instability of QD-based probes, Zhou et al. reported the synthesis of triethyleneglycol-modified QD for the detection of unlabeled DNA, which is expected to avoid strong non-specific adsorption of DNA on the QD surface (Zhou, et al., 2008). However, there still exist issues to be addressed such as low conjugation efficiency, instability due to the intrinsic limitation of conjugation method, non-specific binding and low quantum yield. In this context, we developed a compact cationic CdSe/ZnS QDs stabilized by PEG molecules, which allow us to create a novel QD-DNA probe by using a simple and stable electrostatic interaction. Unlike other FRET-based QD sensor approaches ( Dyadyusha, et al., 2005; Gill, et al., 2005), covalent immobilization by chemical reaction is not required which often causes aggregation or quenching of QD.
stability over a wide range of pH and at high salt concentration. The cationic nature of the amine functionality on the QD surface allows for the formation of an electrostatic complex with negatively charged DNAs. The fluorescence of the QD (530 nm emission) was quenched up to 90 % by complexation with the TAMRA-modified DNA without any apparent aggregation. In addition, this quenching was reversed upon the binding of target DNA. In this regard, we report preparation of compact and stable QDs, the complex formation between QD and DNA, and hybridization and target detection efficiency of the resulting QD-DNA probes. The detection of H5N1 avian influenza viral gene fragment using this sensing platform is also demonstrated.
B. Application of QD for the target protein detection
1. QD labeled kappa opioid receptor and drug induced endocytosis
Many reports have demonstrated successful conjugation of protein to the nanoparticles by using EDC or sulfo-SMCC (Pathak, et al., 2007; Walther, et al., 2008; Liu, et al., 2007). However, the conjugation efficiency, reactivity and binding affinity of the resulting conjugates varied considerably depending on the reactivity of the reagents, nanoparticles, and antibodies used. Therefore, various conjugation strategies need to be tested and optimized, considering the different reactivity of the reagents and molecular characteristics of antibodies. In addition to the EDC and SMCC for the conjugation, two different heterobifunctional linkers (LC-SPDP and SMCC) are also employed in order to obtain optimal antibody-QDs conjugates (Lee, et al., 2010).
(>1,000 members in humans) that respond to an enormous array of stimuli, including light, hormones and neurotransmitters. Opioid receptor is one of the GPCRs and it is important target for the treatment of pain. Opioid receptors are divided to mu (μ)-, delta (δ)-, and kappa (κ)-opioid receptor (OR) subtypes.
GPCR-mediated signal transduction can be attenuated with relatively fast kinetics (within seconds to minutes after agonist-induced activation) by a process called rapid desensitization. Rapid desensitization is characterized by functional uncoupling of receptors from heterotrimeric G proteins, which occurs without any detectable change in the total number of receptors present in cells or tissues (Clark, 1986). A highly conserved mechanism of rapid desensitization involves ligand-dependent phosphorylation of receptors followed by receptor interaction with cytoplasmic proteins called arrestins, which disrupt the interaction between the receptor and G protein (Lefkowitz, et al., 1998). Rapid desensitization of certain GPCRs is associated with a process called sequestration, which involves a physical redistribution of receptors from the plasma membrane to intracellular membranes. This process of GPCR internalization is thought to promote dephosphorylation of receptors by bringing them near to an endosome-associated phosphatase (Pitcher, et al., 1995). Dephosphorylation and subsequent recycling of receptors back to the plasma membrane contributes to a reversal of the desensitized state (resensitization), which is required for full recovery of cellular signaling potential following agonist withdrawal (Lefkowitz, et al., 1998).
Clinically used narcotic analgesics such as morphine act primarily through μ-OR and remain the gold standard for the treatment of severe pain, but their use is limited by serious side effects including respiratory depression and dependence liability. In an attempt to avoid
the detrimental effects of μ-OR agonists, there has been considerable interest in developing ligands for other opioid receptors as potential therapeutic agents. While δ-OR agonists can produce analgesia, they also have serious side effects and limited their therapeutic development. In contrast, new potential therapeutic applications have recently been recognized for κ-OR agonists and antagonists, sparking renewed interest in the development of ligands for this receptor (Aldrich and McLaughlin, 2009).
As proof of principle, we chose human osteosarcoma cells (U2OS) overexpressing two types of GPCR, influenza hemagglutinin (HA) peptide tagged κ-OR and green fluorescent protein (GFP) labeled A3 adenosine receptors (A3AR, control), and endocytosis process of QD labeled κ-OR activated by well known agonist (U69593) was visualized through the real time tracking.
2. Application of Nanoprobes to drug screening method
High-throughput screening (HTS) is commonly defined as automatic testing of potential drug candidates at a rate in excess of 10,000 compounds per week. The aim of high throughput drug discovery is to test large compound collections for potentially active compounds (hits) in order to allow further development of compounds for pre-clinical testing.
Most high-throughput screening is concerned with simple biochemical screening or testing the ability of chemical compounds (drugs) to interact with a given protein target. Due to the high quantity of experiments, the strategies for decreasing operation steps can offer great interest to save cost and time. In this contest, we suggest to use primary antibody conjugated nanoprobes, which allow to obtaining high quality images without secondary antibody reaction.
C. Development of multimodal imaging nanoprobe
1. Development of nanoprobes for in vivo tumor targeting
Angiogenesis is essential for tumor growth and progression, which supply oxygen and nutrients through the formation of new blood vessels from pre-existing vasculature (Buckley et al., 1999; Westlin, 2001).
Integrin ανβ3 is overexpressed on both tumor cells and tumor vasculature of many cancer
types, therefore it is an important target for in vivo imaging for diagnostic aspects and for the evaluation of novel anti-angiogenic agents (Haubner, 2006).
In this study, RGD (potent integrin ανβ3 antagonist)-containing peptides were conjugated
to UCNPs and UCNP-RGD exhibited high affinity integrin ανβ3 specific binding in cell, in
vitro, and in living mice bearing subcutaneous integrin ανβ3-positive U87MG human
glioblastoma tumors.
2. Multi-imaging modality of UCNP
Synthesis of nanomaterials with multi-imaging modality is of great importance in clinical molecular imaging and diagnostics. NaGdF4: Yb3+, Er3+ UCNPs with strong
upconversion optical properties and inherent magnetic properties were conjugated with RGD peptides and further labeled with 124I radioisotope. These Nanoprobes with multi-imaging
modality were injected into the tumor bearing mice and determined their biodistribution and targeting properties using magnetic resonance imaging (MRI) and positron emission tomography (PET). Their optical property was also investigated using home-made two photon microscope.
. MATERIALS AND METHODS
Ⅱ
A. MATERIALS
1. CdSe/ZnS QDs synthesis and surface modification with various ligands and polymer
For the synthesis of CdSe/ZnS QDs, cadmium nitrate (99.99%), sodium myristate (99%), hexamethyldisilathiane ((TMS)2S), diethylzinc (ZnEt2), trioctylphosphine (TOP, 90%),
trioctylphosphine oxide (TOPO, 99%), 1-octadecene (ODE), and selenium powder (99.9%) were purchased from Aldrich.
For the surface modification of nanoparticles, we used various ligands such as mercaptopropionic acid (MPA, 99%, Aldrich), aminoethanethiol·HCl (AET, 98%, Acros), 6, 8-dimercapto-octanoic acid (Dihydrolipoic Acid, DHLA, Aldrich) and 6, 8-dimercapto octanoic acid-2, 2’-(ethylenedioxy) bis(ethylamine) (DEDEA). And octylamine (99 %, Aldrich) modified poly (acrylic acid) (PAA, M.W. 1800, Aldrich) was prepared for the capping material of QD surface. And for the further optimized condition of QD stability, we used various PEG such as methoxy polyethylene glycol-succinimidyl succinate (M. W. 2000 and 5000, Sunbio) and diamino-PEG molecules.
2. Positively charged QD and oligonucleotide complex as a target DNA sensing material
We prepared the DEDEA modified QD530 (PL max = 530 nm) and QD605 (PL max = 605
this study, were obtained from Bioneer Inc. (Daejon, Korea) after PAGE purification and characterization by MALDI-TOF (Table 1).
Table 1. Oligonucleotides used in this study
[a] Italicized DNA bases are complementary or non-complementary with the p25 probe. [b] The number of base pair.
3. Anti-HA antibody conjugated QDs and κ-OR targeting
2, 2’-(ethylenedioxy) bis-(ethylamine),
N-(3-dimethylaminopropyl)-N’-ethylcarbodiimide hydrochloride (EDC), and dithiothreitol (DTT) were purchased from Sigma. Sulfosuccinimidyl 6-[3´(2-pyridyldithio)-propionamido]hexanoate (Sulfo-LC-SPDP) and sulfosuccinimidyl-trans-4-(N-maleimidomethyl)cyclohexane-1-carboxylate (Sulfo-SMCC) were purchased from Pierce. O, O’-bis(2-aminoethyl) octadecaethylene glycol was purchased from Fluka and polyethyleneglycol (PEG) diamines (Mw = 2000 and 5000) were
obtained from SunBio. Dulbecco’s modification of Eagle’s medium (DMEM), Roswell Park Memorial Institute (RPMI), fetal bovine serum, penicillin-streptomycin, and phosphate buffered saline (PBS, pH 7.4) were obtained by Gibco. Anti-HA antibody (MMS-101R, clone 16B12, mouse mAb) was purchased from Covance. And (+)-(5α,7α,8β)-N-methyl-N-[7-(1-pyrrolidinyl)-1-oxaspiro[4.5]dec-8-yl]-benzeneacetamide (U69593, κ-opioid receptor agonist), N6-(3-iodobenzyl) adenosine-5′-N-methyluronamide (IB-MECA, adenosine A3 receptor agonist), chlorpromazine (clathrin inhibitor), and filipin complex (caveolin-1 inhibitor) were obtained by Sigma. U2OS cells overexpressing GFP labeled A3 adenosine receptors (A3AR) and influenza hemagglutinin peptide (HA) tagged κ-opioid receptors (κ-OR) were provided by discovery biology group in Institut Pasteur Korea.
4. Cyclo RGD conjugated UCNP and integrin ανβ3 binding experiment
Cyclo RGD peptides (H-Glu(Arg-Gly-Asp-D-Tyr-Lys)2, Peptides International) was
used for in vivo tumor targeting material. And human glioblastoma cell line (U87MG) was provided by KIRAMS (Korea Institute of Radiological & Medical Sciences).
B. METHODS
1. Nanoparticle synthesis and surface modification
(A) Synthesis of TOPO-capped CdSe/ZnS QDs
Selenium powder and cadmium precursors were added into a 50 mL three-neck flask with ODE (20.0 g). The mixture was degassed for 10 min under vacuum at room temperature. Under Ar flow, the solution was stirred and heated to the reaction temperature (300 °C). After the reaction had terminated, a solution of oleic acid in ODE (0.05 M, 2.5 mL) was added dropwise into the reaction solution to stabilize the growth of nanocrystals. The solution was cooled down to room temperature. To prepare ZnS shell-coated QDs, CdSe nanocrystals were mixed with 2 g of TOPO and 2 g of hexadecylamine (HDA), and chloroform was evaporated completely. The solution was heated to 170 °C in Ar atmosphere. A capping solution containing 2 mL of diethylzinc (2 mL) and 400 mL of hexamethyldisilathiane [(TMS)2S] and 10 mL of trioctylphosphine (TOP) were added slowly
to the reaction flask for 3 hr, after which the solution was cooled down to room temperature. Finally, the solution was filtered through a 0.2 μm pore size polypropylene syringe filter.
(B) Synthesis of DEDEA ligand
The capping ligand 3 [DEDEA; 6, 8-dimercapto octanoic Acid-2,2’-(ethylenedioxy) bis(ethylamine)] was synthesized from the pentafluorophenol-activated thioctic acid 1, using 2,2’-(ethylenedioxy)bis(ethylamine) as a hydrophilic linker bearing the amine functionality.
And this ligand 3 was made as a trifluoroacetate (TFA) salt 4 to confer water-solubility (Fig. 1). S S OH O NaBH4 NaHCO3 84% DMF, Et3N DCC 76% S S O O F F F F F S S O N H O O NH2 SH SH O N H O O NH2 DMSO TFA SH SH O N H O O NH3 CF3CO2 H2N O O NH 2 1 2 3 4 PFP
Fig. 1. Synthesis of 6,8-dimercapto octanoic Acid-2,2’-(ethylenedioxy) bis(ethylamine).
(C) Synthesis of octylamine-modified poly (acrylic acid)
Poly (acrylic acid) (PAA, 3.6 g; M.W. 1800, Aldrich) and EDC (2.3 g) were transferred into a 100 mL round-bottom flask. 40 mL of DMF was added to dissolve the mixture. About 1.2 mL of octylamine (99 %, Aldrich) was added dropwise into the reaction flask. When the reaction was complete, DMF was removed by evaporator, and the residue was mixed with 10 mL of acetone and transferred into a centrifuge tube. 40 mL of water was added, and the gummy precipitated product was separated by centrifugation (3000 rpm for 10 min) and washed thoroughly with water. The amount of octylamine conjugation was ~ 15 % as determined by NMR analysis
(D) Water soluble QD preparation by ligand exchange process
To 100 mL of hydrophobic CdSe/ZnS QD dissolved in 2 mL chloroform 0.05 M methanoic solution of ligands (dihydrolipoic acid, 3-mercaptopropionic acid, DEDEA, 2-aminoethanethiol, etc) was added until the particles flocculated. After the flocculation, QDs were spined down by centrifuge and supernatant was removed. After washing several times with methanol to remove the excess ligands, QDs then were suspended in deionized water and filtered using a 0.2 μm syringe filter.
(E) Pegylation of DEDEA modified QDs
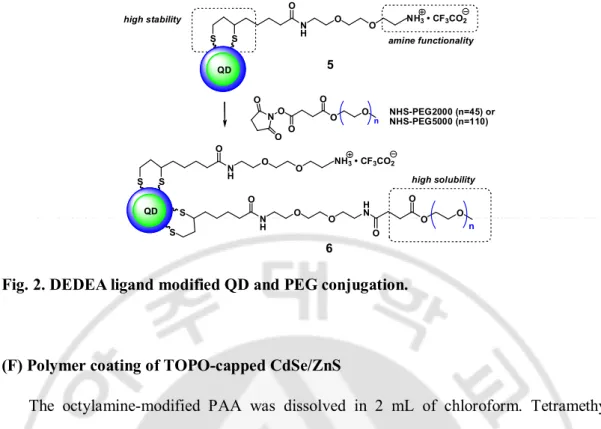
QDs modified by DEDEA ligand were further modified by reacting with poly(ethylene glycols) (PEG) to increase their stability in various aqueous media. Different amounts of N-hydroxysuccimide (NHS) activated PEG2000 and 5000 were reacted with QDs 5 to form stable amide bond. Ratio of QD and PEG was variable from 1:10 to 1:500. After conjugation reaction for 3 h, excess PEG was removed by 30 K centricon. And these reactions were analyzed by gel electrophoresis (Fig. 2).
N H O O O H N S S high stability 5 S S N H O O O amine functionality 6 NHS-PEG2000 (n=45) or NHS-PEG5000 (n=110) QD S S N H O O O QD O O O O n NH3 • CF3CO2 high solubility NH3 • CF3CO2 NO O O O O O O n
Fig. 2. DEDEA ligand modified QD and PEG conjugation.
(F) Polymer coating of TOPO-capped CdSe/ZnS
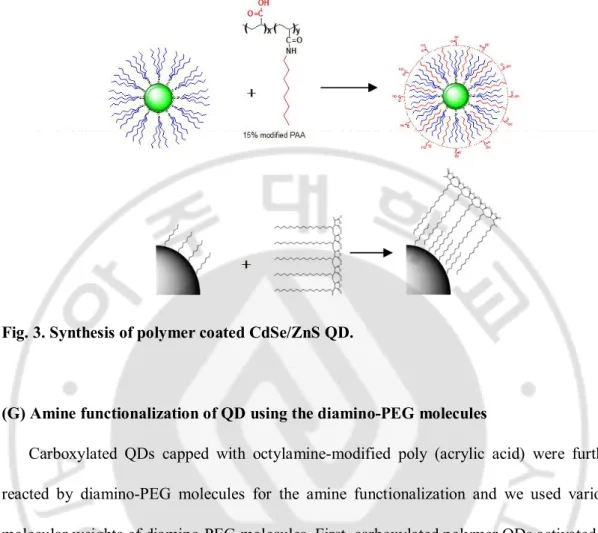
The octylamine-modified PAA was dissolved in 2 mL of chloroform. Tetramethyl-ammonium hydroxide was added to the polymer solution to raise the pH of the solution up to 10. The polymer solution was added to 5 mL of chloroform in a 20 mL round bottom flask and the solution was stirred for 1 min to ensure complete admixture of the polymer solution. With continued stirring, CdSe/ZnS QD solution was added dropwise to the polymer solution. The mixed solution was then stirred for two minutes to ensure the complete homogeneous solution and then the chloroform was removed in vacuo with a slight heating to yield a thin film of the particle-polymer complex on the wall of the flask. 5 mL of distilled water was added to the flask and swirled along the walls of the flask to disperse the particles in the aqueous medium (Fig. 3). The dispersion was then allowed to stir overnight at room temperature. Finally, the solution was centrifuged (4,000 g, 15 min) to remove aggregates and filtered through a 0.2 μm pore size PVDF syringe filter. The resulting polymer-coated QDs in water were characterized by fluorescence spectrometer, transmission electron
microscope (TEM), gel permeation chromatography (GPC), agarose gel electrophoresis, and dynamic light scattering (DLS) method.
Fig. 3. Synthesis of polymer coated CdSe/ZnS QD.
(G) Amine functionalization of QD using the diamino-PEG molecules
Carboxylated QDs capped with octylamine-modified poly (acrylic acid) were further reacted by diamino-PEG molecules for the amine functionalization and we used various molecular weights of diamino-PEG molecules. First, carboxylated polymer QDs activated by EDC (1,000 equivalent of QD) were dropwised to the diamino-PEG solution (approximately 10,000 excess of QD amount). And after incubation for 3 h, amine functionalized QD were purified by size exclusion column (Sephadex G-25) for removal of unreacted diamino-PEG molecules. And we confirmed the pegylated amine functionalized QD by using the gel electrophoresis and dynamic light scattering.
2. Preparation of QD-antibody conjugates and GPCR targeting (A) Synthesis of QD-anti-HA antibody conjugates
Fig. 4 shows the synthetic process of QD-anti-HA antibody conjugates. Amine functionalized QDs (200 μL of 0.5 μM) 2 reacted with 1,000 equivalents of sulfo-LC-SPDP. And then, DTT (1 μL of 1 M) was added to the solution under nitrogen flow to reduce the disulfide bond of LC-SPDP modified QDs 3. After 3 hr of the reaction at room temperature, the excess of sulfo-LC-SPDP was removed using a NAP-5 desalting column pre-equilibrated with a conjugation buffer (1x PBS, pH 7.4). At the same time, anti-HA antibody 5 (200 μL of 0.2 mg/mL) was activated by 1000 equivalent of sulfo-SMCC to give SMCC activated antibody 6. After 30 min of the reaction, the excess of sulfo-SMCC was removed by membrane filtration (MWCO, 30 kDa). Finally, the LC-SPDP modified QD 4 and the SMCC activated anti-HA antibody 6 were mixed and incubated at room temperature for 3 h. This reaction mixture was purified by removing the unreacted antibodies using a Superdex®200 size exclusion column. The final concentration of the resulting QD-anti-HA antibody conjugates 7 was determined by measuring the absorbance using a reported extinction coefficient (ε, 1.7x10⁷ M-1cm -1) of the QD (Yu, et al., 2003).
Fig. 4. Synthesis of QD-anti-HA antibody conjugates. Carboxylated polymer-coated QDs 7 were modified to amine functionalized QDs 8 by reacting with diamino-PEG (M.W. 5,000) and EDC; Amine-functionalized QDs were produced by reacting with diamino-PEG
molecules (a) and first activated with sulfo-LC-SPDP (b) and thiolated by a reducing reagent, DTT (c). At the same time, the anti-HA antibody 11 was activated by sulfo-SMCC (d). After mixing two solutions, QD-anti-HA antibody conjugates 13 were produced (e).
(B) Cell culture
U87MG cells were grown in Dulbeco’s modified Eagle’s medium (DMEM) with 10 % heat-inactivated fetal bovine serum (FBS) and 0.5 % penicillin (100 units/mL)–streptomycin (100 μg/mL). And U2OS cells overexpressing A3AR and κ-OR were incubated in DMEM with 10 % FBS, 0.5 % penicillin/streptomycin, 1 % G418, and zeocin (500 μg/mL).
(C) QD labeling of κ-opioid receptor in U2OS cell and endocytosis of GPCR induced by agonists
For the confirmation of target specific effect of agonists, U69593 and IB-MECA agonists were consecutively treated into the U2OS cell. Cells were pre-incubated with QD-anti-HA antibody conjugates for 10 min. And κ-opioid receptor agonist (U69593, 10 μM) was added into the cell solution. After 30 min, A3AR agonist (IB-MECA, 1 μM) was subsequently added.
(D) Blocking experiment of endocytosis pathway
U2OS cells (15,000/well) were starved for 3 hr in serum free DMEM, and 5 μg/mL of chlorpromazine or filipin was incubated for 30 min. And then, after treatment of QD (20 nM), κ-opioid receptor agonist (U69593, 10 μM) was incubated into the cell solution for 30 min, and cells were fixed with 4 % PFA.
3. UCNP-cRGD peptide conjugates and in vivo tumor targeting
(A) Preparation of UCNP-cyclo RGD peptide conjugates
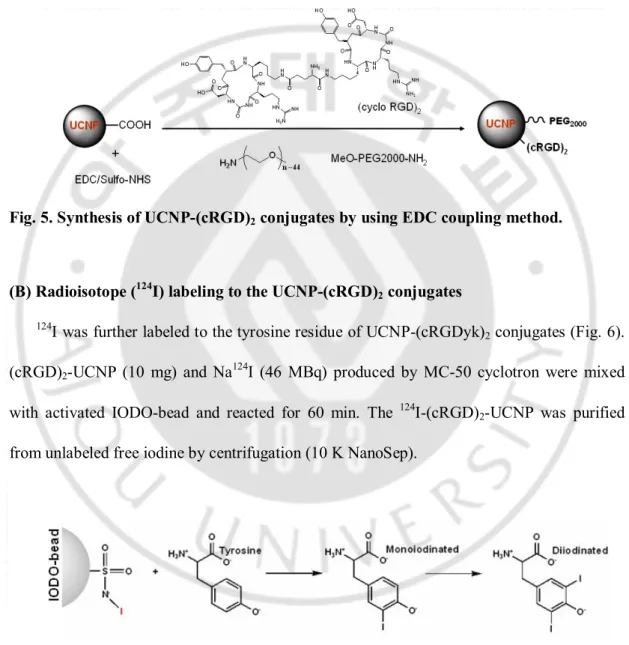
UCNP-(cRGD)2 conjugates introduced PEG were produced by EDC coupling method
(Fig. 5). Carboxylated polymer coated UCNPs (100 μL of 1 μM) were activated by EDC (1000 equivalent of nanoparticles) and sulfo-NHS (250 equivalent of nanoparticles) for 30 min. And the excess of EDC and sulfo-NHS were removed by membrane filtration (MWCO, 30 kDa). Activated carboxyl group of nanoparticle was reacted with amine moiety
containing peptide (lysine or arginine residue of (cRGD)2 and methoxypolyethylene glycol
amine (MeO-PEG2000-NH2, M.W. 2000). The mixture solution of peptide and PEG (ratio of
peptide : PEG = 1000:0, 800:200, 500:500, 200:8000, and 0:1000) was added to nanoparticle solution and incubated for 3 h. And then, unreacted (cRGD)2 and PEG were removed by
membrane filtration (MWCO, 30 kDa).
Fig. 5. Synthesis of UCNP-(cRGD)2 conjugates by using EDC coupling method.
(B) Radioisotope (124I) labeling to the UCNP-(cRGD)
2 conjugates
124I was further labeled to the tyrosine residue of UCNP-(cRGDyk)
2 conjugates (Fig. 6).
(cRGD)2-UCNP (10 mg) and Na124I (46 MBq) produced by MC-50 cyclotron were mixed
with activated IODO-bead and reacted for 60 min. The 124I-(cRGD)
2-UCNP was purified
from unlabeled free iodine by centrifugation (10 K NanoSep).
(C) Integrin ανβ3 binding of UCNP-(cRGD)2 in U87MG
U87MG cells were grown in Dulbeco’s modified Eagle’s medium (DMEM) with 10 % heat-inactivated fetal bovine serum (FBS) and 0.5 % penicillin (100 units/mL)–streptomycin (100 μg/mL) in 5 % CO2 at 37 oC. Cells were detached from cell culture dish with
trypsin-EDTA for passage. And then, cells (40,000 cells/well) were seeded in glass-bottomed 8-well chamber slide (Lab-Tek®) with 400 μL medium. After 24 h incubation at 37 oC, cells were fixed with 4 % paraformaldehyde (PFA) for 10 min. And UCNP-(cRGD)2 conjugates (final
conc. = ~190 nM) were treated into the cells in cell-binding buffer (20 mM PBS, 10 mM NaCl, 2 mM CaCl2, 1mM MnCl2, 1 mM MgCl2, 0.1 % (wt/vol) bovine serum albumin; pH
7.4). After incubation for 2 h at room temperature, cells were washed with fresh PBS buffer three times. As a control experiment, 500 µM of (cRGD)2 was pre-incubated for blocking of
integrin ανβ3 for 1 h. And fluorescence images were obtained by two-photon microscope
(excitation wavelength = 980 nm (Ti-Sapphire laser), emission filter = 540~560 nm).
(D) Animal model
Six to 8 week old athymic BALB/c mice weighing 20 to 24 g each purchased from SPF breeding colony in Orient Bio, Inc (South Korea). U87MG cells were harvested using 0.05 % trypsin-EDTA, centrifuged, and resuspended in sterile PBS as final cell concentration of 1×10⁶ per0.05 mL, which was injected into right shoulder region of mice. In vivo imaging
experiments were initiated when reached 0.8 to 1 cm in diameter. All animal experiments were conducted with approval of Institutional Animal Care and Use Committee (IACUC).
(E) In vivo MR imaging
To image tumor angiogenesis in ανβ3 expressing U87MG tumor xenograft model, 124
I-(cRGD)2-UCNPs (1.66 MBq/2 mg) and 124I-(cRGD)2-UCNPs (1.66 MBq/2 mg) plus a
blocking dose of c(RGDyk) (10 mg/Kg) were injected intravenously via a tail vein of U87MG tumor bearing mice. An MRI scan was performed using a 3 T Siemens Magnetom Trio with a wrist coil, using a T1-weighted sequence (TR = 637 ms, TE = 12 ms, flip angle = 180, 256×152 matrix, slice thickness = 1.0 mm) at before, 30 min, 1 h and 4 h post injection. MRI coronal and transversal cross section images were obtained for each animal. Signal intensities were measured in defined region-of-interests (ROIs), which were in similar locations within tumor center, using Siemens’ Syngo software (Siemens Medical Systems, USA).
(F) In vivo small animal PET imaging
To acquire small animal PET images of 124I-(cRGD)
2-UCNPs and 124I-(cRGD)2-UCNPs
plus a blocking dose of c(RGDyk) in U87MG tumor model, PET studies were done with a small animal PET system (InveonTM, Siemens Medical Systems, USA). The small animal
PET scan was acquired immediately after MR imaging. The mice were scanned for 60 min static image. PET data were carried out in list mode acquisition and subsequently histogrammed in a single frame. Images were reconstructed in 2D ordered subset expectation maximization (OSEM) and ramp filter algorithms supplied by Inveon Acquisition Workplace (IAW) software. Image visualization was performed using Inveon Research Workplace (IRW) software. Small animal PET images were presented as the percentage injected dose per gram (% ID/g), which was calculated as follows: % ID/g = ROI activity
divided by injected dose.
(G) Tissue analysis by using inductively coupled plasma-mass spectrometry (ICP-MS) and bio-transmission emission microscopy (Bio-TEM).
The U87MG tumor bearing mice were sacrificed immediately after the completion of PET scan. Determination of Gd3+ content in liver and tumor was performed by ICP-MS
analysis (ELAN6100 DRC, PerkinElmer, KIST). Tissues were dissolved in HNO3 and data
was presented as mean of injected UCNPs.
The nanoparticles embedding in tissue were also confirmed by Bio-Transmission Emission Microcopy (TEM) analysis (Tecnai G2 Spirit, PEI, in KBSI). Tissues were immerged in liquid nitrogen and sectionalized of 1 µm thickness using crystat. And samples were stained with 3 % uranyl acetate for 20 min and lead citrate for 15 min.
4. General characterization methods
All absorption spectra were obtained in a quartz cuvette using Cary 5000 UV-Vis spectrometer (Varian Inc., California, USA) with a spectral range of 200–800 nm, a scan rate of 600 nm/min and a slit width of 2 nm. Photoluminescence was measured by a Fluorolog® -3 spectrofluorimeter (HORIBA, Jobin Yvon, UK) with excitation at 480 nm at an integration time of 0.1 s and an excitation and emission slit width of 1 nm. Agarose gel electrophoresis was performed in 1% agarose in 0.5x tris-borate EDTA buffer (pH 8.0) at 50 V/cm for 40 min. The resulting gel image was obtained on LAS 3000 gel imager (Fuji, Japan). For identification of antibodies, the gel was post-stained with Colloidal Blue® solution (Invitrogen, California, USA). The number of antibodies per QDs was determined by BCA
protein assay, following the protocol suggested by the supplier (Thermo, New Hampshire, USA). For the hydrodynamic size measurement of the QD-antibody conjugates, dynamic light scattering (DLS) analysis was performed using Nano-ZS (Malvern, UK) at room temperature.
.
Ⅲ
RESULTS
A. Nanoparticle synthesis and surface modification
1. Synthesis of CdSe/ZnS QDs and polymer coating
After synthesis of CdSe core and CdSe/ZnS core-shell nanoparticles, their optical properties were evaluated by spectroscopic method. Fig. 7 shows the absorption/emission spectra of CdSe and CdSe/ZnS dots. We observed a red shift in spectra after ZnS shell formation due to partial leakage of the exciton into the ZnS matrix. This red shift was more pronounced in smaller dots where the leakage of the exciton into the ZnS shell had a more dramatic effect on the confinement energies of the charge carriers. Quantum yield after ZnS shell formation was remarkably enhanced. This result is consistent with the removal of most of the core/shell interface defects (e.g., dangling bonds) to be expected from epitaxial growth and also with the growth of a defect free shell.
Fig. 7. Absorption/emission spectra of CdSe and CdSe/ZnS QDs. NPs of same concentration (2 μM in chloroform solution) were tested using Cary 5000 UV-Vis spectrometer (Varian Inc., California, USA) and Fluorolog® -3 spectrofluorimeter (HORIBA, Jobin Yvon, UK)
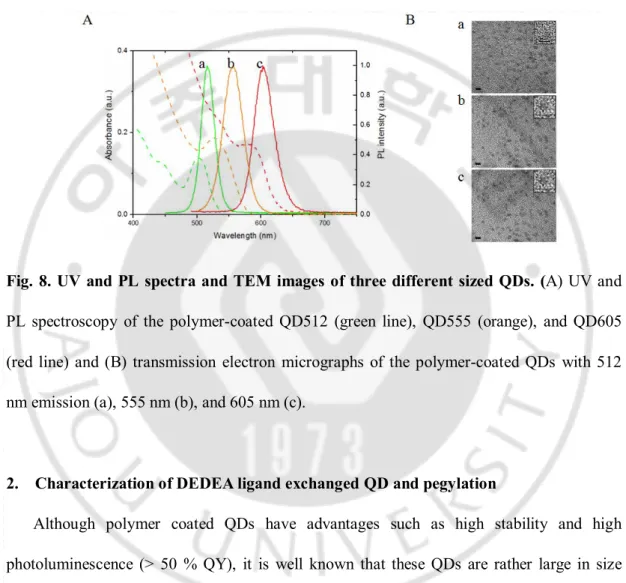
Different sizes of CdSe/ZnS QDs (green, orange, or red fluorescent QDs) produced by temperature control were coated with octylamine-modified PAA through the polymer coating process. The resulting polymer-coated QDs in water were characterized by fluorescence spectrometer and transmission electron microscope (TEM) (Fig. 8 A and B).
Fig. 8. UV and PL spectra and TEM images of three different sized QDs. (A) UV and PL spectroscopy of the polymer-coated QD512 (green line), QD555 (orange), and QD605 (red line) and (B) transmission electron micrographs of the polymer-coated QDs with 512 nm emission (a), 555 nm (b), and 605 nm (c).
2. Characterization of DEDEA ligand exchanged QD and pegylation
Although polymer coated QDs have advantages such as high stability and high photoluminescence (> 50 % QY), it is well known that these QDs are rather large in size (>10 nm). So we modified QD surface with small ligand molecule, especially newly designed DEDEA ligand.
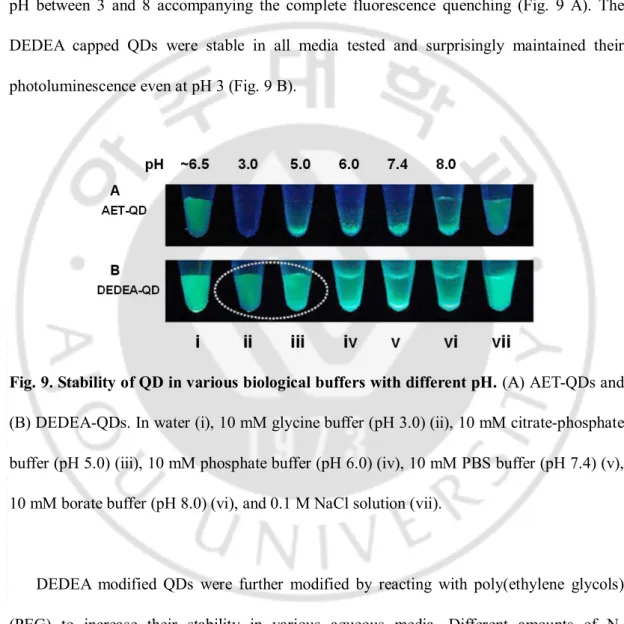
Using the same reaction conditions, the QY of aminoethanethiol (AET) capped QDs, previously reported amine-functionalized QD, was reported to be below 10 % of original value. The stabilities of these two water-soluble QDs were compared under the same conditions. The differences were clearly demonstrated after 24 h as shown in Fig. 9. All AET capped QDs were only stable in distilled water (pH ~6.5), precipitated at various buffers of pH between 3 and 8 accompanying the complete fluorescence quenching (Fig. 9 A). The DEDEA capped QDs were stable in all media tested and surprisingly maintained their photoluminescence even at pH 3 (Fig. 9 B).
Fig. 9. Stability of QD in various biological buffers with different pH. (A) AET-QDs and (B) DEDEA-QDs. In water (i), 10 mM glycine buffer (pH 3.0) (ii), 10 mM citrate-phosphate buffer (pH 5.0) (iii), 10 mM phosphate buffer (pH 6.0) (iv), 10 mM PBS buffer (pH 7.4) (v), 10 mM borate buffer (pH 8.0) (vi), and 0.1 M NaCl solution (vii).
DEDEA modified QDs were further modified by reacting with poly(ethylene glycols) (PEG) to increase their stability in various aqueous media. Different amounts of N-hydroxysuccimide (NHS) activated PEG2000 and 5000 were reacted with DEDEA modified QDs to form stable amide bond. Pegylated DEDEA modified QDs (reacted with ~500
equivalent of PEG5000) exhibited persistent stability in 50 mM borate buffer solution (pH 8.5) (Data not shown).
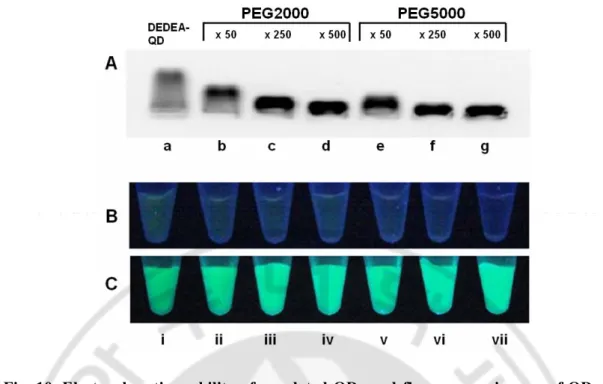
Fig. 10 A clearly shows the different migration profiles of the pegylated QDs depending on the PEG molecular weight and conjugation ratios. The DEDEA capped QDs (lane a) have maximum positive charges. The higher the PEG reaction ratio, the greater is the importance of the charge coverage for becoming neutral, which results in the delayed moving of the conjugates. And the coverage of the charges on the QDs conjugated with PEG 5000 was demonstrated to be greater than those with PEG 2000.
Pegylated DEDEA-QDs (QD:PEG5000 =1:500) are fairly stable and well dispersed without any trace of aggregates even in trifluoroacetic acid solution (Fig. 10 ⅶ). In this condition, the fluorescence of AET- and pegylated AET-QDs, respectively was completely quenched (Fig. 10 B). QDs pegylated with 500 equivalent of PEG 5000 were remarkably stable over the range of pH tested (pH 2 ~ 9). All pegylated QDs bearing the DEDEA ligand showed good stability in both HCl and TFA aqueous solutions (pH ~2). However, these QDs, with the exception of the 500 equivalent of PEG5000 conjugated case, showed a little tendency to precipitate after 24 h at pH 8.5.
Fig. 10. Electrophoretic mobility of pegylated QDs and fluorescence images of QDs in TFA solution. (A) Gel images of QDs. DEDEA modified QDs (a), DEDEA-PEG2000 QDs (QD:PEG2000, 1:50 (b), 1:250 (c), 1:500 (d)), and DEDEA-PEG5000 QDs (QD:PEG5000, 1:50 (e), 1:250 (f), 1:500 (g)). Fluorescence images of AET-QDs (B) and DEDEA-QDs (C). QDs (i), QD:PEG2000 (1:50 (ii), 1:250 (iii) , 1:500 (iv)) and QD:PEG5000 (1:50 (v), 1:250 (vi), 1:500 (vii)) in trifluoroacetic acid (TFA) solution.
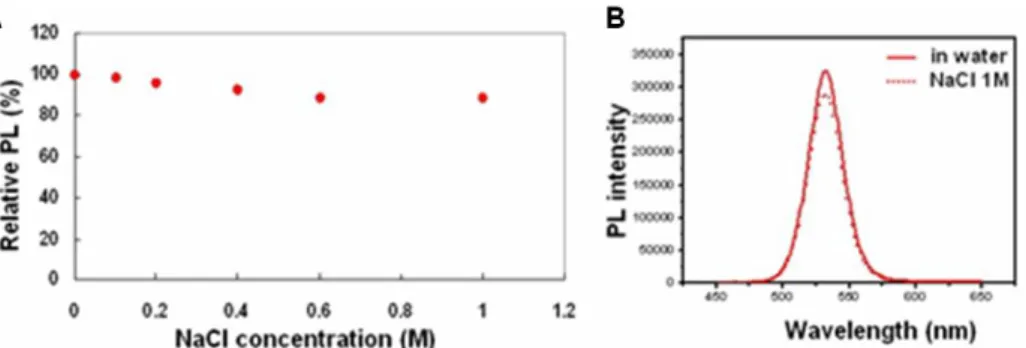
The photoluminescence (PL) properties of two sets of QDs dispersed in water were monitored with increasing concentration of NaCl from 0 to 1 M. Over the concentration range of NaCl used, little or no change in the PL intensity was observed (Fig. 11).
Fig. 11. Stability test of QDs and PL spectra. (A) PL of pegylated DEDEA-QD (QD:PEG5000 = 1:500) in different concentration of NaCl solution, (B) Fluorescence spectra of QD in water and 1 M NaCl.
Hydrodynamic sizes of DEDEA-QD and pegylated DEDEA-QD (QD:PEG5000 = 1:500) were also measured by using dynamic light scattering (DLS). In the case of DEDEA-QD, their size was 4.8 ± 1.2 nm and pegylated DEDEA-QD was 6.2 ± 1.5 nm, respectively.
.
Fig. 12. Hydrodynamic size measured by dynamic light scattering (DLS). Hydrodynamic size of DEDEA-QD was 4.8 ± 1.2 nm (A) and pegylated DEDEA-QD (QD:PEG = 1:500) was 6.2 ± 1.5 nm (B), respectively. DLS analysis was performed using Nano-ZS (Malvern, UK) at room temperature.
The positive charged nanoparticles have been known to facilitate the penetration into the cell (Song, et. al., 2005). The penetration efficiency of pegylated DEDEA-QDs into HeLa cells was also evaluated. Fig. 13 shows remarkable penetration efficiency of pegylated DEDEA-QDs into the cells. Endocytosis of pegylated DEDEA-QDs occurred quickly within 30 min (Fig. 13 A). In contrast, most carboxylated DHLA-QDs bound to cytoplasmic membranes (Fig. 13 B) and DEDEA-QDs without PEG showed the strong tendency of aggregation in the cell culture media (Fig. 13 C).
Fig. 13. Endocytosis of pegylated DEDEA-QDs by HeLa cells. Cells were incubated with (A) PEGylated DEDEA-QDs, (B) DHLA-QDs, and (C) DEDEA-QDs without PEG. HeLa cells (2 x 10⁴/ well, 96 well plate) were incubated with the indicated QDs (1 μM) for 30 min.
After washing with PBS, cells were further labeled with DAPI and images were obtained under confocal microscope (x 63 oil immersion lens, LSM 5 LIVE, Carl Zeiss, Germany).
3. Complex formation of cationic QD with single-stranded oligonucleotides
The binding and dissociation of 18-mer oligonucleotide (p18; Table 1) onto the surface of the amine-functionalized QD605 (PLmax = 605 nm) dependent on the pH is summarized in
Table 2. The adsorption was very strong in TE buffer at pH 7, where most amine groups on QD605 surface should be protonated because the pKa for alkyl ammonium group has been known as approximately »10. At pH 7, cationic QD605 was incubated with 20 molar excess of DNA for 3 hr. Free DNA filtered by 10 K membrane filter was quantified with OliGreen reagent and the number of DNA per QD was calculated to be 17. Given the nature of the electrostatic interaction, the number of oligonucleotide per QD605 should be controlled by changing pH. As the concentration of NaOH increases from 2.5 mM (pH 8.5) to 50 mM (pH 12.5), the number of oligonucleotides per QD605 was decreased from 12 to 6.
Table 2. Dissociation of electrostatically bound DNA (p18) with the increase of pH
1 μL of 5 μM amine functionalized QD was incubated with 20 equivalent of 18-mer oligonucleotides (p18, Table 1) in 100 μL of TE buffer. After 3 h of incubation at room temperature, the unreacted oligonucleotides were filtered using a membrane filter (10 k MWCO, Millipore, Massachusetts, USA), and quantified from standard curve obtained with OliGreen reagent (Invitrogen, California, USA).
To further confirm the nature of electrostatic interaction forming QD-DNA complexes, 5’-Cy5 labeled 17-mer oligonucleotides (p17a) were reacted with the QD605. FRET study between Cy5 acceptor dye and the QD605 as an energy donor was carried out for this electrostatically induced assembly. As shown in Fig 14, fluorescence of Cy5 was decreased and fluorescence of QD recovered by the increase in the concentration of NaOH used. This result indicates that the bound p17a oligonucleotide is dissociated from the complex due to the neutralization of the cationic QDs. When the concentration of NaOH increased more than 50 mM, the cisteamine-functionalized QD was aggregated in the solution.
P L i n te n si ty Wavelength (nm) 500 550 600 650 700 750 800
QD
+ + + + + + + + + + + Cy5 Ex 480nm 1 4 3 2 P L i n te n si ty Wavelength (nm) 500 550 600 650 700 750 800 P L i n te n si ty Wavelength (nm) 500 550 600 650 700 750 800QD
+ + + + + + + + + + + Cy5 Ex 480nmQD
+ + + + + + + + + + + Cy5 Ex 480nm 1 4 3 2Fig. 14. FRET between 5’-Cy5 labelled 17-mer oligonucleotides (p17a) and AET-ligand exchanged QD605 in the QD-DNA complex. 1. AET-QD605, 2. QD-DNA complex, 3. NaOH (2.5 mM) addition to the QD-DNA complex solution, 4. NaOH (5 mM) addition to the QD-DNA complex solution,
4. Preparation of FRET-based QD-DNA probes
As shown in the above experiments, it is important to develop compact and stable QD donor to make sensitive FRET-based QD sensors. We used DEDEA-PEG5000 QD530 (Lee, et al., 2008) as a donor and TAMRA for an acceptor.
Fig. 15 A shows the PL spectra of the QD-DNA complexes at various DNA/QD ratios. As the amount of bound DNA (p25) increases, the QD PL intensity at 530 nm gradually decreases down to 90 % of its original value accompanied by enhancement of TAMRA emission at 585 nm. It was confirmed that there was no significant TAMRA emission at the excitation wavelength (466 nm). Fig. 15 B shows the fluorescence of TAMRA dye excited by the FRET mechanism. This result clearly demonstrated that the surface of QD started to be saturated with 5 equivalent of DNA.
450 500 550 600 650 700 0 10000 20000 30000 40000 50000 60000 70000 80000 P L i n te n s it y Wavelength (nm) a b c d e A B 0 2 4 6 8 10 0 1000 2000 3000 4000 5000 6000 7000 E n h a n ce d T A M R A P L i n te n s it y b y d o n o r Q D ( at 5 85 n m ) TMR-25mer/QD ratio 450 500 550 600 650 700 0 10000 20000 30000 40000 50000 60000 70000 80000 P L i n te n s it y Wavelength (nm) a b c d e A B 0 2 4 6 8 10 0 1000 2000 3000 4000 5000 6000 7000 E n h a n ce d T A M R A P L i n te n s it y b y d o n o r Q D ( at 5 85 n m ) TMR-25mer/QD ratio
Fig. 15. Fluorescence spectra of QD530-DNA (p25) and PL intensity of p25. (A) Fluorescence spectra of QD530-DNA (p25) complexes at various molar ratios of DNA to QD: (a) 0, (b) 1, (c) 2, (d) 5, and (e) 10. (B) Plot of the PL intensity of TAMRA dye vs. the ratio of TAMRA/QD. The graph represents the fluorescence intensity of TAMRA dye of the QD-DNA complexes after subtracting the signal of the solution containing TAMRA dye only (Ex. 466 nm).
Fig. 16 shows the hydrodynamic size of the QD-DNA complexes with various DNA/QD ratios. The resulting QD-DNA complexes became bigger in size as the DNA molecules bound to the QD increased in number. The hydrodynamic size of the QD-DNA complexes gradually increased from 16.5 ± 0.7 nm for 1:1 complex (QD: DNA) to 20 ± 1.8 nm for 1:5 complex. These results were expected considering the hydrodynamic sizes of QD core (~15 nm) and 25-mer DNA (~2 nm in width). The size of the complexes increased until the QDs were saturated with 5 equivalent of DNA and then decreased due to the presence of the free DNA which was not bound to QDs (DLS was measured without further purification).
Molar ratio (TAMRA-DNA/QD)
H yd ro d yn am ic S iz e ( n m ) 0 5 10 15 5 10 15 20 25 2
Molar ratio (TAMRA-DNA/QD)
H yd ro d yn am ic S iz e ( n m ) 0 5 10 15 5 10 15 20 25 2
Fig. 16. Dynamic light scattering analysis of QD530-DNA complexes prepared at various molar ratios of TAMRA-DNA (p25) to QD530.
5. FRET efficiency of the QD-DNA complexes
Fig. 17 shows the decrease in PL intensities of QD in parallel with the FRET efficiency calculated from the following equation E = 1- FDA/FD, where FDA is the integrated PL
intensity of the QD in the presence of the acceptor TAMRA dye and FD is the integrated PL
intensity of the QD in the absence of the acceptor TAMRA dye. The FRET efficiency of this complex reached almost 90 % when QD was labeled with 5 dye-labeled DNA (p25). A control experiment was carried out to see whether the DNA without TAMRA label could affect the QD fluorescence. Under the same conditions used above, the quenching of the QD was less than 10 % (data not shown).
0 20000 40000 60000 80000 100000 120000 140000 160000 180000 200000 0 2 4 6 8 10 0.0 0.2 0.4 0.6 0.8 1.0 F R E T e ff ic ie n c y PL in te n s ity o f Q D (a t 5 3 0 n m ) Molar ratio (p25 / QD) 0 20000 40000 60000 80000 100000 120000 140000 160000 180000 200000 0 2 4 6 8 10 0.0 0.2 0.4 0.6 0.8 1.0 F R E T e ff ic ie n c y PL in te n s ity o f Q D (a t 5 3 0 n m ) Molar ratio (p25 / QD)
Fig. 17. FRET efficiency of the QD530-DNA complexes at the various molar ratios of DNA (p25) to QD (1 ~ 10). The quenching of QD fluorescence at 530 nm was plotted together on the right axis. FRET efficiency was calculated from the Equation (E = 1- FDA/FD).
6. Detection of target oligonucleotides
The ability of these QD-DNA complexes to detect the target DNA was tested in the presence of complementary and non-complementary DNAs (Fig. 18). The significant recovery of QD fluorescence at 530 nm (b to c) was observed in the presence of
complementary DNAs. The decreased FRET efficiency upon hybridization was confirmed by the decrease of TAMRA fluorescence at 580 nm.
Fig. 18. Detection of target DNA with QD530-DNA(p25) complexes. (A) QD PL spectra. (a) Initial QD PL without TAMRA-labelled DNA. (b) QD PL quenched upon complex formation with TAMRA-modified DNA. (c) Significant recovery of QD fluorescence at 530 nm was observed after hybridization with complementary DNA (DNA/QD molar ratio of 5). (d) A weak recovery of QD fluorescence was observed with non-complementary DNA. (B) Photograph of the corresponding QD-DNA complexes illuminated with UV lamp (340 nm). The concentration of QD and the target DNA is 100 nM and 5 μM in 1xPBS (pH 7.2), respectively.
QD-DNA complex was further utilized as a probe material for the detection of target DNA. The sequence-specific detection of target DNA in the concentration of 100 ~ 1000 nM, could be achieved using 100 nM QD-DNA (1:5) complex. Fig. 19 shows the PL recovery as a function of the concentration of target DNAs. The QD-DNA (1:5) probe showed
remarkably selective PL recovery in the presence of different target DNAs. PL recovery ratio of QD in the 1 μM of c25 was about 3 times higher than that in nc25. These results also show that the detection limit of this QD-DNA probe for 25-mer target DNA was approximately 200 nM. However, non-specific interaction of QD-DNA probe with 1- and 2- mismatch DNA exists in certain degree.
Fig. 19. Fluorescence recovery of QD by sequence-specific detection of 25-mer target DNA. The QD concentration is 100 nM. (nc25: non-complementary DNA, dm25: double-mismatched DNA, sm25: single-double-mismatched DNA, c25: complementary DNA)
Similar results were obtained for 100-mer target DNA (c100 or nc100) derived from H5N1 avian influenza virus, as shown in Fig. 20. The QD PL was recovered to almost 62 % of the initial QD PL in the presence of target DNAs. The selectivity of the detection was calculated to be 3 with 20 nM of QD-DNA probe concentration. The concentration of the
QD-DNA probe does not appear to be a critical factor for improving the sensitivity of this detection system. The present QD-DNA probes showed the capability of detecting the pathogenic DNA fragment present as low as 200 nM in the solution.\
450 500 550 600 650 700 0 1000 2000 3000 4000 5000 6000 7000 8000 9000 10000 P L in te n si ty Wavelength (nm) a b c d 450 500 550 600 650 700 0 1000 2000 3000 4000 5000 6000 7000 8000 9000 10000 P L in te n si ty Wavelength (nm) a b c d
Fig. 20. PL spectra of QD-DNA probes targeting 100-mer target DNA derived from H5N1 influenza virus. Initial QD (a), QD530-DNA complex in the presence of complementary (b) or non-complementary (c), and QD530-DNA (p25) without any target DNA (d). The QD concentration was 20 nM and the 100-mer DNAs were 200 nM.
B. Nanoparticles functionalized with biomolecules for in vitro protein imaging
1. Amine functionalization of QD
I prepared PEG conjugated QDs by reacting amino PEG5000 moiety with the polymer coated QDs to improve the solubility and stability in the biological medium. This reaction allowed introducing the amine functional groups on the QD surface.
Fig. 21 shows the electrophoretic mobility, particle size, and surface charge of nanoparticles modified by various molecular weight of diamino-PEG.
Fig. 21. Gel electrophoretic mobility of QDs. a. carboxylated polymer coated QD (control), b. QDs activated by EDC, c. QDs modified by diamino-PEG (m.w = 148), d. QD-PEG900-NH2 (m.w = 897), e. QD-PEG2000-NH2, f. QD-PEG5000-NH2.
Table 3. Hydrodynamic size and zeta-potential of amine functionalized of QD
Each sample was analyzed by using Nano-ZS (Malvern, UK) at room temperature.
2. Preparation of QD-anti-HA antibody conjugates
Fig. 22 B shows the gel electrophoresis of QD-anti-HA antibody conjugates. In gel running conditions (pH 8.5), the starting QDs barely moved on the gel because of the decreased negative charges due to the amino-PEG5000 conjugation (lane a). Sulfo-SMCC-activated anti-HA antibody (lane f) showed more negative charges than that of free anti-HA
antibody (lane e). The reaction of the sulfo LC-SPDP modified QDs with the sulfo-SMCC activated anti-HA antibody via thiol-maleimide coupling chemistry resulted in the formation of negatively charged QD-anti-HA antibody conjugates (lane c). The co-localization of QDs fluorescence and anti-HA antibody stained by Colloidal Blue® (lane c) indicated the successful attachment of QDs to the HA antibodty. The simple mixture of QDs and anti-HA antibody did not show any migration changes (lane d).
Fig. 22. QD-anti-HA antibody conjugates using sulfo-LC-SPDP and sulfo-SMCC (A) and gel electrophoresis (B). (B) Fluorescence image of QD605 (up) and simultaneous protein staining with Colloidal Blue® (down); a: QD605-PEG5000-NH2 (control), b: QD
activated by sulfo-LC-SPDP, c: QD-anti-HA antibody conjugates (by LC-SPDP and SMCC linker), d: QD and anti-HA antibody mixture, e: Anti-HA antibody, f: Anti-HA antibody activated by sulfo-SMCC, (1% agarose gel 0.5x TBE buffer (pH 8.5), 50 V/cm, 40 min.
The number of anti-HA antibody bound per QD was calculated to be ~1.4 based on the BCA protein assay with 70 % conjugation efficiency. DLS analysis also indicated that the hydrodynamic size of the QD-anti-HA antibody conjugates (18.5 ± 2.5 nm) increased compared with the starting QDs (16.2 ± 3.0 nm).