비결맞음 측정 장비를 이용한 Weak Value 측정
Weak Value Measurement with
an Incoherent Measuring Device
Hyang-Tag Lim*, Young-Wook Cho, Young-Sik Ra, and Yoon-Ho Kim POSTECH 물리학과
The weak value introduced by Aharonov, Albert, and Vaidman(AAV)(1), is quite peculiar in that the measurement outcomes of the weak value may lie outside the normal range of the eigenvalues of the measurement operator. After AAV proposed the concept of the weak value measurement, many theoretical(2) and experimental(3) studies have been done. However, most of them treated the quantum states as the pure states even though it is often not the case in reality. In this study, we report an theoretical and experimental study of weak value measurement with the mixed quantum states in an optical system.
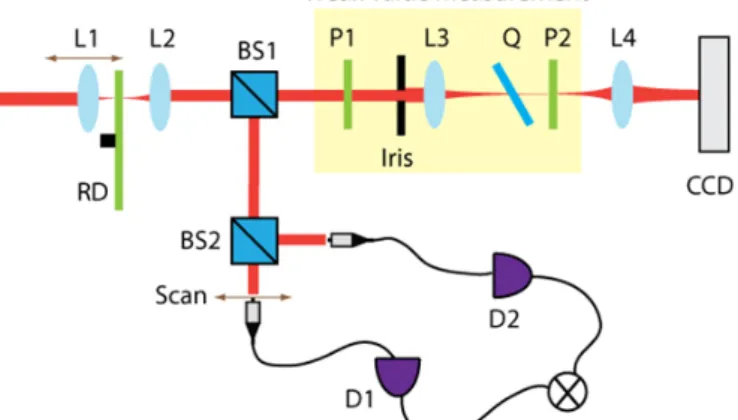
A schematic of the experimental setup is shown in Fig. 1. The weak value measurement is performed on the polarization of a photon and the pointer corresponds to the transverse position of the photon. The incoherent pointer state is realized with the pseudo-thermal light source based on scattering of a focused laser beam(He-Ne laser) at a rotating ground disk(RD). The focal length of the focusing(L1) and collimating(L2) lens are 30mm and 75mm, respectively. By changing the beam size on the rotating ground disk (i.e., by moving L1 longitudinally), we can vary the degree of spatial coherence. The beam is then split into two by a beam splitter(BS1). One beam is used for the weak value measurement, and the other beam is used for characterizing the pointer state.
To characterize the pointer states, we measured the degree of spatial coherence of the beam
Fig. 1. Experimental Setup. Right side of BS1: Weak value measurement part. Lower side of BS1: Measurement of coherence length part. A beam splitter 2 splits the incoming beam into two which are
then measured with fiber-coupled photodetectors D1 and D2.
with a Hanbury-Brown Twiss type interferometer, and for the weak value measurement we pre- select the photon polarization state using P1(polarizer), and then weak measurement on polarization states is then implemented with a 0.5mm thick quartz plate(Q). Finally, we post-select the polarization state with P2(polarizaer) and measure the spatial profile using CCD camera.
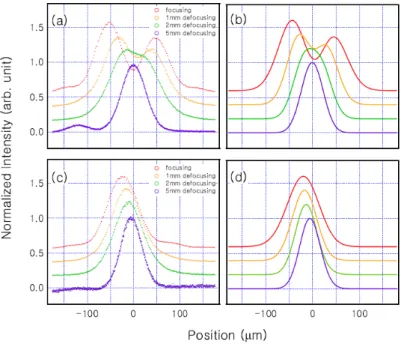
Fig. 2. Weak value measurement experimental data, (a). and (c), and corresponding theoretical results, (b) and (d). The wc/w0 values are 2.043(focusing), 1.332(1mm defocusing), 0865(2mm defocusing), and 0.404
(5mm defocusing). For (a) and (b), ε=1.00×10⁻³ rad. For (c) and (d), ε=2.79×10⁻² rad. All plots are normalized to unity and vertically shifted for clarity.
The experimental and theoretical results and corresponding theoretical results are shown in Fig.2. We set the angle of P1 and P2 as α=π/4 and β=-π/4+ε, respectively and is the coherence
length and is the beam waist of the gaussian beam. The experimental results show that the
weak value , the peak position of the measured spatial profile, larger than the eigenvalue of the
operator is observed. In addition, the larger the degree of partial coherence , the
larger the resulting weak value . It is also interesting to note that when ε is too close to zero
(ε=1.00×10⁻³), the weak value is not well defined. As a results, the spatial profile shows two peaks when is large enough, but it reduces to a single Gaussian peak centered nearly at zero when
is much smaller than 1. This is clearly due to the lack of quantum interference. The weak
value effect is more clearly visible for a slightly larger values of ε, ε=2.79×10⁻². As shown in Fig. 2.(c), the weak value effect is reduced gradually as gets smaller.
1. Y. Aharonov, D.Z. Albert, and L. Vaidman, Phys. Rev. Lett 60, 1351 (1988) 2. I.M. Duck, P.M. Stevenson, and E.C.G. Sudarshan, Phys. Rev. D 40, 2112 (1989) 3. N.W.N. Ritchie, J.G.Story, and R.H. Hulet, Phys. Rev. Lett. 66, 1107 (1991)