의
의
의학
학
학 석
석
석사
사
사학
학
학위
위
위 논
논
논문
문
문
Identifying Patients at Risk for Hyperperfusion
after Carotid Stenting Using CT Perfusion with
Acetazolamide Challenge
아
아
아 주
주
주 대
대
대 학
학
학 교
교
교 대
대
대 학
학
학 원
원
원
의
의
의 학
학
학 과
과
과
김
김
김 은
은
은 진
진
진
Identifying Patients at Risk for Hyperperfusion after Carotid
Stenting Using CT Perfusion with Acetazolamide Challenge
by
Eun Jin Kim
A Dissertation Submitted to The Graduate School of Ajou University
in Partial Fulfillment of the Requirements for the Degree of
MASTER OF MEDICAL SCIENCES
Supervised by
Sun Yong Kim, M.D.
Department
Department
Department
Department of
of
of Medical
of
Medical
Medical
Medical Sciences
Sciences
Sciences
Sciences
The
The
The
The Graduate
Graduate
Graduate School,
Graduate
School,
School, Ajou
School,
Ajou
Ajou University
Ajou
University
University
University
August,
August,
August,
김
김
김은
은
은진
진
진의
의 의
의
의
의학
학
학 석
석
석사
사
사학
학
학위
위
위 논
논
논문
문
문을
을 인
을
인
인준
준
준함
함
함.
.
.
심
심
심사
사
사위
위
위원
원
원장
장
장
김
김
김 선
선
선 용
용
용
인
인
인
심
심
심 사
사
사 위
위
위 원
원
원
원
원
원 제
제
제 환
환
환
인
인
인
심
심
심 사
사
사 위
위
위 원
원
원
신
신
신 용
용
용 삼
삼
삼
인
인
인
아
아
아 주
주
주 대
대
대 학
학
학 교
교
교 대
대
대 학
학
학 원
원
원
2
2
20
0
00
0
08
8
8년
년
년 6
6
6월
월
월 2
2
23
3
3일
일
일
-ABSTRACT-
Identifying Patients at Risk for Hyperperfusion after Carotid
Stenting Using CT Perfusion with Acetazolamide Challenge
Hyperperfusion syndrome can occur in patients with preprocedural cerebral hemodynamic impairment who candidate for carotid stent. We investigated whether preprocedural measurement of cerebrovascular reserve (CVR) by using CT perfusion (CTP) with acetazolamide (ACZ) challenge could identify patients at risk for hyperperfusion after CS.
For 12 patients with symptomatic unilateral or bilateral carotid stenosis (> 70%), hemodynamic parameters including cerebral blood volume (CBV), cerebral blood flow (CBF), mean transit time (MTT), and percent change of CBF were investigated before, 1 day and 3 months after CS, with resting and ACZ-challenged CTP. Normal percent changes of CBV, CBF, and MTT were determined in 12 age and sex-matched normal controls.
On the qualitative CVR analysis, ipsilateral CBF increase on the first postprocedural day were not significantly different between the reduced and the normal CVR group (1.7 ± 3.6 % vs. 7.0 ± 10.9 %, P > 0.05). Three months later, this increase was almost normalized. On the quantitative CVR analysis, there was no significant correlation between the values of preprocedural CTP parameters and CBF increases in 1 day after CS, however quantitative CVR showed fair correlation with CBF increase. Maximum 1 day CBF increase was observed in the reduced CVR group. Hyperperfusion (CBF increase of > 100% compared
with baseline values) was not observed in both reduced and normal CVR groups.
The values of CTP parameters before CS were not significantly correlated with CBF increase 1 day after CS. Quantitative CVR showed fair correlation with the percent change of CBF 1 day after CS.
Keywords: hyperperfusion, hyperperfusion syndrome, CT perfusion, carotid artery stenosis, stent
TABLE OF CONTENTS
ABSTRACT i
TABLE OF CONTENTS iii
LIST OF FIGURES iv
. INTRODUCTION Ⅰ 1
. MATERIALS AND METHODS Ⅱ 4 A. Study Population 4 B. CT Imaging Protocol 5 C. CT Data Processing 6 D. Data Analysis 7 E. Statistical Analysis 8 . RESULTS Ⅲ 9 . DISCUSSION Ⅳ 13 . CONCLUSION Ⅴ 15 REFERENCES 16 국문요약 21
LIST OF FIGURES
Fig. 1. The comparison of asymmetric index (AI) of cerebral blood flow (CBF) 1 day after carotid stenting between visually normal and abnormal groups of cerebral blood volume, CBF, and cerebrovascular reserve before stenting. 10
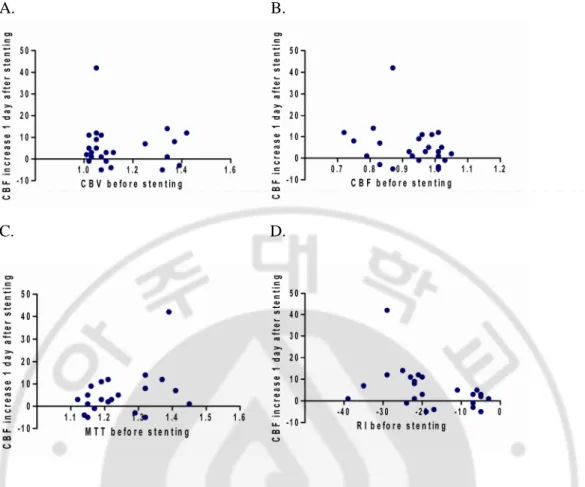
Fig. 2. Scatter plots show the correlation between the CT perfusion parameters and the percent change of cerebral blood flow increase 1 day after stenting. 11
I. INTRODUCTION
Hyperperfusion is defined as a major increase in ipsilateral cerebral blood flow (CBF) above the metabolic demands of the brain tissue following repair of unilateral carotid stenosis (Hosoda et al., 2001). Its pathophysiology is not identified yet, but believed as rapid restoration of normal perfusion pressure in regions of the cerebral hemisphere in which autoregulation had been impaired because of preoperative chronic hypoperfusion with chronic maximal dilatation of its blood vessels (Bernstein et al., 1984). The patient with hyperperfusion may develop the symptoms of hyperperfusion syndrome, including severe ipsilateral headache, face and eye pain, seizures, and intracerebral hemorrhage (Bernstein et al., 1984; Hosoda et al., 2001; Ascher et al., 2003). Hyperperfusion syndrome is a rare but devastating complication after carotid endarterectomy (CEA) or carotid stenting (CS) for the correction of unilateral internal carotid artery (ICA) stenosis (Bernstein et al., 1984; Ho et al., 2000). Incidence of intracerebral hemorrhage is relatively low, and reported from 0.4 % to 2.1 % (Solomon et al., 1986; Piepgras et al., 1988; Ouriel et al., 1999; Henderson et al., 2001; Ogasawara et al., 2007). However, the prognosis for patient with ICH is very poor, with mortality rates of 36 % to 63% and significant morbidity (Hosoda et al., 2001). Risk factors of this syndrome include hypertension, high-grade stenosis, poor collateral blood flow, and contralateral carotid occlusion (Reigel et al., 1987).
Hyperperfusion syndrome and its associated intracerebral hemorrhage is related with preoperative impairment of autoregulation due to chronic ischemia (Bernstein et al., 1984). Another mechanism of hyperperfusion syndrome occurred after CS is proposed as
postoperative transient embolism of cerebral arteries and recanalization or acute cerebral ischemia during clamping of the ICA (Ogasawara et al., 2007). After carotid stenting or CEA, the risk of intracerebral hemorrhage in patients with hyperperfusion was known to be 10 times higher than that of patients without hyperperfusion (Hosoda et al., 2001). Also, it was reported that the risk of hyperperfusion syndrome increased in patients whose cerebrovascular reactivity were reduced (Solomon et al., 1986; Schroeder et al., 1987; Piepgras et al., 1988). When hyperperfusion syndrome occurs, it is difficult to control and treat (Sbarigia et al., 1993; Ouriel et al., 1999). For this reason, variable imaging modalities have been tested in order to evaluate preprocedural cerebral hemodynamics. These includes transcranial Doppler sonography, PET, SPECT, perfusion-weighted MR imaging and CT perfusion (CTP) imaging (Trojanowska et al., 2006).
Paired CBF measurements withthe initial measurement obtained at rest and the second measurementobtained following a cerebral vasodilatory stimulus to calculatepercent changes are intended to detect the presenceof autoregulatory vasodilation (Derdeyn et al., 1999). Single-photon emission computerized tomography (SPECT) scanning has been widely used to assess regional brain perfusion with semiquantitative measurement (Hosoda et al., 2001; Ogasawara et al., 2003). According to Hosoda et al., SPECT with ACZ challenge could identify patients at risk for hyperperfusion after CEA. ACZ–challenged perfusion CT or MRI also can measure cerebrovascular reserve (CVR) in similar way with SPECT. Although SPECT is an established method for measuring CBF with or without ACZ challenge in patients with stroke or carotid disease (Raynaud et al., 1989; Kuroda et al., 2001), it usually has to be performed in a two-day setting due to tracer kinetics. Moreover, it provides less
morphological information than CT or MR imaging. PET can not routinely be applied to patients in many hospitals. The usefulness of dynamic CTP imaging for early diagnosis of acute ischemic stroke has previously beenreported, and it has become a promising tool fora quick evaluation of the cerebral circulationin an acute stroke (Wintermark et al., 2002a; Wintermark et al., 2002b). Moreover, this imaging modality is much more readily accessible imaging method to assess cerebral hemodynamic status in patients with cerebral steno-occlusive arterial disease than SPECT and PET. However, 64-channel multidetecter CT scanner which overcome limited coverage of brain with using previous CTP was recently developed and so brain CTP can be routinely available only in hospitals with recently purchased CT scanner.
The purpose of this study is to assess if there is any relationship between CTP parameters before carotid stenting and hyperperfusion after the procedure.
II. MATERIALS AND METHODS
A. Study Population
Between October 2006 and March 2008, 19 consecutive patients underwent carotid stenting (CS), 12 of whom fulfilled the following inclusion criteria and were enrolled in this study. The inclusion criteria were as follows: digital subtraction angiography (DSA) or CT angiography showing unilateral or bilateral ICA stenosis with > 70% diameter reduction, no notable renal insufficiencyor allergy to contrast agent, and underwent CTP before and after ACZ challenge. To determine the degree of ICA stenosis, we used the criteria of the North American Symptomatic Carotid Endarterectomy Trial (NASCET) (1991). None of the patients had stenoses in intracranial vasculature. ACZ - challenged CTP were also performed in 12 age and sex-matched normal controls. There were 7 men (age range, 45–79years; median age, 59 years) and 5 women (age range, 47–72 years; median age, 55 years). All study patients had experienced single or recurrent episodes of transient ischemic attack such as hemiparesis or hemihypesthesia. In these patients, the symptoms were referable to the side of the stenosed carotid artery. All patients underwent neurologicand cardiologic examination, electrocardiography, Doppler sonography, and CT angiography or DSA of the epiaortic vessels and were treated withantiplatelet therapy. The degree of neurological impairment was evaluated with using the National Institute of Health stroke score (NIHSS). Stroke risk factors such as arterial hypertension, generalized arterial occlusive disease and diabetes mellitus were reviewed in all study patients. Our institutional review board approved this study and written informed consent was obtained from every participant in accordance to the
guidelines of the institutional review board at our institution.
B. CT Imaging Protocol
The imaging protocol consisted of nonenhanced CT and CTP before and after ACZ injection. CTP studies were performed in the transverseplane with using a 64-channel multi-detectorCT scanner (Brilliance 64 Channel CT, PhilipsMedical Systems, Cleveland, Ohio). CTP consisted of a 60 second series with 30 gantry rotationsperformed in a cine mode during the intravenous administration of iodinated contrast material. Images were acquired and reconstructedat a temporal sampling rate of one image per two seconds, resultingin a series of 30 images for each assessed section. After non-enhancedCT scan of the whole brain, at the level of the basal ganglia covering all 3 vascularterritories, a 4 cm thick slab oriented in the transverse plane was definedand the slab was preferred to eight adjacent 5-mm-thick sections per location to maximize the signal-to-noise ratio without increasingthe dose to patient. A 50 mL bolus of non-ionic contrast media (Omnipaque, iodine300 mg/mL; Amersham Health, Princeton, NJ) was administeredinto an antecubital vein by using a power injector with injection rate of 4.5 mL/s. The acquisition parameters were 80 kVp and 120 mAs. CT scanning was initiated 2 seconds after the start ofthe injection. The gantry angle was parallel to andabove the orbital roof to avoid radiation exposure to the lens. CT scans were studied once before intravenous infusion of 1000 mg of ACZ(Diamox; Wyeth, Marietta, PA), and again 20 minutes after the infusion of ACZ. Both at-rest and ACZ - CTP studies were obtained during the same session with patients remaining in supine position.
C. CTP Data Processing
CTP data were analyzed by using brain perfusion software (Extended Brilliance Workstation v 3.0, PhilipsMedical Systems, Cleveland, Ohio). The software relieson the central volume principle to calculate perfusion parameters from the time concentration curve. It has been reported that this principle is the most accuratefor low injection rates of iodinated contrast agent (Wintermark et al., 2001).The software firstperforms a motion correction and then noise reduction was done by using an anisotropic, edge-preserving spatial filter. Summary parameters were obtained directly from time-attenuation curve. Among them, we semiquantitatively assessed bolus arrival time difference relative to cerebellum to exclude the cases with severe bolus delay. The softwareapplies curve fitting by a least-mean-squares method to obtainmathematical descriptions of the time-attenuation curves, and MTT map was calculated by a closed-form (noniterative) deconvolution operation from the time - concentration curve of a particular voxel and the AIF (Wintermark et al., 2001). An AIF was selected by placing a small circular region of interest within the earliest appearing and most densely enhancing artery (usually one of middle cerebral artery ipsilateral to less affected hemisphere, angiographic stage I or II and bolus arrival time difference less than 1.7 sec). A venous function was selected by placing a circular ROI within superior sagittal sinus. For each voxel, the CBV map was calculated from the areasunder the time-concentration curves. The CBF map for each voxel is finally calculated according to the following equation combiningCBV and MTT value: CBF = CBV / MTT (Axel, 1983).
D. Data Analysis
For the visual analysis of parametric maps, all baseline and ACZ – challenged CTP maps were scored forrelative perfusion abnormalities by using a 20-level color scale. We can visually discriminate more than four color scale difference between the hemispheres.Two experienced neuroradiologists independently and blindly evaluated the cerebral blood volume (CBV), CBF, and mean transit time (MTT) maps before and after ACZ injection. For the evaluation of baseline parameters, more than four color scale (20%) decrease in each vascular territory ipsilateral to high-grade carotid stenosis compared with normal cerebellar hemisphere was defined as decreased value of parameter. A comparison was then made of the relative perfusion changes between thebaseline and ACZ studies. Cases with a increase less than 20% (four color change)or reduction of perfusion in each vascular territory in the ACZ study, compared with the baseline study, weredefined as having a "decreased CVR group" whereas cases that show a increase more than 20 % in perfusion were defined as having a "normalCVR group". After the blinded study, discrepancies were resolved by consensus. Finally, the consensus data of the CTP images were comparedwith clinical findings.
For the quantitative analysis, an experienced neuroradiologist drew eight standardized polygonal mirrored ROIs manually on the reference CT image over the cortical gray matter of the expected territoryof the middle cerebral artery (MCA) and the anterior external border zone (ABZ). To eliminate vascular pixels from the calculation and from the color perfusion images, any pixel with the value 9 ml/100 g and greater in the CBV image is not displayed on the perfusion maps or included in the ROI measurement. Removed pixels were colored black (zero value) and those same pixels were also removed from the CBF and MTT maps. From
eachROI, the absolute values of the CBF, CBV, and MTT were calculated and then, for normalization of each baseline parameter, asymmetric index (AI) was calculated by dividing the absolute values in the stenotic hemispheresby those in the cerebellar hemisphere. These AIs of baseline parameters were investigated before, 1 day and 3 months after CS. For the ACZ – challenged CTP study, a section at the same level as the one selected for the baseline study was selected. For the evaluation of vascular reserve capacity, reactivity index (RI) was calculated as follows: RI (%) = (AIACZ-AIBaseline)÷ AIBaseline x 100, where AIBaselineand AIACZ represented AI of baseline CTP parameter before and after intravenousinjection of ACZ, respectively. Percent change of CBF increase before and after CS was calculated as follows: AI of CBFpoststenting÷ AI of CBFprestenting x 100.
E. Statistical analysis
Interobserver agreement for the visual and quantitative analyses of baseline parameters and CVR were measured by using thekappa statistic (k) for nominal data and intraclass correlation coeffient (ICC) for continuous variables. The percent change of CBF increase 1 day after CS were compared between the normal and the decreased CVR groups on each ROI location by usingthe Mann-Whitney U test. The correlations between the percent change of CBF increase 1 day after CS and the values of CTP parameters before CS were calculated with using Spearman’s correlation coefficient.
III. RESULTS
All patients underwent ACZ – challenged CTP successfully. No adverse effects were reported afterACZ administration.On visual analysis, all patients displayed longer MTT ipsilateral to high-grade carotid stenosis, which was most pronounced in ABZ. For baseline CBF, there was a trend for slightlylower preoperative values in the symptomatic hemisphere than in asymptomatic hemisphere. The CBVvalues remained homogeneous between the symptomatic and asymptomatic hemispheres. Among the 24 ROIs in the territories of MCA and ABZ ipsilateral to CS, 17 ROIs had a visible decreased CVR, with a perfect interobserver agreement (k = 1.0). There was no statistically significant difference of percent change of CBF increase 1 day after CS between the normal and decreased CVR groups in all ROIs (1.7 ± 3.6 % vs. 7.0 ± 10.9 %, P > 0.05) (Fig. 1).
On quantitative analysis, ICC for measurement of CTP parameters between the two observers, was excellent (r = 0.82). The AIs of baseline CTP parameters before stenting were not significantly correlated with the percent change of CBF increase 1 day after CS (r = -0.06 for AI of CBV; r = -0.26 for AI of CBF; r = 0.39 for AI of MTT, P > 0.05) (Fig. 2). The RI before stenting was not significantly but fairly correlated with the percent change of CBF increase 1 day after CS (r = -0.42, P < 0.05) (Fig. 2). Maximum 1 day CBF increase was observed in the reduced CVR group (42 %) (Fig. 3). Hyperperfusion (CBF increase of > 100% compared with baseline values) was not observed in both reduced and normal CVR groups.
A. B. C.
Fig. 1. The comparison of asymmetric index (AI) of cerebral blood flow (CBF) 1 day after carotid stenting between visually normal and abnormal groups of cerebral blood volume (A), CBF (B), and cerebrovascular reserve (C) before stenting.
A. B.
C. D.
Fig. 2. Scatter plots show the correlation between the CT perfusion parameters and the percent change of cerebral blood flow (CBF) increase 1 day after stenting. A.
Asymmetric index (AI) of cerebral blood volume before stenting vs. percent change of CBF increase 1 day after stenting, B. AI of CBF before stenting vs. percent change of CBF increase 1 day after stenting, C. AI of mean transit time before stenting vs. percent change of CBF increase 1 day after stenting, D. Reactivity index (RI) before stenting vs. percent change of CBF increase 1 day after stenting.
A. B. C.
D. E.
Fig. 3. A 64-year-old male patient with symptomatic severe left carotid stenosis. Baseline
cerebral blood volume (CBV) (A) and cerebral blood flow (CBF) (B) maps are symmetric in both hemispheres. C. Baseline mean transit time map shows mild delayed transit time in left middle cerebral artery territory and anterior border zone. CBV (D) and CBF (E) map after acetazolamide challenge.
IV. DISCUSSION
In our study, there was no significant correlation of CBF increase on the first postoperative day with preprocedural perfusion parameters, such as visually assessed qualitative CBV, CBF, or CVR; or quantitative CBV, CBF, MTT or CVR. None of our patients had hyperperfusion or hyperperfusion syndrome immediately after procedure both in reduced and normal CVR group.
Previous study of patients who underwent CEA evaluated with ACZ-challenged SPECT, there was a significant CBF increase on the first postoperative day in patient group with reduced CVR (Hosoda et al., 2001). Two patients out of 9 patients with reduced CVR showed postoperative hyperperfusion on SPECT in this study. Another SPECT study also reported that hyperperfusion was observed in 8 of 12 patients with reduced preoperative CVR (Ogasawara et al., 2003). Rapid restoration of blood flow after correction of high-grade carotid stenosis by CEA was suggested to cause hyperperfusion, in the situation of impaired autoregulatory vasodilation in patients with impaired hemodynamic due to chronic stenosis. Incidence of hyperperfusion in patients with reduced preoperative CVR ranges from 20% -70% (Komoribayashi et al., 2006). Reasonably, preoperatively reduced CVR has been thought to be able to predict the high risk of developing postoperative hyperperfusion.
There was no statistically significant correlation of percent change of CBF increase on 1 day after CS with the CTP parameters including CVR. However, the RI representing quantitative CVR derived from CTP parameter was fairly correlated to the percent change of CBF increase. This may be affected by small size of sample of our patient group. Another
possibility could be that patients with bilateral carotid stenosis were included in study population, in contrary to that the previous studies exclusively selected the unilateral stenosis patient.
Perfusion imaging based on computed tomography allows the evaluation of some parameters to evaluate cerebral hemodynamics, such as CBF, CBV and MTT. CTP imaging can be easily performed as with a standard brain CT examination, with a small increase in the time and costs of the imaging technique (Trojanowska et al., 2006). Also, compared to ACZ-challenged SPECT currently widely performed, which takes at least 2 day for examination, CTP with ACZ challenge is easily accessible and fast: 30 minutes for full examination. CTP also provides more accurate anatomic information and higher spatial resolution. If the CT angiography is performed in the same session with CTP, it could also provide additional information about vascular structure or abnormality.
There are several limitations regarding the quantificationof CTP as used clinically. First, the selection of appropriate input artery for adequate perfusion CT image is not always possible, especially in patients with bilateral carotid stenosis. Intrasubject normalization of the data such as AI is adapted to avoid this problem. The use of AIs takesadvantage of the basic symmetry of the brain to improve sensitivityfor identifying localized disease. Second limitation is that ROIs were drawn manually for perfusion parameters, which may result decreased reproducibility and volume averaging of gray and white matters. In our study, two observers constantly drew the ROIs in consensus cautiously not to include the cerebral white matter as possible.
V. CONCLUSION
In conclusion, CTP parameters before stenting were not significantly correlated, but quantitative CVR showed fair correlation with CBF increase one day after stenting in this study. Further research with larger patient group will be needed to find out whether the reduced CVR could truly predict postprocedural CBF increase, and additionally hyperperfusion or hyperperfusion syndrome.
REFERENCES
1. North American Symptomatic Carotid Endarterectomy Trial. Methods, patient characteristics, and progress. Stroke. 22 (6): p. 711-20, 1991
2. Ascher, E, Markevich, N, Schutzer, RW, Kallakuri, S, Jacob, T, and Hingorani, AP: Cerebral hyperperfusion syndrome after carotid endarterectomy: predictive factors and hemodynamic changes. J Vasc Surg. 37 (4): p. 769-77, 2003
3. Axel, L: Tissue mean transit time from dynamic computed tomography by a simple deconvolution technique. Invest Radiol. 18 (1): p. 94-9, 1983
4. Bernstein, M, Fleming, JF, and Deck, JH: Cerebral hyperperfusion after carotid endarterectomy: a cause of cerebral hemorrhage. Neurosurgery. 15 (1): p. 50-6, 1984
5. Derdeyn, CP, Grubb, RL, Jr., and Powers, WJ: Cerebral hemodynamic impairment: methods of measurement and association with stroke risk. Neurology. 53 (2): p. 251-9, 1999
6. Henderson, RD, Phan, TG, Piepgras, DG, and Wijdicks, EF: Mechanisms of intracerebral hemorrhage after carotid endarterectomy. J Neurosurg. 95 (6): p. 964-9, 2001
7. Ho, DS, Wang, Y, Chui, M, Ho, SL, and Cheung, RT: Epileptic seizures attributed to cerebral hyperperfusion after percutaneous transluminal angioplasty and stenting of the internal carotid artery. Cerebrovasc Dis. 10 (5): p. 374-9, 2000
8. Hosoda, K, Kawaguchi, T, Shibata, Y, Kamei, M, Kidoguchi, K, Koyama, J, Fujita, S, and Tamaki, N: Cerebral vasoreactivity and internal carotid artery flow help to identify patients at risk for hyperperfusion after carotid endarterectomy. Stroke. 32 (7): p. 1567-73, 2001
9. Komoribayashi, N, Ogasawara, K, Kobayashi, M, Saitoh, H, Terasaki, K, Inoue, T, and Ogawa, A: Cerebral hyperperfusion after carotid endarterectomy is associated with preoperative hemodynamic impairment and intraoperative cerebral ischemia. J Cereb Blood Flow Metab. 26 (7): p. 878-84, 2006
10. Kuroda, S, Houkin, K, Kamiyama, H, Mitsumori, K, Iwasaki, Y, and Abe, H: Long-term prognosis of medically treated patients with internal carotid or middle cerebral artery occlusion: can acetazolamide test predict it? Stroke. 32 (9): p. 2110-6, 2001
11. Ogasawara, K, Sakai, N, Kuroiwa, T, Hosoda, K, Iihara, K, Toyoda, K, Sakai, C, Nagata, I, and Ogawa, A: Intracranial hemorrhage associated with cerebral hyperperfusion syndrome following carotid endarterectomy and carotid artery stenting: retrospective review of 4494 patients. J Neurosurg. 107 (6): p. 1130-6, 2007
12. Ogasawara, K, Yukawa, H, Kobayashi, M, Mikami, C, Konno, H, Terasaki, K, Inoue, T, and Ogawa, A: Prediction and monitoring of cerebral hyperperfusion after carotid endarterectomy by using single-photon emission computerized tomography scanning. J Neurosurg. 99 (3): p. 504-10, 2003
13. Ouriel, K, Shortell, CK, Illig, KA, Greenberg, RK, and Green, RM: Intracerebral hemorrhage after carotid endarterectomy: incidence, contribution to neurologic morbidity, and predictive factors. J Vasc Surg. 29 (1): p. 82-7; discussion 87-9, 1999
14. Piepgras, DG, Morgan, MK, Sundt, TM, Jr., Yanagihara, T, and Mussman, LM: Intracerebral hemorrhage after carotid endarterectomy. J Neurosurg. 68 (4): p. 532-6, 1988
15. Raynaud, C, Rancurel, G, Tzourio, N, Soucy, JP, Baron, JC, Pappata, S, Cambon, H, Mazoyer, B, Lassen, NA, Cabanis, E, and et al.: SPECT analysis of recent cerebral infarction. Stroke. 20 (2): p. 192-204, 1989
16. Reigel, MM, Hollier, LH, Sundt, TM, Jr., Piepgras, DG, Sharbrough, FW, and Cherry, KJ: Cerebral hyperperfusion syndrome: a cause of neurologic dysfunction after carotid endarterectomy. J Vasc Surg. 5 (4): p. 628-34, 1987
Post-carotid endarterectomy hyperperfusion syndrome: preliminary observations for identifying at risk patients by transcranial Doppler sonography and the acetazolamide test. Eur J Vasc Surg. 7 (3): p. 252-6, 1993
18. Schroeder, T, Sillesen, H, Sorensen, O, and Engell, HC: Cerebral hyperperfusion following carotid endarterectomy. J Neurosurg. 66 (6): p. 824-9, 1987
19. Solomon, RA, Loftus, CM, Quest, DO, and Correll, JW: Incidence and etiology of intracerebral hemorrhage following carotid endarterectomy. J Neurosurg. 64 (1): p. 29-34, 1986
20. Trojanowska, A, Drop, A, Jargiello, T, Wojczal, J, and Szczerbo-Trojanowska, M: Changes in cerebral hemodynamics after carotid stenting: evaluation with CT perfusion studies. J Neuroradiol. 33 (3): p. 169-74, 2006
21. Wintermark, M, Maeder, P, Thiran, JP, Schnyder, P, and Meuli, R: Quantitative assessment of regional cerebral blood flows by perfusion CT studies at low injection rates: a critical review of the underlying theoretical models. Eur Radiol. 11 (7): p. 1220-30, 2001
22. Wintermark, M, Reichhart, M, Cuisenaire, O, Maeder, P, Thiran, JP, Schnyder, P, Bogousslavsky, J, and Meuli, R: Comparison of admission perfusion computed
tomography and qualitative diffusion- and perfusion-weighted magnetic resonance imaging in acute stroke patients. Stroke. 33 (8): p. 2025-31, 2002a
23. Wintermark, M, Reichhart, M, Thiran, JP, Maeder, P, Chalaron, M, Schnyder, P, Bogousslavsky, J, and Meuli, R: Prognostic accuracy of cerebral blood flow measurement by perfusion computed tomography, at the time of emergency room admission, in acute stroke patients. Ann Neurol. 51 (4): p. 417-32, 2002
- 국문요약 -
아세타졸라마이드
아세타졸라마이드
아세타졸라마이드
아세타졸라마이드 투여
투여 CT
투여
투여
CT
CT
CT
관류
관류
관류
관류 영상을
영상을 이용한
영상을
영상을
이용한
이용한
이용한 경동맥
경동맥
경동맥
경동맥 스텐트
스텐트
스텐트
스텐트
시술
시술
시술
시술 후
후
후
후 과관류
과관류
과관류
과관류 증후군의
증후군의
증후군의
증후군의 위험도
위험도
위험도
위험도 예측
예측
예측
예측
아주대학교 대학원의학과 김 은 진 (지도교수: 김 선 용) 과관류 증후군은 경동맥 스텐트 시술을 받은 환자에서 기존에 뇌혈역학적 장애가 있는 경우 발생할 수 있다. 시술 전 대뇌혈관반응성 (CVR)을 아세타졸라마이드 투여 CT 관류영상으로 측정하여 경동맥 스텐트 시술 후 과관류 증후군의 위험도가 높은 환자를 예측하고자 하였다. 증상이 있는 단측 또는 양측의 70% 이상의 경동맥 협착이 있는 12명의 환자에서, 뇌혈용적 (CBV), 뇌혈류량 (CBF), 평균통과시간 (MTT), CBF 의 퍼센트 변화 등과 같은 관류 변수를 경동맥 스텐트 시술 전, 시술 후 1일, 시술 후 3개월에 아세타졸라마이드 투여 전후 CT 관류영상을 이용하여 조사하였다. CBV, CBF, MTT의 정상 퍼센트 변화는 12 명의 연령 및 성별 대조군에서 결정하였다. 질적 CVR 분석 결과, 시술 1일 후 환측 CBF의 증가는 CVR이 감소된 군과 정상인 군에서 유의한 차이가 없었다 (1.7 ± 3.6 % vs 7.0 ± 10.9 %, P >0.05). 3개월 후 CBF의 증가는 대부분 정상화되었다. 양적 CVR 분석에서는, 양적 CVR 등의 CT 관류 변수 값과 시술 1일 후 CBF 증가 간에 통계학적으로 유의한 상관관계는 없었으나 CVR이 감소할수록 CBF 변화값이 증가되는 양상을 보였다. 또한, 스텐트 1일 후 CBF 증가가 최대인 사례는 CVR이 감소된 군에서 보였다. CVR이 감소된 군과 정상인 군 모두에서 과관류 (CBF 증가가 기저 값에서 100% 이상 증가) 는 없었다. 결론적으로, 경동맥 스텐트 시술 전의 CT 관류 영상의 변수들은 시술 1일 후 CBF 증가와 통계학적으로 유의한 관련을 보이지 않았으나, 양적 CVR은 시술 후 CBF 증가와 연관성을 보이는 경향이 있었다. 핵심어: 과관류, 과관류 증후군, 관류 CT 영상, 경동맥 협착, 스텐트