The Effect of Topical Tranexamic Acid
Application on Melasma Treatment
by
Sang Jin Kim
Major in Medicine
Department of Medical Sciences
The Graduate School, Ajou University
The Effect of Topical Tranexamic Acid
Application on Melasma Treatment
by
Sang Jin Kim
A Dissertation Submitted to The Graduate School of
Ajou University in Partial Fulfillment of the Requirements
for the Degree of
Master of Medicine
Supervised by
Hee Young Kang, M.D., Ph.D.
Major in Medicine
Department of Medical Sciences
The Graduate School, Ajou University
This certifies that the dissertation
of Sang Jin Kim is approved.
SUPERVISORY COMMITTEE
Hee Young Kang
Jae Ho Han
Tae Jun Park
The Graduate School, Ajou University
December, 19th, 2014
감사의 글
본 논문을 완성할 때까지 지도와 조언을 아끼지 않으셨던 지도 교수
강희영 교수님께 진심으로 감사 드립니다. 또한 좋은 연구를 할 수
있도록 많은 조언과 격려를 주신 한재호 교수님과 박태준 교수님께도
깊은 감사의 말씀을 드립니다. 그리고 연구 기간 내내 도움을 주신
박지윤 선생님과 연구 초기 여러 과정을 도와주신 박선이 선생님, 그리고
조직염색과 분석을 도와주신 김영배 선생님께도 감사 드립니다.
언제나 아낌 없는 사랑으로 지원해 주시는 부모님, 동생에게도 깊은
감사의 마음을 전합니다.
2015 년 1 월
저자 씀
i -ABSTRACT-
The Effect of Topical Tranexamic Acid Application on Melasma
Treatment
Background and Objectives: Melasma is an acquired hyperpigmentary disorder mainly on the face. Tranexamic acid (TA), a plasmin inhibitor, has been suggested as an efficient treatment modality on melasma. The aim of this study was to investigate the effects and action mechanism of topical TA in the treatment of melasma.
Material and methods:Twenty three healthy Korean females with melasma were enrolled, and applied 2% TA formulation on the whole face for 12 weeks. Pigmentation and erythema were objectively assessed using melasma severity scale (MSS), modified melasma area and severity index (mMASI), and chromameter. The subject satisfaction questionnaire was also documented. Skin biopsies were obtained from 10 subjects on baseline and 12 weeks after treatment. Histological and immunohistochemical analyses were performed.
Results: After 12 weeks, significant improvement in MSS and mMASI showed in 22 of 23
patients. L* values were increased in both lesional and perilesional normal skin after 12 weeks. The improvement was noticed in 4 weeks. a* values were decreased in both lesional and perilesional normal skin. Subjective satisfaction score was improved. Fontana-Masson staining showed significant decrease of pigmentation in both lesional and perilesional normal skin after treatment. There were no changes in vascularity and number of mast cells. ET-1 expression was significantly decreased in the epidermis of both lesional and perilesional normal skin after treatment. SCF expression in the epidermis was significantly decreased in the lesional skin after treatment. There were no changes in expressions of α-MSH, EP2, and VEGF.
Conclusion: Topical TA improved pigmentation and erythema in melasma. Decreased
expression of ET-1 and SCF in the epidermis after treatment was suspected to be an action mechanism of topical TA for melasma treatment.
ii
TABLE OF CONTENTS
ABSTRACT ... i TABLE OF CONTENTS ... ii LIST OF FIGURES ... iv LIST OF TABLES ... v I. INTRODUCTION ... 1II. MATERIALS AND METHODS ... 3
A. Subjects ... 3
B. Protocol of topical TA application... 3
C. Assessment of TA treatment efficacy ... 3
D. Histopathological and immunohistochemistrical analysis ... 4
E. Image analysis ... 5
F. Statistical analysis ... 6
III. RESULTS ... 7
A. Clinical assessment of TA treatment efficacy ... 7
1. Clinical photographs ... 7
2. Melasma severity scale (MSS) ... 7
3. Modified melasma area and severity index (mMASI) ... 8
4. Chromameter ... 9
5. Subjective satisfaction score ... 10
B. Histological analysis ... 11
1. Pigmentation ... 11
2. Vascularity ... 11
3. Mast cell ... 13
4. Other immunohistochemical results ... 14
iii
V. CONCLUSION ... 23
REFERENCES ... 24
SUPPLEMENTS ... 27
iv
LIST OF FIGURES
Fig. 1. Clinical photographs from 0 week to 12 week after topical TA application ... 7
Fig. 2. Change of MSS after topical TA treatment... 8
Fig. 3. Change of mMASI after topical TA treatment ... 8
Fig. 4. Change of L* value after topical TA treatment... 9
Fig. 5. Change of a* value after topical TA treatment ...10
Fig. 6. Change of subjective satisfaction score after topical TA treatment ...10
Fig. 7. Fontana-Masson staining to visualize epidermal pigmentation ... 11
Fig. 8. CD31 expression of dermis after topical TA treatment ...12
Fig. 9. D2-40 expression of dermis after topical TA treatment ...13
Fig. 10. c-kit expression of dermis after topical TA treatment ...14
Fig. 11. ET-1 expression of epidermis after topical TA treatment...15
Fig. 12. α-MSH expression of epidermis after topical TA treatment ... 16
Fig. 13. EP2 expression of epidermis after topical TA treatment ...17
Fig. 14. VEGF expression of epidermis after topical TA treatment ...18
v
LIST OF TABLES
- 1 -
I. INTRODUCTION
Melasma is an acquired hyperpigmentary disorder mainly on the face. Its pathogenesis is still obscure and the related factors have known as the genetic predisposition, ultraviolet (UV) radiation, hormonal factors, and drugs (Sarkar et al., 2014). The major histological presentation is the increased melanin pigment in all epidermal layers (Kang et al., 2002). Furthermore, other histological evidences, such as the disrupted and thinner basement membrane, prominent solar elastosis, and increased vasculature, are also observed in the lesional skin of melasma (Kang et al., 2002; Kim et al., 2007; Hernandez-Barrera et al., 2008; Torres-Alvarez et al., 2011). With previous immunohistochemical analysis, elevated expression of vascular endothelial growth factor (VEGF), c-kit, and stem cell factor (SCF) have also been reported (Kang et al., 2006; Kim et al., 2007; Torres-Alvarez et al., 2011). All these findings suggested that the altered dermal structures might play an important role in the development of melasma.
Tranexamic acid (TA), trans-4-aminomethyl cyclohexane carboxylic acid, is a hydrophilic agent used as an antifibrinolytic agent for over 30 years (Kanechorn Na Ayuthaya et al., 2012). The action mechanism of TA is still unclear. It is suggested that TA could inhibit UV induced plasmin activity in keratinocyte by preventing the binding of plasminogen to keratinocyte, which results in a less free arachidonic acid and diminished ability to produce prostaglandins and subsequently reduces melanogenesis in melanocyte (Maeda and Naganuma, 1998). In vitro studies with human melanocyte and keratinocyte cultures have revealed that TA inhibits melanin synthesis in melanocytes by interfering with the interaction of melanocytes and keratinocytes through the inhibition of plasminogen/plasmin system (Maeda and Tomita, 2007).
There were some reports revealed the efficacy of oral TA intake on melasma (Karn et al., 2012; Wu et al., 2012; Cho et al., 2013; Shin et al., 2013; Li et al., 2014). Topical formulation containing 2% TA has also showed the inhibitory effect on UV-induced hyperpigmentation, and 5% TA on melasma (Higashi, 2007; Maeda, 2003). Recently, the reduction of cutaneous vessel and mast cell number in the lesional skin of melasma was reported after oral and topical TA treatment, suggesting TA could reversely altered abnormal dermal structures in melasma (Na et al., 2013).
- 2 -
The aim of this study is to evaluate the efficacy of topical TA formulation in melasma treatment for 12 weeks and to examine its action mechanism by immunohistochemical study.
- 3 -
II. MATERIALS AND METHODS
A. Subjects
Healthy twenty three Korean women with melasma at age ranging from 34 to 60 were included in this study. The inclusion criteria were women aged from 30 to 60 years who are clinically diagnosed as melasma by two independent dermatologists. Exclusion criteria were as follows: individual who has other skin disorders on the face, has undergone any aesthetic medical procedures (iontophoresis, laser therapy, light therapy, chemical peeling) on face within one month prior to the study, had taken oral or locally injected TA for melasma treatment, or had used cosmetics with TA within 3 months prior to the study. This study was approved by the institutional review board of Ajou University Hospital (IRB number: AJIRB-BMR-OBS-13-223).
B. Protocol of topical TA application
Two kinds of topical TA, emulsion containing 2% TA and nonwoven fabric mask immersed skin lotion containing 2% TA, were used in this study. Other applied cosmetics were only skin lotion and sunscreen (SPF50, PA++++) which was provided by our institute to restrict other commercial cosmetics. Subjects were instructed for 12 weeks as follows: (i) should apply 0.4g (two pushes of the dispenser) of emulsion on the whole face twice a day (in the morning and evening) and massaged lightly until absorbed; (ii) apply mask three times a week on the face for 10 minutes then removed it, and massaged lightly until absorbed. C. Assessment of TA treatment efficacy
Standard photographs, the melasma severity scale (MSS), and the modified melasma area and severity index (mMASI) were recorded at baseline, 4, 8, and 12 week. The MSS is a kind of scale which is non-validated, simple, and easy-to-use categorical scale (0: none, 1: mild, 2: moderate, and 3: severe) (Taylor et al., 2003). The mMASI score is calculated by subjective assessment of two factors: area (A) of involvement, darkness (D), with the forehead (f), right malar region (rm), left malar region (lm), and chin (c), corresponding to 30%, 30%, 30%, and 10% of the total face, respectively. The area of involvement in each of these 4 areas is given a numeric value of 0 to 6 (0: no involvement, 1: < 10%, 2: 10% - 29%,
- 4 -
3: 30% - 49%, 4: 50% - 69%, 5: 70% - 89%, and 6: 90% - 100%). Darkness is rated on a scale from 0 to 4 (0: absent, 1: slight, 2: mild, 3: marked, and 4: maximum). The mMASI score is calculated by adding the sum of the severity rating for darkness, multiplied by the value of the area of involvement, for each of the 4 facial areas (Pandya et al., 2011). MSS and mMASI was measured by two dermatologists. Subjects were asked to answer a satisfaction questionnaire composed of 12 categories (melasma, whiteness, clarity, brightness, dullness, texture, dryness, luster, elasticity, moist, make-up, pore) for each visit and the results were converted to numeric scale (1: bad, 2: so-so, 3: good, 4: very good). Objectively, skin color of lesional and perilesional area was measured using chromameter (CR-300, MINOLTA, Japan) for each visit from baseline to 12 week. Values for lightness and erythema were exhibited L* and a*. The increased value of L* means the increased lightness and the increased value of a* represents increased erythema.
D. Histopathological and immunohistochemistrical analysis
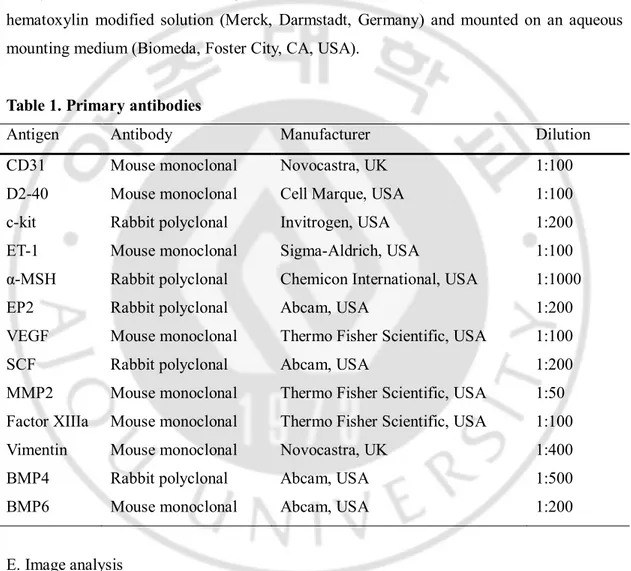
For histological analysis, 2-mm sized skin biopsy specimens were obtained from the lesional and perilesional normal skin of 10 subjects at baseline and at 12 week after treatment. All tissues were prepared after 10%-formalin fixation overnight for investigation under light microscopy. For the light microscopic study, 4.5-μm-thick paraffin-embedded tissue sections were processed. For the visualization of melanin pigmentation, Fontana-Masson stain was used without eosin background stain. The tissue sections were immunohistochemically stained through the horseradish peroxidase (HRP) polymer immunostain kit. They were incubated for 30 minutes in a solution of 0.5% hydrogen peroxidase in methanol to quench the endogenous peroxidase activity, and were then washed three times in tris-buffered saline (TBS, 0.1M, pH 7.4, Dako, Carpinteria, CA, USA). Afterwards, antigen retrieval was done using microwave method in citrate buffer at pH 6.0. Slides were washed three times in TBS, and the tissue sections were flooded with protein blocking agent (PBA, Immunon, Pittsburgh, PA, USA) for 10 minutes at room temperature to saturate non-specific protein-binding sites. Any excess PBA was drained, and the sections were flooded with the primary antibody; i.e. CD31, D2-40, c-kit, endothelin-1 (ET-1), α-melanocyte stimulating hormone (α-MSH), prostaglandin E2 receptor (EP2), VEGF, SCF, matrix metalloproteinase 2 (MMP2), factor XIIIa, vimentin, bone morphogenetic protein 4
- 5 -
(BMP4), BMP6 at specific dilutions (Table 1). The slides were then incubated for 1 hour at room temperature. Following three washes in TBS, the sections were incubated for 30 minutes at room temperature, flooded with primary antibody enhancer for 10 minutes at 37℃. The slides were then washed in TBS, followed by incubation in HRP polymer for 10 minutes at room temperature. After washes in TBS, the sections were incubated in 3-amino-9-ethylcarbazole (AEC) chromogen for 15 minutes. They were counter-stained with hematoxylin modified solution (Merck, Darmstadt, Germany) and mounted on an aqueous mounting medium (Biomeda, Foster City, CA, USA).
Table 1. Primary antibodies
Antigen Antibody Manufacturer Dilution
CD31 Mouse monoclonal Novocastra, UK 1:100
D2-40 Mouse monoclonal Cell Marque, USA 1:100
c-kit Rabbit polyclonal Invitrogen, USA 1:200
ET-1 Mouse monoclonal Sigma-Aldrich, USA 1:100
α-MSH Rabbit polyclonal Chemicon International, USA 1:1000
EP2 Rabbit polyclonal Abcam, USA 1:200
VEGF Mouse monoclonal Thermo Fisher Scientific, USA 1:100
SCF Rabbit polyclonal Abcam, USA 1:200
MMP2 Mouse monoclonal Thermo Fisher Scientific, USA 1:50 Factor XIIIa Mouse monoclonal Thermo Fisher Scientific, USA 1:100
Vimentin Mouse monoclonal Novocastra, UK 1:400
BMP4 Rabbit polyclonal Abcam, USA 1:500
BMP6 Mouse monoclonal Abcam, USA 1:200
E. Image analysis
A digital camera (SPOT Flex, SPOT imaging Solutions, Sterling Heights, MI, USA) mounted on a microscope (BX50, OLYMPUS, Japan) was connected to a computer. The image signals were evaluated using Image Pro Plus Version 4.5 (Media Cybernetics Co., Silver Spring, MD, USA). On the representative area of each specimen, image analysis was performed. Each measurement was performed under constant magnification (original
- 6 -
magnification, x 200). The amount of pigmentation was determined by ratio of the pigmented area to the measured epidermal area (PA/EA) using Fontana-Masson stained specimens. The values of vascularity and mast cell were determined by ratio of the stained area to dermal area (SA/DA) within 200 μm from the epidermal-dermal junction using CD31, D2-40, and c-kit stained specimens. The expressions of other immunohistochemical staining were determined by ratio of the stained area to measured epidermal area (SA/EA) or dermal area (SA/DA).
F. Statistical analysis
Data were expressed as mean values and their standard deviation (SD). Sequential changes of data were analysed using a paired t-test. The possibility value of less than 0.05 was considered as statistically significant.
- 7 -
III. RESULTS
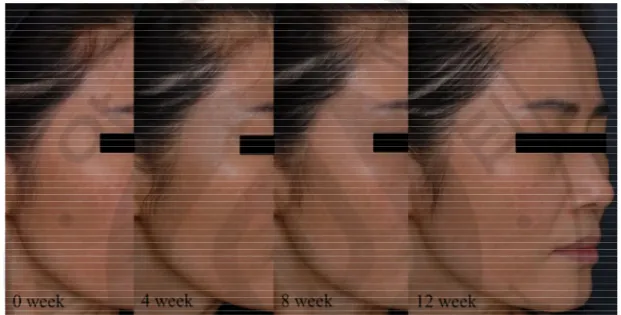
A. Clinical assessment of TA treatment efficacy 1. Clinical photographsAfter 12-week topical TA application, the degree of pigmentation and erythema was improved compared with baseline in 22 of 23 patients (Fig. 1).
Fig. 1. Clinical photographs from 0 week to 12 week after topical TA application. The
gradual decrease of pigmentation and erythema was noted in 22 of 23 patients after 12-week use of topical TA.
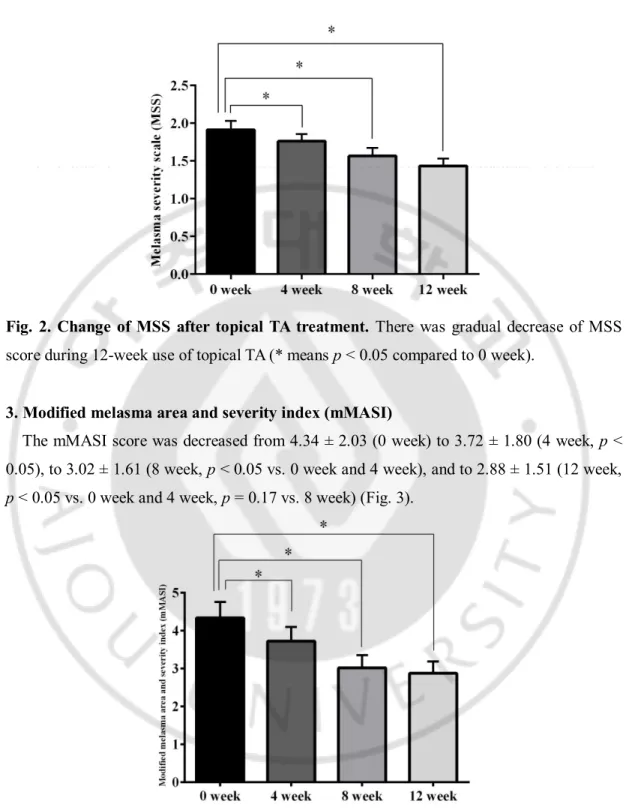
2. Melasma severity scale (MSS)
The MSS score was decreased from 1.91 ± 0.56 (0 week) to 1.76 ± 0.45 (4 week, p < 0.05), to 1.57 ± 0.51 (8 week, p < 0.05 vs. 0 week and 4 week), and to 1.43 ± 0.46 (12 week, p < 0.05 vs. 0 week, 4 week, and 12 week) (Fig. 2).
- 8 -
Fig. 2. Change of MSS after topical TA treatment. There was gradual decrease of MSS
score during 12-week use of topical TA (* means p < 0.05 compared to 0 week).
3. Modified melasma area and severity index (mMASI)
The mMASI score was decreased from 4.34 ± 2.03 (0 week) to 3.72 ± 1.80 (4 week, p < 0.05), to 3.02 ± 1.61 (8 week, p < 0.05 vs. 0 week and 4 week), and to 2.88 ± 1.51 (12 week, p < 0.05 vs. 0 week and 4 week, p = 0.17 vs. 8 week) (Fig. 3).
Fig. 3. Change of mMASI after topical TA treatment. There was gradual decrease of
- 9 -
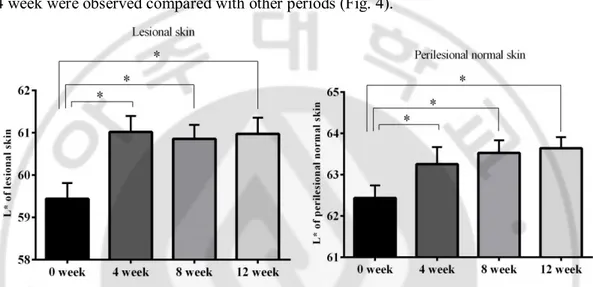
4. Chromameter
The mean L* value of both lesional and perilesional skin was significantly increased 4 weeks after treatment compared with baseline, and the values were maintained in lesional skin and continuously increased in perilesional skin through the rest follow-up period (lesional, 0 week vs. 4 week, 59.44 ± 1.78 vs. 61.02 ± 1.81, p < 0.05; perilesional, 0 week vs. 4 week, 62.44 ± 1.46 vs. 63.25 ± 1.98, p < 0.05). Only marked increase between 0 week and 4 week were observed compared with other periods (Fig. 4).
Fig. 4. Change of L* value after topical TA treatment. The mean L* value of both lesional
and perilesional skin was significantly increased 4 weeks after treatment compared with baseline, and the values were maintained in lesional skin and continuously increased in perilesional skin through the rest follow-up period (* means p < 0.05 compared to 0 week).
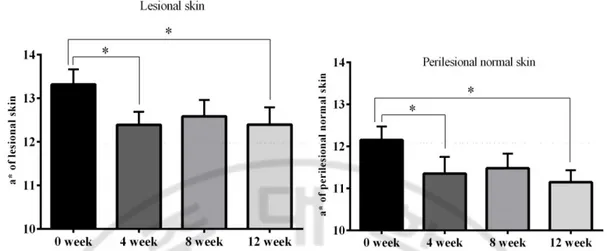
The mean a* value of both lesional and perilesional skin was significantly decreased 4 weeks after treatment compared with baseline, and the values were maintained in lesional and perilesional skin through the rest follow-up period (lesional, 0 week vs. 4 week, 13.32 ± 1.65 vs. 12.39 ± 1.43, p < 0.05; perilesional, 0 week vs. 4 week, 12.15 ± 1.54 vs. 11.35 ± 1.92, p < 0.05). Only marked decrease between 0 week and 4 week were observed compared with other periods (Fig. 5).
- 10 -
Fig. 5. Change of a* value after topical TA treatment. The mean a* value of both lesional
and perilesional skin was significantly decreased 4 weeks after treatment compared with baseline, and the decreased values were sustained both in lesional and perilesional skin through the rest follow-up period (* means p < 0.05 compared to 0 week).
5. Subjective satisfaction score
The subjective satisfaction score was significantly increased 4 weeks after treatment compared with baseline, and the values were slightly increased through the rest follow-up period (0 week vs. 4 week, 1.94 ± 0.43 vs. 2.27 ± 0.55, p < 0.05). Only marked increase between 0 week and 4 week were observed compared with other periods (Fig. 6).
Fig. 6. Change of subjective satisfaction score after topical TA treatment. The subjective
satisfaction score was significantly increased 4 weeks after treatment compared with baseline, and the values were slightly increased through the rest follow-up period (* means p < 0.05 compared to 0 week).
- 11 -
B. Histological analysis 1. Pigmentation
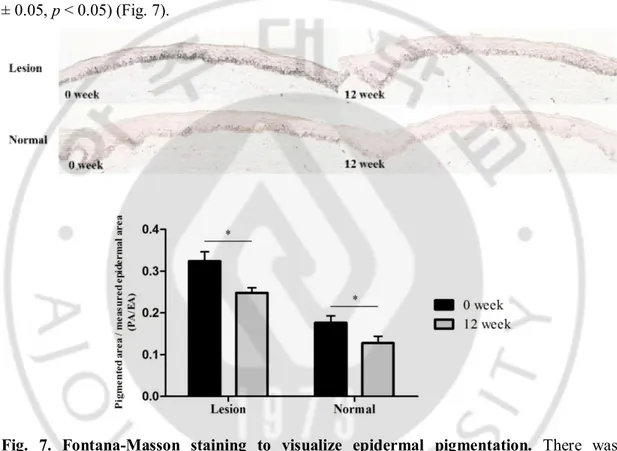
Pigmentation was visualized with Fontana-Masson staining. The epidermal pigment in the lesional skin significantly decreased on 12 week compared with 0 week (PA/EA, 0 week vs. 12 week, 0.32 ± 0.07 vs. 0.25 ± 0.04, p < 0.05). Also, the epidermal pigment of perilesional normal skin showed the similar tendency (PA/EA, 0 week vs. 12 week, 0.18 ± 0.05 vs. 0.13 ± 0.05, p < 0.05) (Fig. 7).
Fig. 7. Fontana-Masson staining to visualize epidermal pigmentation. There was
significant decrease of epidermal pigmentation in both lesional and perilesional normal skin after 12-week use of topical TA (original magnification, x 200).
2. Vascularity
Vascularity was visualized with CD31 expression for vessel and with D2-40 expression for lymphatics in dermis. The expression of CD31 in the lesional skin decreased on 12 week compared with 0 week (SA/DA, 0 week vs. 12 week, 0.009 ± 0.003 vs. 0.007 ± 0.002, p = 0.053). Also, its expression of perilesional normal skin showed the similar tendency (SA/DA, 0 week vs. 12 week, 0.006 ± 0.004 vs. 0.005 ± 0.003, p = 0.46), though statistically not
- 12 - significant (Fig. 8).
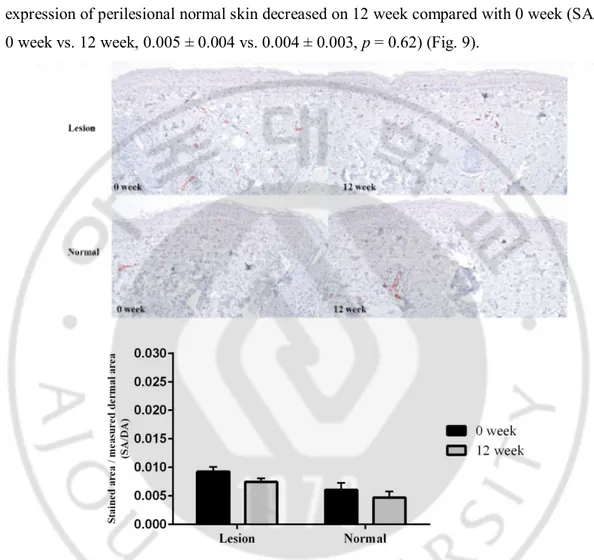
The expression of D2-40 in the lesional skin increased on 12 week compared with 0 week (SA/DA, 0 week vs. 12 week, 0.004 ± 0.003 vs. 0.005 ± 0.002, p = 0.56). However, its expression of perilesional normal skin decreased on 12 week compared with 0 week (SA/DA, 0 week vs. 12 week, 0.005 ± 0.004 vs. 0.004 ± 0.003, p = 0.62) (Fig. 9).
Fig. 8. CD31 expression of dermis after topical TA treatment. There was decrease of
expression in the dermis of both lesional and perilesional normal skin after 12-week use of topical TA, though statistically not significant (original magnification, x 200).
- 13 -
Fig. 9. D2-40 expression of dermis after topical TA treatment. There was no significant
change of D2-40 expression in the dermis of both lesional and perilesional normal skin after 12-week use of topical TA (original magnification, x 200).
3. Mast cell
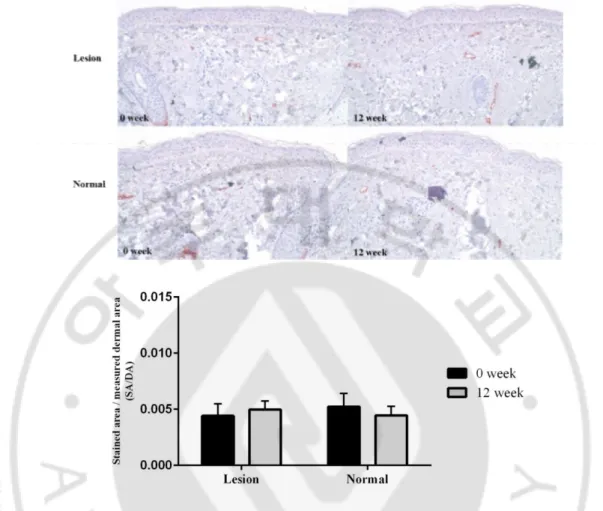
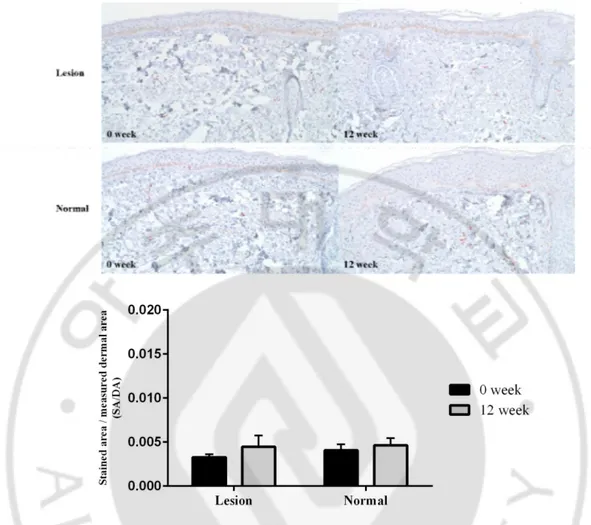
Mast cell was visualized with c-kit expression in dermis. The expression of c-kit in the lesional skin increased on 12 week compared with 0 week (SA/DA, 0 week vs. 12 week, 0.003 ± 0.001 vs. 0.004 ± 0.004, p = 0.45). Also, its expression of perilesional normal skin showed the similar tendency (SA/DA, 0 week vs. 12 week, 0.004 ± 0.002 vs. 0.005 ± 0.003, p = 0.67), though statistically not significant (Fig. 10).
- 14 -
Fig. 10. C-kit expression of dermis after topical TA treatment. There was increase of c-kit
expression in the dermis of both lesional and perilesional normal skin after 12-week use of topical TA, though statistically not significant (original magnification, x 200).
4. Other immunohistochemical results
The expression of ET-1 in the epidermis of lesional skin significantly decreased on 12 week compared with 0 week (SA/EA, 0 week vs. 12 week, 0.21 ± 0.09 vs. 0.13 ± 0.04, p < 0.05). Also, its expression of perilesional normal skin showed the similar tendency (SA/EA, 0 week vs. 12 week, 0.17 ± 0.08 vs. 0.07 ± 0.04, p < 0.05) (Fig. 11).
- 15 -
Fig. 11. ET-1 expression of epidermis after topical TA treatment. There was significant
decrease of ET-1 expression in the epidermis of both lesional and perilesional normal skin after 12-week use of topical TA (original magnification, x 200).
The expression of α-MSH in the epidermis of lesional skin increased on 12 week compared with 0 week (SA/EA, 0 week vs. 12 week, 0.14 ± 0.06 vs. 0.15 ± 0.08, p = 0.88). Also, its expression of perilesional normal skin showed the similar tendency (SA/EA, 0 week vs. 12 week, 0.11 ± 0.06 vs. 0.15 ± 0.07, p = 0.26) (Fig. 12).
- 16 -
Fig. 12. α-MSH expression of epidermis after topical TA treatment. There was increase
of expression in the epidermis of both lesional and perilesional normal skin after 12-week use of topical TA, though statistically not significant (original magnification, x 200).
The expression of EP2 in the epidermis of lesional skin decreased on 12 week compared with 0 week (SA/EA, 0 week vs. 12 week, 0.006 ± 0.008 vs. 0.004 ± 0.003, p = 0.51). However, its expression of perilesional normal skin increased on 12 week compared with 0 week (SA/EA, 0 week vs. 12 week, 0.004 ± 0.003 vs. 0.005 ± 0.004, p = 0.57) (Fig. 13).
- 17 -
Fig. 13. EP2 expression of epidermis after topical TA treatment. There was no significant
change of expression in the epidermis of both lesional and perilesional normal skin after 12-week use of topical TA (original magnification, x 200).
The expression of VEGF in the epidermis of lesional skin decreased on 12 week compared with 0 week (SA/EA, 0 week vs. 12 week, 0.10 ± 0.06 vs. 0.06 ± 0.04, p = 0.15). Also, its expression of perilesional normal skin showed the similar tendency (SA/EA, 0 week vs. 12 week, 0.06 ± 0.05 vs. 0.03 ± 0.03, p = 0.23), though statistically not significant (Fig. 14).
- 18 -
Fig. 14. VEGF expression of epidermis after topical TA treatment. There was decrease of
expression in the epidermis of both lesional and perilesional normal skin after 12-week use of topical TA, though statistically not significant (original magnification, x 200).
The expression of SCF in the epidermis of lesional skin significantly decreased on 12 week compared with 0 week (SA/EA, 0 week vs. 12 week, 0.30 ± 0.09 vs. 0.19 ± 0.10, p < 0.05). Also, its expression of perilesional normal skin showed the similar tendency (SA/EA, 0 week vs. 12 week, 0.14 ± 0.11 vs. 0.11 ± 0.07, p = 0.54), though statistically not significant (Fig. 15).
- 19 -
Fig. 15. SCF expression of epidermis after topical TA treatment. There was decrease of
expression in the epidermis of both lesional and perilesional normal skin after 12-week use of topical TA, though statistically not significant in perilesional normal skin (original magnification, x 200).
- 20 -
IV. DISCUSSION
TA is widely considered as one of the treatment options for melasma. In 1979, its role in melasma was first demonstrated (Sadako, 1979). Afterwards, many clinical studies with oral TA treatment showed favorable responses in melasma. Other forms of TA administration for melasma also have been investigated. Weekly intradermal injections of TA (Lee et al., 2006), ionotophoresis of TA using chemical enhancer and constant electric current (Todo and Sugibayashi, 2012), and topical TA in liposome formulation was also introduced (Manosroi et al., 2002). Until now, only two clinical studies using topical TA has been reported (Kanechorn Na Ayuthaya et al., 2012; Na et al., 2013). However, the histopathologic analysis was not available in the study of Kanechom Na Ayuthaya et al. and the concurrent use of oral and topical TA in the study of Na et al. could not demonstrate the independent effect of topical TA in melasma. In our study, we investigated the independent effect of topical TA treatment on melasma with histopathologic analysis. Several findings were noted and discussed below.
First, with clinical assessment, time-sequential improvement of MSS and mMASI were noted, especially significant during the first 8 week. However, the additional improvement was minimal after 8 week. Consistent with the change of MSS and mMASI score, subjective satisfaction score showed the similar tendency during 12 weeks. With chromameter measurement, the significant improvement of the value of L* and a* in lesional skin was observed during the first 4 week and maintained as improved state during rest follow-up period. Therefore, it is speculated that the clinical efficacy of topical TA in melasma is maximized within first 4 week and the improvement was maintained through 12 weeks. According to the previous report, most of the oral TA effect was noted within 4 weeks of treatment (Sadako, 1979). Furthermore, it is reported that 33% of patients started to have clinical response in the first month of oral TA treatment, and 33% more showed improvement after the second month (Wu et al., 2012). Although these studies were performed using oral TA, the results were relatively comparable to our results. It is explained that TA has a limitation of binding capacity in that TA reversibly blocks lysine binding sites on plasminogen molecules (Tse and Hui, 2013).
- 21 -
Contrary to our result, TA rather increased pigmentation of the perilesional skin from 0 week to 4 week, and to 8 week in previous report (Na et al., 2013). They suggested the darkening of perilesional skin is affected by seasonal changes, from spring to summer (Na et al., 2013). However, in our study, the L* and a* value indicated that the perilesional normal skin after treatment became brighter than those of baseline status, which showed a similar pattern to those of lesional skin. Considering our result, topical TA might effect on perilesional normal skin as well as lesional skin of melasma. Also, the aggravated erythema at 12 weeks on TA-treated site was reported previously (Kanechorn Na Ayuthaya et al., 2012), however, our result showed no worsening in erythema, although no further improvement was shown in the erythema index after 4 week. No other significant adverse effects, such as irritation were reported except mild dryness in some subjects.
Secondly, with histological analysis, we focused on three main factors i.e., pigmentation, vascularity, and mast cell. Consistent with our clinical assessment and previous report, the epidermal pigmentation significantly reduced in both lesional and perilesional normal skin. It has been known that TA could suppress the process of angiogenesis as well as induce the melanogenesis in melanocytes (Kal et al., 2004; Na et al., 2013). It was reported that TA also inhibits the neovascularization induced by basic fibroblast growth factor (bFGF) (Kal et al., 2004). The positive correlation between the induction of pigmentation and increase of dermal blood vessels in lesional skin of melasma was suggested (Kim et al., 2007), and the significant decrease of vessel numbers as well as the reduction of pigmentation during TA treatment was also reported (Na et al., 2013). In this study, the decreased CD31-stained blood vessel in dermis was observed in lesional and perilesional normal skin after topical TA treatment, though not statistically significant. In terms of mast cells, which were more prominent in the elastotic areas of melasma skin (Hernandez-Barrera et al., 2008), significantly decreased number of mast cells was observed after 8-week use of oral and topical TA (Na et al., 2013). However, there was little difference in the number of c-kit-stained mast cell after topical TA treatment in our study. Taken together, topical TA treatment could reduce the epidermal pigmentation, although their effect on dermal environment showed limited, compared with oral TA.
Thirdly, our data showed the significant decrease of ET-1 expression after treatment in epidermis of both lesional and perilesional normal skin. It has been reported that paracrine
- 22 -
linkages among keratinocytes, fibroblasts, and melanocytes play important roles in regulating epidermal pigmentation. In response to various stimuli, human keratinocytes secrete various cytokines that serve as mitogens or melanogens for human melanocytes, including ET-1, α-MSH, and SCF (Imokawa et al., 1992; Morita et al., 1994). Among them, ET-1 can trigger melanogenesis via the MITF-regulated GPNMB pathway and plays an indispensable role in epidermal pigmentation in hyperpigmentary disorders (Zhang et al., 2013). We demonstrated the significant decrease of ET-1 expression in the epidermis of both lesional and perilesional normal skin. Also, the expression of SCF, one of the cytokines secreted by human keratinocytes and human fibroblasts (Imokawa et al., 1998), was significantly decreased after treatment in the epidermis of lesional skin. However, there was no significant difference in the expression of α-MSH after treatment in both lesional and perilesional normal skin. Therefore, our data is speculated that both ET-1 and SCF might play an important role in action mechanism of TA on melasma. TA is known to suppress the production of prostaglandins, and subsequent UV-induced melanogenesis through the suppression of the epidermal plasmin activity. Lesser free arachidonic acids and depleted production of prostaglandins result in the reduction of tyrosinase activity in melanocytes (Maeda and Naganuma, 1998; Maeda and Tomita, 2007). However, there was no significant difference in the expression of EP2 after treatment in both lesional and perilesional normal skin. Also, human melanocytes may respond to angiogenic factors because normal human melanocytes express functional VEGF receptors (Kim et al., 2005), and the expression of VEGF was significantly increased in melasma (Kim et al., 2007). In contrary, the expression of VEGF after treatment showed minimal difference. It is suggested that dermal structures were not affected by topical TA possibly because of their low penetration into the dermis.
- 23 -
V. CONCLUSION
With topical TA treatment for 12 weeks, we demonstrated that the significant improvement of MSS and mMASI scores and subjective satisfaction score, and confirmed by chromameter. With histological analysis, the epidermal pigmentation was decreased significantly in the lesional skin, and even in perilesional normal skin of melasma. With immunohistochemical analysis, only ET-1 and SCF expression of epidermis were reduced significantly after TA treatment. However, dermal vascularity, number of mast cells, and VEGF expression of epidermis showed minimal changes. These findings suggest that the expected mechanism of topical TA might be responsible for modulating epidermal environment rather than dermal environment.
- 24 -
REFERENCES
1. Cho HH, Choi M, Cho S, Lee JH: Role of oral tranexamic acid in melasma patients treated with IPL and low fluence QS Nd:YAG laser. J Dermatolog Treat 24: 292-296, 2013
2. Hernandez-Barrera R, Torres-Alvarez B, Castanedo-Cazares JP, Oros-Ovalle C, Moncada B: Solar elastosis and presence of mast cells as key features in the pathogenesis of melasma. Clin Exp Dermatol 33: 305-308, 2008
3. Higashi N: Clinical study of tranexamic acid cream on melasma: A multi-center double blind trial. Skin Res 6: 649-652, 2007
4. Imokawa G, Yada Y, Miyagishi M: Endothelins secreted from human keratinocytes are intrinsic mitogens for human melanocytes. J Biol Chem 267: 24675-24680, 1992 5. Imokawa G, Yada Y, Morisaki N, Kimura M: Biological characterization of human
fibroblast-derived mitogenic factors for human melanocytes. Biochem J 330 ( Pt 3): 1235-1239, 1998
6. Kal HB, Struikmans H, Gebbink MF, Voest EE: Response of rat prostate and lung tumors to ionizing radiation combined with the angiogenesis inhibitor AMCA. Strahlenther Onkol 180: 798-804, 2004
7. Kanechorn Na Ayuthaya P, Niumphradit N, Manosroi A, Nakakes A: Topical 5% tranexamic acid for the treatment of melasma in Asians: a double-blind randomized controlled clinical trial. J Cosmet Laser Ther 14: 150-154, 2012
8. Kang HY, Hwang JS, Lee JY, Ahn JH, Kim JY, Lee ES, Kang WH: The dermal stem cell factor and c-kit are overexpressed in melasma. Br J Dermatol 154: 1094-1099, 2006
9. Kang WH, Yoon KH, Lee ES, Kim J, Lee KB, Yim H, Sohn S, Im S: Melasma: histopathological characteristics in 56 Korean patients. Br J Dermatol 146: 228-237, 2002
10. Karn D, Kc S, Amatya A, Razouria EA, Timalsina M: Oral tranexamic acid for the treatment of melasma. Kathmandu Univ Med J (KUMJ) 10: 40-43, 2012
- 25 - Dermatol Sci 46: 111-116, 2007
12. Kim EJ, Park HY, Yaar M, Gilchrest BA: Modulation of vascular endothelial growth factor receptors in melanocytes. Exp Dermatol 14: 625-633, 2005
13. Lee JH, Park JG, Lim SH, Kim JY, Ahn KY, Kim MY, Park YM: Localized intradermal microinjection of tranexamic acid for treatment of melasma in Asian patients: a preliminary clinical trial. Dermatol Surg 32: 626-631, 2006
14. Li Y, Sun Q, He Z, Fu L, He C, Yan Y: Treatment of melasma with oral administration of compound tranexamic acid: a preliminary clinical trial. J Eur Acad Dermatol Venereol 28: 393-394, 2014
15. Maeda K: The mechanism of ultraviolet B radiation-induced skin pigmentation and the effect of topical t-AMCHA on the pigmentation. Flavour Fragr J 18: 42-49, 2003
16. Maeda K, Naganuma M: Topical trans-4-aminomethylcyclohexanecarboxylic acid prevents ultraviolet radiation-induced pigmentation. J Photochem Photobiol B 47: 136-141, 1998
17. Manosroi A, Podjanasoonthon K, Manosroi J: Development of novel topical tranexamic acid liposome formulations. Int J Pharm 235: 61-70, 2002
18. Morita E, Lee DG, Sugiyama M, Yamamoto S: Expression of c-kit ligand in human keratinocytes. Arch Dermatol Res 286: 273-277, 1994
19. Na JI, Choi SY, Yang SH, Choi HR, Kang HY, Park KC: Effect of tranexamic acid on melasma: a clinical trial with histological evaluation. J Eur Acad Dermatol Venereol 27: 1035-1039, 2013
20. Pandya AG, Hynan LS, Bhore R, Riley FC, Guevara IL, Grimes P, Nordlund JJ, Rendon M, Taylor S, Gottschalk RW, Agim NG, Ortonne JP: Reliability assessment and validation of the Melasma Area and Severity Index (MASI) and a new modified MASI scoring method. J Am Acad Dermatol 64: 78-83, 83 e71-72, 2011
21. Sadako N: Treatment of melasma with tranexamid acid. The Clin Rep 13: 3129-3131, 1979
22. Sarkar R, Arora P, Garg VK, Sonthalia S, Gokhale N: Melasma update. Indian Dermatol Online J 5: 426-435, 2014
low-- 26 low--
fluence 1064-nm quality-switched neodymium-doped yttrium aluminum garnet laser treatment for melasma in Koreans: a randomized, prospective trial. Dermatol Surg 39: 435-442, 2013
24. Taylor SC, Torok H, Jones T, Lowe N, Rich P, Tschen E, Menter A, Baumann L, Wieder JJ, Jarratt MM, Pariser D, Martin D, Weiss J, Shavin J, Ramirez N: Efficacy and safety of a new triple-combination agent for the treatment of facial melasma. Cutis 72: 67-72, 2003
25. Torres-Alvarez B, Mesa-Garza IG, Castanedo-Cazares JP, Fuentes-Ahumada C, Oros-Ovalle C, Navarrete-Solis J, Moncada B: Histochemical and immunohistochemical study in melasma: evidence of damage in the basal membrane. Am J Dermatopathol 33: 291-295, 2011
26. Tse TW, Hui E: Tranexamic acid: an important adjuvant in the treatment of melasma. J Cosmet Dermatol 12: 57-66, 2013
27. Wu S, Shi H, Wu H, Yan S, Guo J, Sun Y, Pan L: Treatment of melasma with oral administration of tranexamic acid. Aesthetic Plast Surg 36: 964-970, 2012
28. Zhang P, Liu W, Yuan X, Li D, Gu W, Gao T: Endothelin-1 enhances the melanogenesis via MITF-GPNMB pathway. BMB Rep 46: 364-369, 2013
- 27 -
SUPPLEMENT
Appendix 1. Verhoeff-Van Gieson staining (SA/DA)Normal Lesion
0 week 0.18±0.06 0.30±0.18
12 week 0.29±0.10* 0.29±0.12
* p < 0.05 compared to 0 week
Appendix 2. MMP2 expression of dermis after topical TA treatment
Normal Lesion
0 week 0.0058±0.0056 0.0090±0.0069
- 28 -
Appendix 3. Factor XIIIa expression of dermis after topical TA treatment
Normal Lesion
0 week 0.0072±0.0024 0.0063±0.0027
12 week 0.0077±0.0023 0.0094±0.0041
Appendix 4. Vimentin expression of dermis after topical TA treatment
Normal Lesion
0 week 0.0394±0.0185 0.0371±0.0182
12 week 0.0344±0.0131 0.0427±0.0190
- 29 -
Normal Lesion
0 week 0.0117±0.0199 0.0043±0.0052
12 week 0.0042±0.0045 0.0123±0.0112*
* p < 0.05 compared to 0 week
Appendix 6. BMP4 expression of dermis after topical TA treatment
Normal Lesion
0 week 0.0016±0.0027 0.0054±0.0075
12 week 0.0009±0.0013 0.0010±0.0006
Appendix 7. BMP6 expression of epidermis after topical TA treatment
Normal Lesion
0 week 0.0216±0.0163 0.0375±0.0304
- 30 -
Appendix 8. BMP6 expression of dermis after topical TA treatment
Normal Lesion
0 week 0.0002±0.0002 0.0002±0.0003
- 31 - - 국문요약 -