저작자표시-비영리-변경금지 2.0 대한민국 이용자는 아래의 조건을 따르는 경우에 한하여 자유롭게 l 이 저작물을 복제, 배포, 전송, 전시, 공연 및 방송할 수 있습니다. 다음과 같은 조건을 따라야 합니다: l 귀하는, 이 저작물의 재이용이나 배포의 경우, 이 저작물에 적용된 이용허락조건 을 명확하게 나타내어야 합니다. l 저작권자로부터 별도의 허가를 받으면 이러한 조건들은 적용되지 않습니다. 저작권법에 따른 이용자의 권리는 위의 내용에 의하여 영향을 받지 않습니다. 이것은 이용허락규약(Legal Code)을 이해하기 쉽게 요약한 것입니다. Disclaimer 저작자표시. 귀하는 원저작자를 표시하여야 합니다. 비영리. 귀하는 이 저작물을 영리 목적으로 이용할 수 없습니다. 변경금지. 귀하는 이 저작물을 개작, 변형 또는 가공할 수 없습니다.
The role of CD4+CD25+ regulatory T cells in
Herpes Simplex Virus-induced
Behcet's Disease-like mouse model
by
Ju A Shim
Major in Molecular Medicine
Department of Biomedical Sciences
The Graduate School, Ajou University
The role of CD4+CD25+ regulatory T cells in
Herpes Simplex Virus-induced
Behcet's Disease-like mouse model
by
Ju A Shim
A Dissertation Submitted to The Graduate School of Ajou University
in Partial Fulfillment of the Requirements for the Degree of
Master of Biomedical Sciences
Supervised by
SeongHyang Sohn, Ph.D.
Major in Molecular Medicine
Department of Biomedical Sciences
The Graduate School, Ajou University
This certifies that the dissertation
of Ju A Shim is approved.
SUPERVISORY COMMITTEE
SeongHyang Sohn
Eun-So Lee
Sun Park
The Graduate School, Ajou University
December, 22th, 2008
ABSTRACT
-The role of CD4+CD25+ regulatory T cells in Herpes Simplex
Virus-induced Behcet’s Disease-like mouse model
Background: Behcet's disease (BD) is a chronic, multi-systemic disorder with arthritic,
gastrointestinal, mucocutaneous, ocular, vascular, and central nervous systems involved. CD4+CD25+ T regulatory (Treg) cells prevent harmful immune responses to self and non-self antigens. Treg cells play a crucial role in controlling and preventing autoimmunity. In this study, we investigated the role of Treg cells in BD-like mouse models.
Methods: Herpes simplex virus (HSV) type 1 inoculation of the earlobes of ICR mice
resulted in the development of BD-like symptoms. CD4+CD25+T cells in splenocytes of normal mice were adoptively transferred by intravenous injection to BD-like mice. We observed changes of pathologic manifestations during the 2 weeks after injection with CD4+CD25+T cells in BD-like mice. As a control, we transferred CD4+CD25-T cells to BD-like mice. Two weeks after injection, sera and splenocytes were collected. We analyzed TGF-β, IL-10, IFN-γ, TNF-α, IL-17, and IL-6 levels by ELISA or RT-PCR and also the frequency of Treg cells by FACS.
compared to the transferred of 3x10³and 3x10⁴CD4+CD25+T cells. We also observed the
improvement of symptoms in BD-like mice after adoptive transfer with 3x10⁵ of
CD4+CD25+T cells. And adoptive transfer with 3x10³CD4+CD25+T cells or
CD4+CD25-T cells did not affect the symptoms of BD-like mice. Also, protein level IL-10 was
significantly increased in transferred with 3x10⁵ CD4+CD25+T cells in BD-like mice
compared to not transferred BD-like mice (156.2 ± 80.1 vs 75.3 ± 48.5 pg/ml, p=0.03) or
transferred with 3x10⁴ CD4+CD25+T cells to BD-like mice (156.2 ± 80.1 vs 54.8 ± 67.8
pg/ml, p=0.04). Protein levels of IL-6 and IL-17 were significantly decreased after transfer
with 3x10⁵ CD4+CD25+T cells to BD-like mice compared to the not transferred BD-like
mice (IL-6: 39.2 ± 50.8 vs 215.6 ± 133.3 pg/ml, p=0.0002; IL-17: 19.1 ± 20.0 vs 38.0 ± 20.5 pg/ml, p=0.03). mRNA expression showed similar results with protein levels of TGF-β, TNF-α, IFN-γ, IL-6, and IL-17.
Conclusion: We confirmed the influence of CD4+CD25+T cells on BD-like mice. These
results show up-regulation of CD4+CD25+T cells to BD-like mice improved the
inflammatory symptoms and change of cytokine levels.We showed that CD4+CD25+T cells
alleviated the inflammation induced by autoimmune or autoinflammatory T cells.
Key words: Regulatory T cells, Herpes simplex virus-induced systemic inflammation,
TABLE OF CONTENTS
ABSTRACT ··· ⅰ TABLE OF CONTENTS ··· ⅲ LIST OF FIGURE ··· ⅴ LIST OF TABLES ··· ⅶ Ⅰ. INTRODUCTION ··· 1Ⅱ. MATERIALS AND METHODS ··· 4
A. Antibodies and reagents ··· 4
B. Animal experiments··· 4
C. BD-like symptoms ··· 4
D. Flow cytometry ··· 5
E. Splenocyte culture and generation of Treg cells ··· 5
F. Dendritic cells isolation and culture ··· 6
G. Co-culture of CD4+T cells with DCs ··· 6
H. Isolation of CD4+CD25+T cells ··· 7
I. Adoptive transfer of CD4+CD25+T and CD4+CD25-T cells to BD-like mice ··· 7
A. CD4+CD25+ Treg cells in BD-like mice compared to BDN mice ··· 11
B. CD4+CD25+T cells were amplified in primary cultures of spleen tissues ··· 13
C. CD4+T cells from normal, BDN, and BD-like splenocytes were co-cultured with normal dendritic cells from normal mice ··· 17
D. Adoptive transfer with CD4+CD25+T cells up-regulated the frequencies of T cell in BD-like mice ··· 21
E. Change of symptoms in BD-like mice after adoptive transfer ··· 25
F. The change of severity score in transferred with CD4+CD25+T cells to BD-like mice ··· 28
G. CD4+CD25+T cells transfer up-regulated serum IL-10 and TGF-β levels and down-regulated IFN-γ and TNF-α levels ··· 31
H. Serum IL-6 and IL-17 levels were down-regulated after transfer ··· 34
I. The differences of serum cytokine amounts between the average of not transferred BD-like mice and 3x10⁵CD4+CD25+T cells transferred each BD-like mouse ··· 39
Ⅳ. DISCUSSION ··· 45
Ⅴ. CONCLUSION ··· 49
REFERENCES ··· 50
LIST OF FIGURES
Fig. 1. The frequencies of CD4+CD25+T and Treg cells in splenocytes of BDN
and BD-like mice was compared by FACS analysis ··· 12
Fig. 2. CD4+CD25+T cells were amplified in primary cultures of
splenocytes and amplified range was different among normal, BDN,
and BD-like mice ··· 15
Fig. 3. CD4+T cells from normal, BDN, and BD-like splenocytes were co-cultured with dendritic cells from normal mice and DC from normal, BDN, and BD-like splenocytes were co-cultured with
CD4+T cells from normal mice.··· 19
Fig. 4. CD4+CD25+T cells cultured and proliferated from normal splenocytes were isolated by MACS ··· 22
Fig. 5. The frequencies of CD4+CD25+T and Treg cell in the
Fig. 7. The comparison of the severity score before and after transfer of
CD4+CD25+T or CD4+CD25-T cells in BD-like mice ··· 30
Fig. 8. Protein and mRNA levels of cytokines were compared between BD-like mice and CD4+CD25+T cells transferred BD-like mice ··· 36
Fig. 9. The differences of serum cytokine amounts between the average of
not transferred BD-like mice and 3x10⁵CD4+CD25+T cell transferred each
BD-like mice by ELISA. The difference is displayed separately in BD skin symptomatic mice (BD skin) and BD ocular symptomatic mice with
LISIT of TABLES
Table 1. The sequence of primers used for RT-PCR ··· 9
Table 2. The change of symptoms after CD4+CD25+T cell transfer in
BD-like mice ··· 28
Table 3. The serum cytokine level from each CD4+CD25+T cells transferred BD-like mice and the difference of between CD4+CD25+T cells
Ⅰ. INTRODUCTION
Behcet’s Disease (BD) is a chronic, multi-systemic disorder with arthritic, gastrointestinal, mucocutaneous, ocular, vascular, and central nervous system involved. This disease takes a chronic course with periodic exacerbations and progressive deterioration (Zouboulis, et al., 2000; Choi, et al., 2008). The etiology of BD is unclear, but viral infection has long been postulated as one of the main factors. Since Hulusi Behcet first proposed a viral etiology (Seçkin, et al., 1995), the viral hypothesis has been verified by detection of virus in saliva (Müftüoğlu, et al., 1986), intestinal ulcers (al-Dalaan, et al., 1995), and genital ulcers (Katsantonis, et al., 2000; Sayinalp, et al., 1996) of patients with BD. Subsequent to these findings, herpes simplex virus (HSV) inoculation of the earlobes of ICR mice resulted in the development of BD-like symptoms (Sohn, et al., 1998). Manifestations in mice after HSV inoculation included multiple symptoms such as oral ulcers, genital ulcers, skin ulcers, eye symptoms, gastrointestinal ulcers, arthritis, and neural involvement, as well as skin crusting. The frequencies of these symptoms are similar to that of patients with BD (Adam, et al., 2004).
Sakaguchi identified a subpopulation of CD4+T cells constitutively expressing the IL-2 receptor α-chain (CD25) in 1995. CD4+CD25+ T regulatory (Treg) cells are heterogeneous T cell populations that prevent harmful immune responses to self and non-self antigens. Treg cells emerge from the thymus as part of normal T lymphocyte development and constitute
5-10% of CD4+T cells in the periphery. Treg cells reside in peripheral tissues to maintain self-tolerance and to prevent autoimmunity by inhibiting pathogenic lymphocytes. Two groups of CD4+CD25+ Treg cells were found naturally occurring CD4+CD25+ Treg cells (nTreg) and inducible CD4+CD25+ Treg cells (iTreg) (Sakaguchi, 2005; Piccirillo, et al., 2004; Thompson, et al., 2004). nTreg cells, characterized by the expression of CD4, CD25, and the transcriptional factor Forkhead box P3 (forkhead / winged helix transcription factor; Foxp3), develop in the thymus and recognize specific self-antigen (Stephens, et al., 2007). Subset of Treg cells are also generated in the periphery during an active immune response and are called iTreg and the newly induced CD4+ suppressor cells inhibited proliferation of CD4+T cells either via interlukin (IL)-10 (Dieckmann, et al., 2001) or transforming growth factor (TGF)-β (Jonuleit, et al., 2002) production. Foxp3 protein is currently considered as the most specific marker of Treg cells and a mutation of this transcription factor is strongly linked to immune dysregulation. Treg cells play an important role in the pathogenesis of
autoimmune disorders, such as diabetes mellitus(Kukreja, et al., 2002), arthritis (Amelsfort,
et al., 2004 ; Cao D, 2003), and lupus (Crispin, et al., 2003). These autoimmune disorders
can be prevented by infusion of Treg cells (Sakaguchi, et al., 2001). More recently Yuki Nanke et al. reported that the percentage of Treg cells decreased in peripheral blood of patients with BD before ocular attack (Nanke, et al., 2008). In this study, we investigated the role of Treg cells by identifying and analyzing the function of CD4+CD25+ Treg cells in
weeks after transferred with CD4+CD25+T cells, we analyzed frequencies of CD4+CD25+T and Treg cells in splenocytes and cytokines in sera and spleen tissues. The aim of this study was the affect on the inhibition of the progress of this severe inflammatory disease by elevating CD4+CD25+T cells in BD-like mice.
Ⅱ. MATERALS AND METHODS
A. Antibodies and Reagents
Mouse anti-CD4 (FITC), anti-CD25 (PE), anti-CD3, anti-CD28 antibodies and recombinant mouse IL-2 (rIL-2) were purchased from BD Pharmingen (San Diego, CA). Mouse anti-Foxp3 (PE-cy5) antibody and Foxp3 staining buffer kit and granulocyte macrophage colony-stimulating factor (GM-CSF) were purchased from eBioscience (San Diego, CA). Recombinant human TGF-β1 was purchased from R&D system (Minneapolis, MN). RPMI-1640 and Fetal Bovine Serum (FBS) was purchased from Gibco, Invitrogen (Carlsbad, CA).
B. Animal experiments
ICR male mice (4 to 5 week old) were infected with HSV type 1 (1x10⁶pfu/mL, F
strain) grown in Vero cells, as previously described (Sohn, et al., 1998). Virus inoculation was performed twice with 10 day intervals, followed by 16 weeks of observation. Animals were handled in accordance with a protocol approved by the animal care committee of Ajou University School of Medicine.
disappearance of symptoms or more than 20% decrease in the lesion size were classified as effective. The severity score of BD was followed by determination of the value of
Behcet’s disease activity index, as outlined in the BD Activity Form
(www.behcet.ws/pdf/BehcetsDiseaseActivityForm.pdf). Among the symptoms in human patients, mouth ulceration, genital ulceration, erythema, skin pustules, skin ulceration, joints-arthritis, diarrhea, red eye (right, left), reduced vision (right, left), loss of balance, discoloration, and swelling of the face were selected and analyzed in the BD-like mouse models. The score of each symptom is one and after the score was added up, the total was used in determining the severity score of BD.
D. Flow cytometry
Mouse anti-CD4 and anti-CD25 antibodies are surface markers that were stained with samples for 30min at 4°C in the dark. For the intracellular detection of Foxp3, anti-mouse Foxp3 staining buffer set was used according to the manufacturer's instructions. Briefly, cells were fixed using Fix/perm buffer (according to the manufacture manual) after washing with 1X permeabilization buffer, then incubated with anti-mouse Foxp3 Ab for 30 min at 4°C in the dark. Stained cells were analyzed on a flow cytometer (FACS Vantage; Becton Dickinson) with ≥10,000 gated lymphocytes. A negative isotype control was used to distinguish stained from unstained cells.
E. Splenocytes culture and generation of Treg cells
were isolated from mice and involved erythrocytes that were lysed by exposure to ACK solution. The cells were washed twice in a phosphate buffer saline (PBS). The splenocytes were in RPMI 1640 medium, supplemented 10% heat inactivate FBS and 1% Antibiotics, stimulated with anti-CD3 (0.1 ug/ml), anti-CD28 (0.2 ug/ml), rIL-2 (20 U/ml), and
TGF-β1 (2 ng/ml). Then the cells were seeded at a density of 1.5 x 10⁶
cells per 6-well tissue culture plates and incubated for 1 to 4 days.
F. Dendritic cells isolation and culture
Dendritic cells (DCs) were derived from bone marrow cells flushed from tibias with a 26-gauge needle containing RPMI-1640 medium with 10% FBS and 1% antibiotics. Cells were dissociated through a 100-μm nylon mesh cell strainer and cultured in RPMI containing 15 ng/ml of GM-CSF. After 3 days of culture, floating and loosely adherent cells were collected and recultured in fresh RPMI-1640 supplemented with GM-CSF for an additional 7 days of culture. The DCs were then used within an additional 14 days. Removal of adherent DCs was achieved by a 15min incubation (4°C) with 5 mM EDTA followed by gentle-trituration. Maturation of DCs was achieved by incubation with 500 ng/ml LPS for 24 h.
(anti-CD3 Ab, anti-CD28 Ab, rIL-2 and TGF-β). mDCs of 1x10⁵cells and CD4+CD25+T
of 1 x 10⁶ cells in 12 well culture plates cultured for 72 h. After co-culture, harvest of
suspension cells were stained with CD4, CD25, and Foxp3 and analyzed by flow cytometry.
H. Isolation of CD4+CD25+T cells
The splenocytes from normal mice were cultured for 2 days with stimulators. CD4+CD25+T or CD4+CD25-T cells were isolated from cultured splenocytes by using a mouse CD4+CD25+ regulatory T cell isolation kit™ (Milteny Biotec, Auburn, CA), according to the manufacturer's instructions. Briefly, CD4+T cells were first isolated through negative selection by removing all other cell types. Preisolated CD4+T cells were incubated with magnetic beads conjugated with anti-CD25 antibody to separate CD4+CD25+T and CD4+CD25-T cell populations. Isolated T cells were >80% pure upon re-analysis by flow cytometry.
I. Adoptive transfer of CD4+CD25+T and CD4+CD25-T cells to BD-like mice
CD4+CD25+T and CD4+CD25-T cells isolated from normal splenocytes were sorted. CD4+CD25+T cells were adoptively transferred to BD-like mice via a tail vein. The
transferred cells were 3x10³, 3x10⁴, and 3x10⁵ CD4+CD25+T cells (per mouse) which
symptoms by photographs 1 to 2 weeks after adoptive transfer. Two weeks later, BD-like mice transferred with CD4+CD25+T cells were sacrificed by cervical dislocation, and then serum and spleen tissues were collected.
J. ELISA
Two weeks after transferred with CD4+CD25+T cells to BD-like mice, the serum was obtained. Serum was analyzed using commercial ELISA kits for the detection of mouse IL-6, TNF-, TGF-β, IL-17, IFN-γ, and IL-10. All ELISA kits were purchased from R&D systems (Minneapolis, MN). The ELISA was carried out according to the manufacturer’s instructions. Means and standard deviations were calculated using ELISA values determined for each well. The ELISA reader was a Bio-Rad model 170-6850 microplate reader, and wavelength was 450 nm.
K. Reverse transcription PCR (RT-PCR)
Total RNA was isolated with TRIzol (Life Technologies, Helgerman, CT), according
to the manufacturer’s instructions. An amount of 1 g of total RNA was used as a
template for cDNA synthesis with SuperScript III First-Strand Synthesis System for RT-PCR kit (Invitrogen, Carlsbad, CA). The cDNA was amplified by RT-PCR with the primers (Table 1). Amplified PCR products were visualized on 1.8% agarose gels.
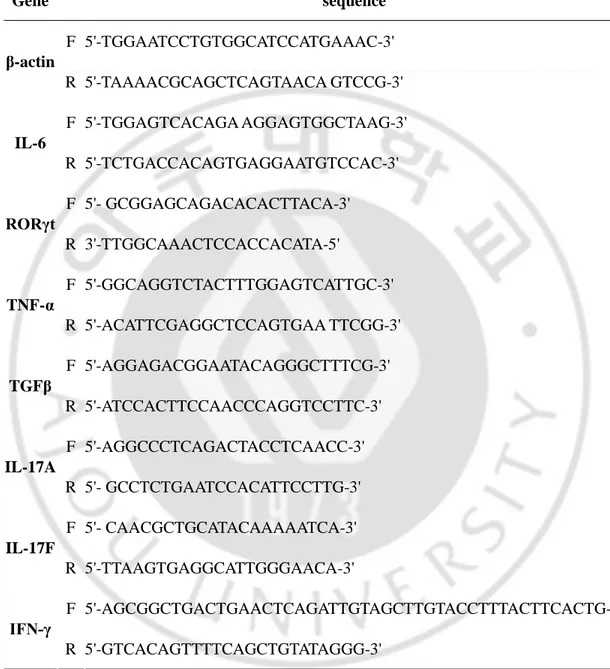
Table 1. The sequence of primers used for RT-PCR.
* RORγt (Kimura, et al., 2007), TNF-α (Murray, et al., 1990), TGFβ (Derynck, et al., 1986), IL-17A (Hsu, et al., 2008), IL-17F(Yamaguchi, et al., 2007)
Gene sequence F 5'-TGGAATCCTGTGGCATCCATGAAAC-3' β-actin R 5'-TAAAACGCAGCTCAGTAACA GTCCG-3' F 5'-TGGAGTCACAGA AGGAGTGGCTAAG-3' IL-6 R 5'-TCTGACCACAGTGAGGAATGTCCAC-3' F 5'- GCGGAGCAGACACACTTACA-3' RORγt R 3'-TTGGCAAACTCCACCACATA-5' F 5'-GGCAGGTCTACTTTGGAGTCATTGC-3' TNF-α R 5'-ACATTCGAGGCTCCAGTGAA TTCGG-3' F 5'-AGGAGACGGAATACAGGGCTTTCG-3' TGFβ R 5'-ATCCACTTCCAACCCAGGTCCTTC-3' F 5'-AGGCCCTCAGACTACCTCAACC-3' IL-17A R 5'- GCCTCTGAATCCACATTCCTTG-3' F 5'- CAACGCTGCATACAAAAATCA-3' IL-17F R 5'-TTAAGTGAGGCATTGGGAACA-3' F 5'-AGCGGCTGACTGAACTCAGATTGTAGCTTGTACCTTTACTTCACTG-3' IFN-γ R 5'-GTCACAGTTTTCAGCTGTATAGGG-3'
L. Statistical analysis
All data are represented as the mean SE. Statistical differences between the
experimental groups were determined using the Chi-square test, Student’s t test, and Bonferroni correction. Statistical analysis was performed using the MedCalc® version 9.3.0.0.
Ⅲ. RESULTS
A. CD4+CD25+ Treg cells in BD-like mice compared to BDN mice
We examined the frequencies of CD4+CD25+T and Treg cells in splenocytes of
normal healthy, BDN (BD asymptomatic, HSV was inoculated but no symptomatic mice
),
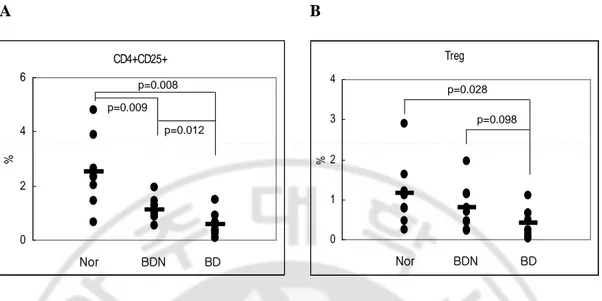
and BD-like mice by FACS analysis. The CD4+CD25+T cell percentages in BD-like mice (n=9) were significantly lower than BDN mice (n=9)(0.59 ± 0.42 vs 1.14 ± 0.4%, p=0.012) and normal mice (n=8)(0.59 ± 0.42 vs 2.52 ± 1.31%, p=0.0008). Also BDN mice were lower than normal mice (1.14 ± 0.4 vs 2.52% ± 1.31%, p=0.009)(Fig 1A). Treg cell frequency in BD-like mice were lower than BDN mice (0.39 ± 0.37 vs 0.78 ± 0.56%, p=0.098) and normal mice (0.39 ± 0.37 vs1.15 ± 0.83%, p=0.028)(Fig 1B). CD4+CD25+ T and Treg cells in BDN mice were 2 times greater than BD-like mice. BD-like mice showed a decline in the frequency of Treg cells.
A B CD4+CD25+ 0 2 4 6 % Nor BDN BD p=0.009 p=0.008 p=0.012 CD4+CD25+ 0 2 4 6 % Nor BDN BD p=0.009 p=0.008 p=0.012 Treg 0 1 2 3 4 % Nor BDN BD p=0.028 p=0.098 Treg 0 1 2 3 4 % Nor BDN BD p=0.028 p=0.098
Fig. 1. The frequencies of CD4+CD25+T and Treg cells in splenocytes of BDN and
BD-like mice was compared by FACS analysis. CD4+CD25+T and Treg cell levels were
lower in BD-like mice compared to BDN mice (A and B). A. The percentage of CD4+CD25+T cells was 0.59 ± 0.42% for BD-like mice (n=9) and 1.14 ± 0.4% for BDN mice (n=9)(BD-like vs BDN, p=0.012) and 2.52 ± 1.31% for normal mice (n=8)(BD-like vs normal, p=0.0008). B. The percentage of Treg cell was 0.39 ± 0.37% for BD-like mice and 0.78 ± 0.56% for BDN mice (BD-like vs BDN, p=0.098) and 1.15 ± 0.83% for normal mice (BD-like vs normal, p=0.0028). The short bars indicate the means. BD: Behcet’s Disease-like mice, BDN: BD Normal (BD asymptomatic) mice, CD4+CD25+: CD4+CD25+T cells, Treg: regulatory T (CD4+CD25+Foxp3+) cells
B. CD4+CD25+T cells were amplified in primary cultures of spleen tissues
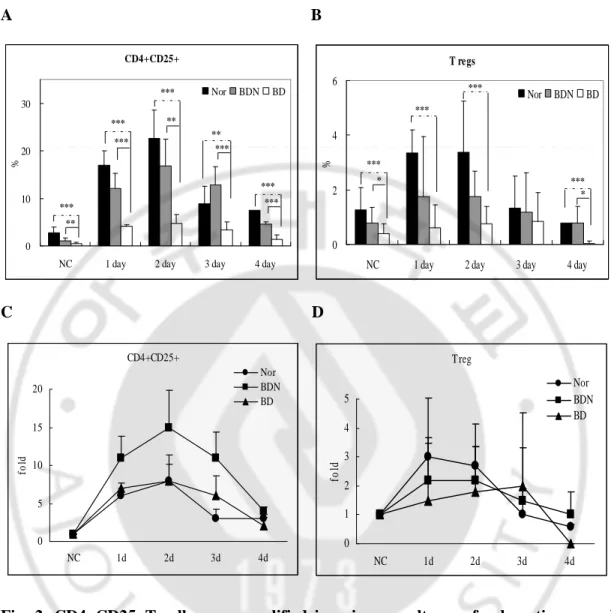
Splenocytes were cultured with stimulators for several days, and then CD4+CD25+T cells and Treg cells were analyzed by FACS analysis. On day 0, Fig. 2 (A and B) show the frequencies of CD4+CD25+T cells of BD-like mice were 0.59±0.42% compared to 2.52±1.31% (p=0.0008) in normal mice, 1.14±0.4% (p=0.012) in BDN mice, and Treg cells of BD-like mice were 0.41±0.35% compared to 1.15±0.83% (p=0.028) in normal mice, 0.79±0.56% (p=0.098) in BDN mice. On day 1, the percentage of CD4+CD25+T cells of BD-like mice was 4.05±0.29% compared to 16.99±3.04% (p<0.01) in normal mice, 12.02±2.34% (p<0.01) in BDN mice and Treg cells of BD-like mice were 0.64±0.59% compared to 3.34±0.85% (p<0.01) in normal mice, 1.75±1.57% in BDN mice. The percentage of Treg cell in BDN was 2.4 times higher than BD-like mice, though statistically not significant. On day 2, the percentage of CD4+CD25+T cells of BD-like mice was 4.67±1.39% compared to 22.68±5.96% (p<0.01) in normal mice and 16.80±5.66% (p<0.05) in BDN mice. The frequency of Treg cell of BD-like mice was 0.74±0.46% compared to 3.37±1.86% (p<0.01) in normal mice and 1.75±0.94% in BDN mice. Treg cell in BDN was 2.3 times greater than BD-like mice though statistically not significant. On days 3 and 4, CD4+CD25+T and Treg cells of BD-like mice were lower
than BDN or normal and resulted in a decreasing tendency
.
On day 3, the percentage ofCD4+CD25+T cells of BD mice was 3.41±1.11% compared to 8.92±2.56% in the normal mice (p<0.05), 12.78±2.78% in the BDN mice (p<0.01) and Treg cell of BD-like mice was 0.85±0.74% compared to 1.35±0.84% in the normal mice, 1.18±1.02% in the BDN mice. On day 4, the percentage of CD4+CD25+ T cells of BD mice was 1.29±0.72%
compared to 6.20±1.71% in the normal mice (p<0.01), 4.55±0.39% in the BDN mice (p<0.01) and Treg cell of BD-like mice was 0.04±0.08% compared to 0.65±0.14% in the normal mice (p<0.01), 0.78±0.43% in the BDN mice (p<0.1). Our results show that CD4+CD25+ T and Treg cells of splenocytes in BD-like mice were lower than BDN or normal mice.
To confirm the proliferation of CD4+CD25+T and Treg cells, fold increase in proliferation after culture with stimulators was traced. CD4+CD25+T cells from normal mice increased 6±1, 8±2.1, 3±1.3, and 3±0.2 fold on day 1, 2, 3, and 4, respectively. BDN mice increased 11±2.9, 15±4.9, 11±3.4, and 4±0.5 fold on day 1, 2, 3, and 4, respectively. BD-like mice increased 7±0.7, 8±3.3, 6±2.6, and 2±1.6 fold on day 1, 2, 3, and 4, respectively. (No cultured groups were standard and 1 fold). Treg cells in normal mice increased 3±0.7, 2.7±1.4, 1±0.9, and 0.6±0.1 fold on day 1, 2, 3, and 4, respectively. BDN mice increased 2.2±2.8, 2.2±1.2, 1.5±1.8, and 1±0.8 fold on day 1, 2, 3, and 4, respectively. BD-like mice increased 2.2±2.8, 2.2±1.2, 1.5±1.8, and 1±0.8 fold on day 1, 2, 3, and 4, respectively. The proliferation fold was not statistically significant among groups in normal, BDN, and BD-like mice.
The frequencies of CD4+CD25+T and Treg cell cultured for two days showed the highest expression compared to the other days. Therefore we used two day cultured splenocytes.
A B CD4+CD25+ 0 10 20 30
NC 1 day 2 day 3 day 4 day
% Nor BDN BD *** *** ** *** ** *** *** *** *** ** CD4+CD25+ 0 10 20 30
NC 1 day 2 day 3 day 4 day
% Nor BDN BD *** *** ** *** ** *** *** *** *** ** T regs 0 2 4 6
NC 1 day 2 day 3 day 4 day
% Nor BDN BD *** *** * *** * *** T regs 0 2 4 6
NC 1 day 2 day 3 day 4 day
% Nor BDN BD *** *** * *** * *** C D CD4+CD25+ 0 5 10 15 20 NC 1d 2d 3d 4d fo ld Nor BDN BD CD4+CD25+ 0 5 10 15 20 NC 1d 2d 3d 4d fo ld Nor BDN BD T reg 0 1 2 3 4 5 NC 1d 2d 3d 4d fo ld Nor BDN BD
Fig. 2. CD4+CD25+T cells were amplified in primary cultures of spleen tissues and
amplified range was different among normal, BDN, and BD-like mice. The frequencies
of CD4+CD25+T and Treg cells of splenocytes from normal, BDN, and BD-like mice were serially measured with stimulators at 0 (no culture), 1, 2, 3 and 4 day. CD4+CD25+T and Treg cells of BDN mice were compared to BD-like mice. The frequency of CD4+CD25+T cells in normal mice was significantly higher than BDN and BD-like mice. The frequency of CD4+CD25+T cells in BDN was significantly higher than BD-like mice (A). In Treg cells,
normal mice were significantly higher than BDN and BD-like mice at day 1 and 2 but the difference between BDN and BD-like mice was not significant on day 3 or 4(B). C and D: The fold increase in proliferation CD4+CD25+T and Treg cell after culture with stimulators was traced. On day 2, CD4+CD25+T cells in BD-like mice were lower than the BDN group but statistically were not significant. In Treg cells, BD-like mice were lower than normal and BDN groups. Data are means ± SD of three independent experiments. *p<0.1, **p<0.05, ***p<0.01, NC : no culture (day 0), Nor: normal mice, BDN: BD asymptomatic mice, BD: Behcet’s Disease-like mice, CD4+CD25+: CD4+CD25+T cells, Tregs: regulatory T (CD4+CD25+Foxp3+) cell
C. CD4+T cells from normal, BDN, and BD-like splenocytes were co-cultured
with dendritic cells from normal mice.
To find the most important factor for proliferating CD4+CD25+T and Treg cells between CD4+T cells and dendritic cells (DC), CD4+T cells from normal, BDN, and BD splenocytes were co-cultured with dendritic cells from normal mice and DC from normal, BDN, and BD-like splenocytes were co-cultured with CD4+T cells from normal mice. This study showed proliferation of CD4+CD25+T and Treg cells when CD4+T cells were co-cultured with antigen presenting DC for several days. DC from bone marrow of normal mice was isolated and cultured for 10 days. After LPS treatment, mature DCs (mDCs) were used. CD4+T cells were isolated from spleen tissues of normal, BDN, and BD-like
mice. 1x10⁵ mDCs from normal mice and 1 x 10⁶ CD4+T cells from normal, BDN, and
BD-like mice were co-cultured with anti-CD3 Ab, anti-CD28 Ab, rIL-2, and TGF-β for 72 h in a 12 well culture plate. Fig. 3A shows the frequency of CD4+CD25+T cells from normal mice (65%) was higher than BDN (47%) and BD-like (40%) mice. The Treg cells from normal mice (24%) were higher than BDN (10%) and BD-like (4%) mice. CD4+CD25+T cell proliferation was affected by mDCs, but differences among groups were not significantly different. An important factor for the difference of proliferation of CD4+CD25+T cells among groups was the state of CD4+T cells. CD4+T cells were isolated from spleen tissues of normal mice. DCs were derived from normal, BDN, and
BD-like mice. 1 x 10⁶ CD4+T cells from normal mice and 1x10⁵ mDCs from normal,
BDN, and BD-like mice were co-cultured with anti-CD3 Ab, anti-CD28 Ab, rIL-2, and TGFβ for 72 h in a 12 well culture plate. Fig. 3B shows the expression of CD4+CD25+T
cells from normal DCs was 37%, 38% from BDN DCs, and 41% from BD-like mice DCs. The percentage of CD4+CD25+T cells was a little different among the groups, but statistically not significant.
A
CD4+ T cell
Nor BDN BD CD4 C D 2 5 40% 65% 47% CD25 F o x p 3 4% 24% 10% Nor mDCCD4+ T cell
Nor BDN BD CD4 C D 2 5 40% 40% 65% 65% 47%47% CD25 F o x p 3 4% 4% 24% 24% 10%10% Nor mDC BmDC
Nor BDN BD Nor CD4+ T cell C D 2 5 F o x p 3 CD4 CD25 37% 38% 41% 6 % 6 % 6 %mDC
Nor BDN BD Nor CD4+ T cell C D 2 5 F o x p 3 CD4 CD25 37% 38% 41% 6 % 6 % 6 %Fig. 3. CD4+T cells from normal, BDN, and BD-like splenocytes were co-cultured with
dendritic cells from normal mice and DC from normal, BDN, and BD-like
splenocytes were co-cultured with CD4+T cells from normal mice. Dendritic cells
(DCs) from bone marrow of normal mice was isolated, cultured, and maturated. CD4+T
cells were isolated from spleen tissues of normal, BDN, and BD-like mice. 1x10⁵mDCs
from normal mice and 1 x 10⁶ CD4+T cells from normal, BDN, and BD-like mice were
co-cultured with stimulators. Fig. 3A shows that frequency of CD4+CD25+T cells from normal mice was higher than BDN and BD-like mice. The Treg cells from BDN mice were higher than BD-like mice. B. CD4+T cells were isolated from spleen tissues of
normal mice. DCs were derived from normal, BDN, and BD-like mice. 1 x 10⁶ CD4+T
cells from normal mice and 1x10⁵ mDCs from normal, BDN, and BD-like mice were
co-cultured with stimulators. The difference of CD4+CD25+T and Treg cells among the groups did not occurred. CD4+T cells are a more important factor than mDC in differenting the expression of CD4+CD25+T and Treg cells in normal, BDN, and BD-like mice. Nor mDC: normal mature dendritic cells, Nor CD4+ T cell: normal CD4+T cells
D. Adoptive transfer of CD4+CD25+T cells up-regulated the frequencies of Treg cell in
BD-like mice
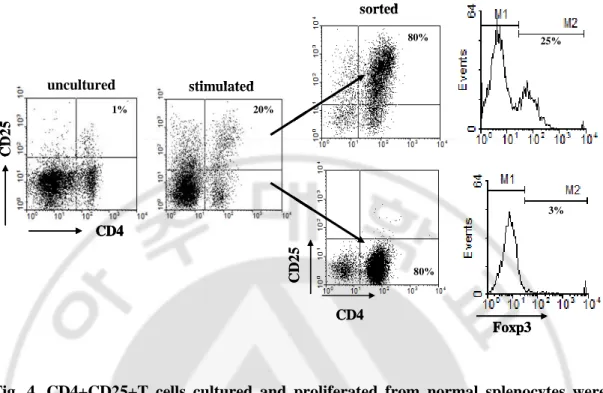
The CD4+CD25+T cells from splenocytes in normal healthy mice were cultured with stimulators and then isolated by MACS. After sorting, ≥80% of CD4+CD25+T cells was present in sorted fraction and CD4+CD25-T cells were ≥85% by FACS analysis (Fig. 4). The proportions of Foxp3 positive cells were ≥25% in the CD4+CD25+T cells and ≤ 3% in the CD4+CD25-T cells (Fig. 4). CD4+CD25+T and CD4+CD25-T cells were applied
to in vivo BD-like mice. CD4+CD25+ (3 x 10³, 3 x 10⁴, and 3 x 10⁵) T cells and
CD4+CD25- (3 x 10⁵) T cells were adoptively transferred by intravenous injection to
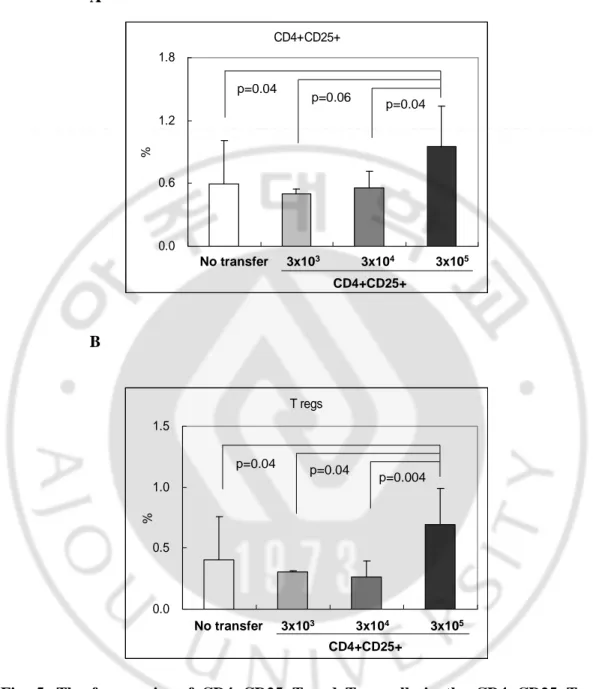
BD-like mice. Two weeks after transfer with CD4+CD25+T cells, the transferred mice were sacrificed and the change of frequency of Treg cells from spleen tissues was identified. The frequency of CD4+CD25+T cells after transfer with CD4+CD25+T cells is as
follows; 0.59±0.42% for the not transferred group (n=9), 0.50±0.04% for the 3 x 10³
group (n=3), 0.55±0.16% for the 3 x 10⁴ group (n=5), and 0.95±0.39% for the 3 x 10⁵
group (n=16) (not transfer vs 3 x 10⁵, p=0.004; 3 x 10³vs 3 x 10⁵, p=0.04; 3 x 10⁴vs 3 x
105, p=0.06)(Fig. 5A). The percentage of Treg cells transferred with CD4+CD25+T cells
is as follows; 0.41±0.35% for the not transferred group, 0.31±0.01% for the 3 x 10³group,
0.26±0.14% for the 3 x 10⁴group, and 0.69±0.30% for the 3 x 10⁵group (no transfer vs 3
x 105, p=0.04; 3 x 10³ vs 3 x 10⁵, p=0.04; 3 x 10⁴ vs 3 x 10⁵, p=0.004)(Fig. 5B). Our
results show that transfer with 3 x 10⁵ of CD4+CD25+T cells were significantly higher
than 3 x 10³and 3 x 10⁴ of CD4+CD25+T cells. After transfer of CD4+CD25+T cells to
uncultured CD4 C D 2 5 stimulated 1% 20% 80% 80% Foxp3 sorted 25% 3% CD4 C D 2 5 uncultured CD4 C D 2 5 stimulated 1% 20% 80% 80% Foxp3 sorted 25% 3% uncultured CD4 C D 2 5 stimulated 1% 20% 80% 80% Foxp3 sorted 25% 3% CD4 C D 2 5
Fig. 4. CD4+CD25+T cells cultured and proliferated from normal splenocytes were
isolated by MACS. The splenocytes of normal healthy mice were cultured for 2 days with
stimulators (anti-CD3 Ab, anti-CD28 Ab, rIL-2, and TGF-β). Then, CD4+CD25+T or CD4+CD25-T cells were isolated by using a mouse CD4+CD25+ regulatory T cell isolation kit™ (Milteny Biotec, Auburn, CA) according to the manufacturer's instructions. After sorting by MACS, we checked CD4+CD25+T cells by FACS analysis (>80%). Also the proportions of Foxp3 positive cells were identified in the sorted CD4+CD25+T cells (≥25%).
A CD4+CD25+ 0.0 0.6 1.2 1.8 % No transfer 3x10³ 3x10⁴ 3x10⁵ CD4+CD25+ p=0.04 p=0.06 p=0.04 CD4+CD25+ 0.0 0.6 1.2 1.8 % No transfer 3x10³ 3x10⁴ 3x10⁵ CD4+CD25+ p=0.04 p=0.06 p=0.04 B T regs 0.0 0.5 1.0 1.5 % No transfer 3x10³ 3x10⁴ 3x10⁵ CD4+CD25+ p=0.04 p=0.04 p=0.004 T regs 0.0 0.5 1.0 1.5 % No transfer 3x10³ 3x10⁴ 3x10⁵ CD4+CD25+ p=0.04 p=0.04 p=0.004
Fig. 5. The frequencies of CD4+CD25+T and Treg cells in the CD4+CD25+T cells
transferred BD-like mice. Various amounts of CD4+CD25+T cells were transferred via tail
vein injection to like mice. Two weeks after transfer with CD4+CD25+T cells to BD-like mice, the mice were sacrificed, and the obtained spleen tissues containing CD4+CD25+T and Treg cells were analyzed by FACS. The frequencies CD4+CD25+T and
Treg cells in transferred BD-like mice were dependent on the amount of transferred cells. The more CD4+CD25+T cells transferred and the more CD4+CD25+T and Treg cells remained significantly in the BD-like mice. CD4+CD25+: CD4+CD25+T cells, Treg:
regulatory T (CD4+CD25+Foxp3+) cells, no transfer: n=9, 3 x 10³: n=3, 3 x 10⁴: n=5, 3 x
E. Change of symptoms in BD-like mice after adoptive transfer
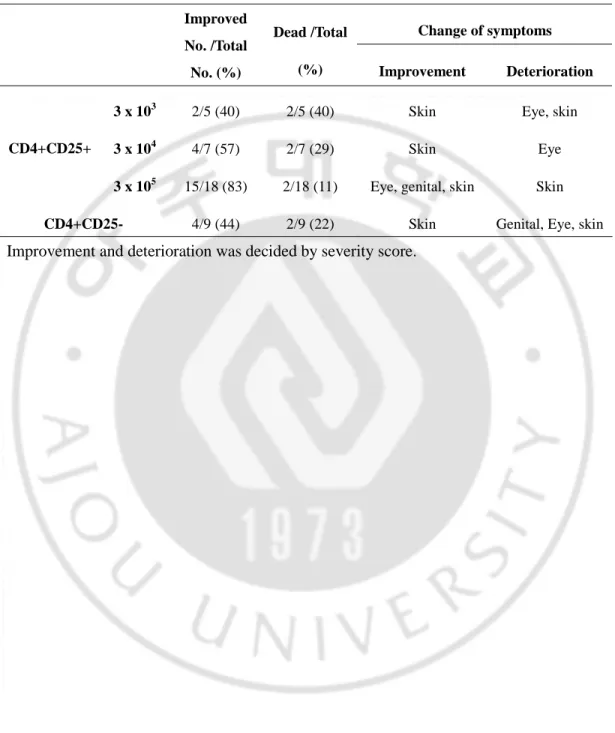
After injection of isolated CD4+CD25+T cells intravenously, CD4+CD25+T cell numbers increased by FACS analysis. Before and 2 weeks after transfer, the changes of symptoms in BD-like were photographed. The BD-like symptoms, such as oral ulcer, skin ulcer, scrotum enlargement, genital inflammation, arthritis, etc, were improved (Fig. 6). 3
x 105 of CD4+CD25+T cells effectively decreased BD-like symptoms in 15 of 18 cases
(83%). But transfer with CD4+CD25-T cells decreased BD-like symptoms in 4 of 9 cases
(33%) and 3 x 10⁴ of CD4+CD25+T cells decreased BD-like symptoms in 4 of 7 cases
(57%)(Table 2). CD4+CD25+T cells transfer brought the improvement of BD-like symptoms.
3 x 10³ CD4+CD25+ Before After 3 x 10⁴ CD4+CD25+ 3 x 10⁵ CD4+CD25+ No transfer Before 3 x 10⁵ CD4+CD25-3 x 10³ CD4+CD25+ Before After 3 x 10⁴ CD4+CD25+ 3 x 10⁵ CD4+CD25+ No transfer Before 3 x 10³ CD4+CD25+ Before After 3 x 10⁴ CD4+CD25+ 3 x 10⁵ CD4+CD25+ No transfer Before 3 x 10⁵
CD4+CD25-Fig. 6. CD4+CD25+T or CD4+CD25-T cells were transferred to BD-like mice when
their BD-like symptoms occurred. Photographs of mice were taken before and after
transfer with CD4+CD25+T and CD4+CD25-T cells in BD-like mice. Transfer with 3 x 10⁴
and 3 x 10⁵ CD4+CD25+T cells to BD-like mice improved the BD-like symptoms but
transfer with 3 x 10³ CD4+CD25+T and CD4+CD25-T cells were not improved or
deteriorated the BD-like symptoms. 3 x 10⁵ CD4+CD25+T cells transferred BD-like mice
Table 2. The change of symptoms after CD4+CD25+T cell transfer in BD-like mice Change of symptoms Improved No. /Total No. (%) Dead /Total (%) Improvement Deterioration
3 x 10³ 2/5 (40) 2/5 (40) Skin Eye, skin
3 x 10⁴ 4/7 (57) 2/7 (29) Skin Eye
CD4+CD25+
3 x 10⁵ 15/18 (83) 2/18 (11) Eye, genital, skin Skin
CD4+CD25- 4/9 (44) 2/9 (22) Skin Genital, Eye, skin
F. The change of severity score in transferred with CD4+CD25+T cells to
BD-like mice
The changes of symptoms are shown in Fig. 7. The BD severity score of adoptive
transfer with 3 x 10⁴ and 3 x 10⁵ CD4+CD25+T cells in BD-like mice decreased
statistically significant compared to adoptive transfer with CD4+CD25-T cells or 3 x 10³
CD4+CD25+T cells in BD-like mice. The severity score of adoptive transfer with 3 x 10³
CD4+CD25+T cells in BD-like mice was 2.71.2 before the injection and 1.70.6 after 2
weeks (p=0.225, n=3), 3 x 10⁴CD4+CD25+T cells was 2.80.8 before and 1.81.3 after
(p=0034, n=5), 3 x 10⁵ CD4+CD25+T cells was 2.80.9 before and 1.30.9 after
(p=0.0001, n=16), and CD4+CD25-T cells was 2.10.4 before and 1.71.0 after (p=0.143, n=9). Symptoms of transferred with CD4+CD25+T cells in BD-like mice were improved, but CD4+CD25-T cell transfer was not effective by improved.
0 1 2 3 4 before after 3 x 10³ 3 x 10⁴ 3 x 10⁵ CD4+CD25+ CD4+CD25-p=0.225 p=0.143 p=0.034 p=0.0001 S e v e ri ty s c o re 0 1 2 3 4 before after 3 x 10³ 3 x 10⁴ 3 x 10⁵ CD4+CD25+ CD4+CD25-p=0.225 p=0.143 p=0.034 p=0.0001 0 1 2 3 4 before after 3 x 10³ 3 x 10⁴ 3 x 10⁵ CD4+CD25+ CD4+CD25-p=0.225 p=0.143 p=0.034 p=0.0001 S e v e ri ty s c o re
Fig. 7. The comparison of the severity score before and after transfer of CD4+CD25+T
or CD4+CD25-T cells in BD-like mice. Various amounts of CD4+CD25+T and
CD4+CD25-T cells were adoptively transferred via tail vein injection to BD-like mice. The comparison of the disease severity score was calculated before and after transfer with CD4+CD25+T or CD4+CD25-T cells. The severity score was decreased and statistically
G. CD4+CD25+T cells transfer up-regulated serum IL-10 and TGF-β levels and
down-regulated IFN-γ and TNF-
levels
Many studies have investigated the secretion of TGF-β and IL-10 by CD4+CD25+T cells (Dieckmann, et al., 2002; Papiernik, et al., 1997; Stephens, et al., 2001). It is known that the roles of IL-10 and TGF-ß in the suppressive effects are mediated by CD4+CD25+T cells. By ELISA, the IL-10 protein level was 75.3±48.5 pg/ml in the serum
of the not transferred BD-like mice (n=7) compared to 156.2±80.1 pg/ml in the 3 x 10⁵
CD4+CD25+T cells transferred BD-like mice (n=13)(not transferred BD-like mice vs 3 x
105, p=0.03) and 54.8±67.8 pg/ml in the 3 x 10⁴cells transferred BD-like mice (n=4)(3 x
104 vs 3 x 10⁵, p=0.04), and 88.9±84.0 pg/ml in the BDN mice (n=7)(Fig. 8A). IL-10
level was increased after transfer with 3 x 10⁴and 3 x 10⁵CD4+CD25+T cells in the
BD-like mice. The importance of TGF-β in the immune system was highlighted by the discovery that TGF-β-deficient mice developed multiple inflammatory diseases (Kulkarni,
et al., 1993; Shull, et al., 1992). TGF-β expression was higher in transfer of 3 x 10⁵ cells to BD-like mice than not transferred BD-like mice by RT-PCR and ELISA. By ELISA,
the TGF-β protein level was 19.8±20.0 pg/ml in the transfer with 3 x 10⁵ CD4+CD25+T
cells in BD-like mice (n=15) compared to 4.7±1.9 pg/ml in the not transferred BD-like
mice (n=8), 10.4±7.3 pg/ml in the BDN mice (n=6), and 5.0±2.4pg/ml in the 3 x 10⁴
CD4+CD25+ T cell transferred BD-like mice (n=5)(not transferred vs 3 x 10⁵, p=0.08;
BD-like vs BDN, p=0.07)(Fig 8B). mRNA level of TGF-β in spleen tissues of transferred
with 3 x 10⁵ CD4+CD25+T cells was higher than the not transferred BD-like (Fig 8G).
levels were shown to be similar to BDN or higher than BDN. It was already known CD4+CD25+ Treg cells secrete IL-10 and TGF-β.
Interferon (IFN)-γ represents the key cytokine produced by Th1 cells. IFN-γ protein levels were higher in BD-like mice than BDN mice (Sohn, et al., 2001). IFN-γ levels were
compared between 3 x 10⁵ CD4+CD25+T cells transferred BD-like mice and not
transferred BD-like mice. Our results indicated that transfer with 3 x 10⁵ CD4+CD25+T
cells was significantly lower than not transferred BD-like mice by ELISA. IFN-γ levels
were 10.0±6.2 pg/ml for the transfer with 3 x 10⁵ CD4+CD25+T cells in BD-like mice
(n=12) compared to 37.4±6.6 pg/ml in the not transferred BD-like mice (n=5), 5.3±7.4
pg/ml in the BDN mice (n=4), and 14.1±10.7 pg/ml in the transfer with 3 x 10⁴
CD4+CD25+T cells BD-like mice (n=5)(not transferred vs 3 x 10⁵, p=0.000001; BD-like
mice vs BDN, p=0.002; not transferred vs 3 x 10⁴, p=0.03)(Fig. 8C). mRNA expression of
IFN- γ in spleen tissues of transferred with 3 x 10⁵
CD4+CD25+T cells was lower than the not transferred BD-like mice (Fig 8G). Tumor necrosis factor- (TNF-) is a potent paracrine and endocrine mediator of inflammatory and immune functions. TNF- over expression has been implicated in acute and chronic inflammatory diseases, such as rheumatoid arthritis, atopic dermatitis, psoriasis, and Behcet’s disease (Akdeniz, et al.,
2004). TNF- levels were lower in 3 x 10⁵
CD4+CD25+T cell transferred BD-like mice than not transferred BD-like mice by RT-PCR and ELISA. By ELISA, the TNF- level
CD4+CD25+T cells to BD-like mice (n=5)(not transfer vs 3 x 10⁵, p=0.002; BD-like mice
vs BDN, p=0.00005; 3 x 10⁴ vs 3 x 10⁵, p=0.002)(Fig 8D). mRNA expression of TNF-
H. Serum IL-6 and IL-17 levels were down-regulated after transfer
It is known that IL-6, in combination with TGF-β, induces Th-17 cell generation from naïve T cells and inhibit TGF-β-induced Foxp3 expression (Kimura, et al., 2007; Fantini, et al., 2004). Th-17 cells produce IL-17A (IL-17) and IL-17F and, to a lesser extent, TNF and IL-6 (Langrish, et al., 2005). Th-17 cells are present in human patients with various autoimmune diseases, including rheumatoid arthritis, multiple sclerosis, systemic lupus erythematous, and asthma (Matusevicius, et al., 1999; Wong, et al., 2000; Hashimoto, et al., 2005; Lindén, et al., 2000). We confirmed that the serum IL-6 levels were higher in BD-like mice than BDN mice. Serum IL-6 levels were down-regulated by transfer of CD4+CD25+T cells in BD-like mice. The IL-6 protein level was 215.6±133.3 pg/ml for not transferred BD-like mice (n=6) compared to 39.2±50.8 pg/ml in the
transferred with 3 x 10⁵ CD4+CD25+T cells in BD-like mice (n=16)(p=0.0002) and
75.8±60.9 pg/ml for the transferred with 3 x 10⁴ CD4+CD25+T cells in BD-like mice
(n=5) (not transferred vs 3 x 10⁵, p=0.06). In BDN mice (n=6), IL-6 levels were 19.9±20.3
pg/ml (BD-like vs BDN p=0.005)(Fig. 8E). So, all transferred mice were significantly lower than BD-like mice. Adoptive transfer of CD4+CD25+T cells could influence the expression of Th-17, thus, IL-17 protein production was measured by ELISA. The IL-17
protein level was 19.1±8.1 pg/ml in the transferred with 3 x 10⁵ CD4+CD25+T cells in
IL-17A and IL-17F in spleen tissues transferred with 3 x 10⁵CD4+CD25+T cells and not transferred BD-like mice showed similar patterns to ELISA results. mRNA levels of
ROR-γt, transcription factor of Th17, was lower in 3 x 10⁵
CD4+CD25+T cell transferred BD-like mice than the not transferred BD-like mice. From these, adoptive transfer of CD4+CD25+T cells altered the cytokine expression and improvement of BD-like symptoms.
A B IL-10 0 100 200 300 p g /m l BDN BD 3x10 5 3x10⁴ CD4+CD25+ p=0.03 p=0.04 IL-10 0 100 200 300 p g /m l BDN BD 3x10 5 3x10⁴ CD4+CD25+ IL-10 0 100 200 300 p g /m l BDN BD 3x10 5 3x10⁴ CD4+CD25+ p=0.03 p=0.04 TGF-beta 0 20 40 60 80 n g /m l BDN BD 3x10 5 3x10⁴ CD4+CD25+ p=0.07 p=0.08 TGF-beta 0 20 40 60 80 n g /m l BDN BD 3x10 5 3x10⁴ CD4+CD25+ TGF-beta 0 20 40 60 80 n g /m l BDN BD 3x10 5 3x10⁴ CD4+CD25+ p=0.07 p=0.08 C D IFN-gamma 0 20 40 60 p g /m l BDN BD 3x10 5 3x10⁴ CD4+CD25+ p=0.000001 p=0.002 p=0.03 IFN-gamma 0 20 40 60 p g /m l BDN BD 3x10 5 3x10⁴ CD4+CD25+ IFN-gamma 0 20 40 60 p g /m l BDN BD 3x10 5 3x10⁴ CD4+CD25+ p=0.000001 p=0.002 p=0.03 TNF-alpha 0 20 40 60 80 100 120 140 p g /m l BDN BD 3x10 5 3x10⁴ CD4+CD25+ p=0.00005 p=0.002 p=0.002 TNF-alpha 0 20 40 60 80 100 120 140 p g /m l BDN BD 3x10 5 3x10⁴ CD4+CD25+ p=0.00005 p=0.002 p=0.002 E F IL-6 200 300 400 p g /m l p=0.0002 p=0.06 p=0.005 IL-6 200 300 400 p g /m l IL-6 200 300 400 p g /m l p=0.0002 p=0.06 p=0.005 IL-17 40 60 80 100 p g /m l p=0.002 p=0.002 p=0.03 IL-17 40 60 80 100 p g /m l IL-17 40 60 80 100 p g /m l p=0.002 p=0.002 p=0.03
G IL-6 TNF-α BD BDN 3x10⁴ 3x10⁵ IL-17A IL-17F IFN-γ ROR- γt β-actin TGF-β CD4+CD25+ IL-6 TNF-α BD BDN 3x10⁴ 3x10⁵ IL-17A IL-17F IFN-γ ROR- γt β-actin TGF-β CD4+CD25+
Fig. 8. Protein and mRNA levels of cytokines were compared between BD-like mice
and CD4+CD25+T cells transferred BD-like mice. Serum was collected from hearts of
mice at 2 weeks after transferred with CD4+CD25+T cells. Transfer with 3 x 10⁴and 3 x 10⁵
CD4+CD25+T cells in BD-like mice were compared to not transferred BD-like and BDN
mice. A~B: IL-10 and TGF-β protein levels were increased in transfer with 3 x 10⁵
CD4+CD25+T cells to BD-like mice. C~F: IFN-γ, TNF-α, IL-6 and IL-17 protein levels
were decreased in transfer with 3 x 10⁵CD4+CD25+T cells to BD-like mice. The short bars
indicate the means
.
G: mRNA expressions of cytokines in spleen tissues of BD-like mice,BDN, and transferred with 3 x 10⁴ and 3 x 10⁵ CD4+CD25+T cells to BD-like mice,
CD4+CD25+T cells to BD-like mice, Lane 4: transferred with 3 x 10⁵ CD4+CD25+T cells to BD-like mice. mRNA levels of IFN-γ, TNF-α, IL-6, IL-17A, IL-17, and ROR-γt in
transferred with 3 x 10⁵CD4+CD25+T cells were detected lower than not transferred
BD-like mice. But mRNA level of TGF-β in transferred with 3 x 10⁵ CD4+CD25+T cells was
I. The differences of serum cytokine amounts between the average of not
transferred BD-like mice and 3x10
5CD4+CD25+T cells transferred each
BD-like mouse
The differences of serum cytokine amounts between the average of not transferred
BD-like mice and 3x10⁵ CD4+CD25+T cell transferred each BD-like mouse were
displayed and BD skin symptomatic mice (BD skin) and BD ocular symptomatic mice with skin symptom (BD eye) displayed separately because it was reported that the immunology between BD skin and BD eye was different (Shon, 2007). The protein amount of CD4+CD25+T cells transferred BD-like mice by ELISA was subtracted from the not transferred average of BD-like mice (Fig 8). IL-10 protein levels were 78.9±67.4 pg/ml in BD skin (n=9) compared to 38.7±106.8 pg/ml in BD eye (n=7)(p=0.36), therefore, transferred mice up-regulated IL-10 protein levels and BD eye mice was lower than BD skin mice, but not significant. TGF-β protein levels were 11.1±16.5 ng/ml in BD skin (n=9) compared to 12.3±21.9 ng/ml in BD eye (n=7), so, transferred mice up-regulated TGF-β protein levels and the level of BD skin and BD eye mice showed similar results. IFN-γ protein levels were -23.0±10.5 pg/ml in BD skin (n=9) compared to -29.7±7.0 pg/ml in BD eye (n=7)(p=0.16), therefore, CD4+CD25+T cells transfer down-regulated IFN-γ and BD eye was lower than BD skin but not significant. TNFα protein levels were -26.8±9.6 pg/ml in BD skin (n=9) and -25.3±11.7 pg/ml in BD eye (n=7), so, TNF-α protein levels were decreased by CD4+CD25+T cells transfer but BD skin and BD eye were not different. IL-6 protein levels were -192.4±32.4 pg/ml in BD skin (n=9) compared to -155.8±64.6 pg/ml in BD eye (n=7)(p=0.16), thus, BD eye was higher than BD skin but
not significant. IL17 protein levels were 23.2±4.1 pg/ml in BD skin (n=9) compared to -13.2±8.7 pg/ml in BD eye (n=7)(p=0.009), so, BD eye was significantly higher than BD skin. Interestingly, IL-17 only showed statistically significant difference between BD skin and BD eye. Also IFN-γ was affected more in BD eye than BD skin.
A B IL-10 -100 -50 0 50 100 150 200 250 p=0.37 D if fe re n c e (p g /m l) skin eye IL-10 -100 -50 0 50 100 150 200 250 p=0.37 D if fe re n c e (p g /m l) skin eye TGF-beta -10 0 10 20 30 40 50 60 70 D if fe re n c e (n g /m l) skin eye TGF-beta -10 0 10 20 30 40 50 60 70 D if fe re n c e (n g /m l) skin eye C D IFN-gamma -50 -40 -30 -20 -10 0 p=0.16 D if fe re n c e (p g /m l) skin eye IFN-gamma -50 -40 -30 -20 -10 0 p=0.16 D if fe re n c e (p g /m l) skin eye p=0.16 D if fe re n c e (p g /m l) skin eye TNF-alpha -50 -40 -30 -20 -10 0 skin eye D if fe re n c e (p g /m l) TNF-alpha -50 -40 -30 -20 -10 0 skin eye D if fe re n c e (p g /m l) E F IL-6 -250 -200 -150 -100 -50 0 p=0.16 D if fe re n c e (p g /m l) skin eye IL-6 -250 -200 -150 -100 -50 0 p=0.16 D if fe re n c e (p g /m l) skin eye IL-17 -30 -20 -10 0 10 p=0.009 skin eye D if fe re n c e (p g /m l) IL-17 -30 -20 -10 0 10 p=0.009 skin eye D if fe re n c e (p g /m l)
Fig. 9. The differences of serum cytokine amounts between the average of not
transferred BD-like mice and 3x10⁵CD4+CD25+T cells transferred each BD-like mice
by ELISA. The difference is displayed separately in BD skin symptomatic mice (BD
skin) and BD ocular symptomatic mice with skin symptom (BD eye).
A. IL-10 protein level in BD skin was higher than BD eye, B. TGF-β protein level was not different in BD skin and BD eye, C. IFN-γ protein level in BD eye was lower than BD skin but not significant, D. TNF-α protein level was not different between BD skin and BD eye, E. IL-6 protein level in BD eye was higher than BD skin but not significant, F. IL-17 protein level in BD eye was significantly higher than BD skin. The short bars indicate the means. BD skin: BD skin symptomatic mice (n=9), BD eye: BD ocular symptomatic mice with skin symptom (n=7), Difference: The amount of protein by ELISA in CD4+CD25+T cell transferred BD-like mice subtracted by the average of not transferred BD-like mice
Table 3. The serum cytokine level from each CD4+CD25+T cells transferred BD-like mice and the difference of between
CD4+CD25+T cells transferred BD-like mice and not transferred BD-like mice average.
IL-10 (pg/ml) TGF-β (ng/ml) IFN-γ (pg/ml) TNF-α (pg/ml) IL-6 (pg/ml) IL-17 (pg/ml) Mouse
No. Transfer Difference Transfer Difference Transfer Difference Transfer Difference Transfer Difference Transfer Difference
1 195.6 120.3 10.5 5.9 6.3 -31.1 47.4 -20.4 60.2 -155.0 15.8 -22.2 2 117 41.7 4.7 0.0 12.7 -24.7 32.4 -35.4 37.1 -179.0 13.8 -24.2 3 219.1 143.8 4.2 -0.5 28.7 -8.7 39.5 -28.3 0.0 -216.0 10.0 -28.0 4 229.3 154.0 11.1 6.4 2.6 -34.8 36.8 -31.0 0.0 -216.0 16.4 -21.6 5 179.3 104.0 11.8 7.1 31.3 -6.1 54.4 -13.4 19.2 -196.0 17.8 -20.2 6 86.3 11.0 54.7 50.0 22.0 -15.4 40.6 -27.2 0.0 -216.0 12.1 -25.9 7 206.5 131.5 29.5 24.8 6.3 -31.1 55.0 -12.8 88.7 -127.0 21.6 -16.4 8 35.8 -40.0 3.4 -1.3 12.9 -24.5 35.7 -32.1 0.0 -216.0 19.3 -18.7 9 119.0 43.7 12.7 8.0 8.4 -29.0 27.1 -40.7 3.6 -212.0 11.8 -26.2 10 236.4 161.1 65.8 61.1 7.9 -29.5 36.8 -31.0 167.5 -48.1 26.8 -11.2 11 120.0 44.7 15.6 10.9 0.2 -37.3 37.9 -30.0 127.1 -88.5 26.6 -11.4 12 77.1 1.8 9.0 4.3 10.2 -27.2 63.3 -4.5 69.3 -146.0 22.8 -15.2 13 57.7 -17.6 7.8 3.1 20.0 -17.4 30.8 -37.0 3.82 -212.0 21.6 -16.4 14 25.0 -50.3 12.5 7.8 1.8 -35.7 53.8 -14.0 26.9 -189.0 42.3 4.3
15 0.0 -75.3 4.8 0.1 2.4 -35.0 34.0 -33.8 7.92 -208.0 17.0 -21.0
16 281.4 206.0 3.5 -1.2 11.4 -26.0 41.2 -26.6 16.4 -199.0 10.6 -27.4
Not transfer
75.3 4.7 37.4 67.8 215.6 38.0
* Transfer: CD4+CD25+T cells transferred to BD-like mice; Difference: The difference between CD4+CD25+T cells transferred to BD-like mice and not transferred BD-like mice. The serum amount of cytokine of CD4+CD25+T cells transferred BD-like mice was subtracted from not transferred BD-like mice; Not transfer: The average amount of not transferred BD-like
Ⅳ. DISCUSSION
Our results show the number of CD4+CD25+T cells in BD-like mice were significantly lower than both BDN and normal mice. Moreover, frequency of Treg cells in BD-like mice was lower than BDN and normal mice. It has been reported that CD4+CD25+ Treg cells are lower in autoimmune and inflammatory diseases, such as Crohn’s Disease (Ricciardelli, et al., 2008), Multiple Sclerosis (MS)(Huan, et al., 2005), and Systemic Lupus Erythematosus (Lee, et al., 2008), than in healthy control and inactive patients. Also mouse models of autoimmune and autoinflammatory, such as collagen-induced arthritis (Morgan, et
al., 2005) and experimental autoimmune encephalomyelitis (EAE)(Begum-Haque, et al.,
2008), were lower than healthy mice. But CD4+CD25+ Treg cells in rheumatoid arthritis was not different (Lee, et al., 2008) or higher than healthy controls (Han, et al., 2008). Interestingly, Nanke et al. reported that the percentage of Treg cells among CD4+T cells from BD patients with an ocular attack were significantly decreased before ocular attack compared with those after ocular attack (Nanke, et al., 2008). Treg cells of BD-like mice with symptoms maintain lower levels than normal mice.
IL-2 and TGF-β are T cell growth factors and these can induce CD4+CD25+ Treg cells (Zheng, et al., 2007). In addition, these cytokines play important roles in the development, survival, and function of CD4+CD25+ Treg cells (Zheng, et al., 2007). Our experiments have shown these cytokines effectively expand CD4+CD25+ Treg cells. Furthermore CD4+CD25+T and Treg cell levels by primary culture of normal splenocytes
were higher, compared to BD-like and BDN mice. Marguti et al. reported that bone marrow-derived DCs from BALB/c mice were able to promote expansion of CD4+CD25+ Treg cells
in vitro. Both mature and immature DCs are capable of expanding the CD4+CD25+ Treg
cell population (Marguti, et al., 2008). Our results show the frequencies of CD4+CD25+T and Treg cells from the co-culture with CD4+T cells isolated from normal splenocytes and normal mDC was higher than CD4+T cells from splenocytes of BDN and BD-like mice. But, the frequencies of CD4+CD25+T and Treg cells from co-culture with normal CD4+T cells and each group of mDCs (normal, BDN, and BD-like) were not different among groups. According to Fig. 2 and Fig. 3, we show the proliferation of CD4+CD25+T and Treg cells from normal healthy mice was higher than from BDN and BD-like mice. The proliferation of CD4+CD25+T and Treg cells was more dependent to CD4+T cell than DCs.
Increased regulatory T cell numbers or functions have been associated with improvement of inflammatory symptoms, such as MS, EAE, and diabetes in mice and humans (Baecher-Allan, et al., 2004; McGeachy, et al., 2005; Kukreja, et al., 2002; Sakaguchi , 2004; Viglietta, et al., 2004). CD4+CD25+ Treg cells have a role in maintaining immunologic self-tolerance and lead to the decrease of spontaneous development of various autoimmune diseases (Takahashi, et al., 1998). Therefore we forecasted improvement of symptoms of BD-like mice by transfer with CD4+CD25+T cells on the basis of the foundation of our results. After transfer with CD4+CD25+T cells, the frequencies of
CD4+CD25+T cells. According to the amount of transferred CD4+CD25+T cells, frequencies of CD4+CD25+T and Treg cells were changed in splenocytes of BD-like mice. We show CD4+CD25+T and Treg cells were up-regulated by transfer with CD4+CD25+T cells. After CD4+CD25+T cells transfer, we observed a change of symptoms in BD-like mice. Two weeks after transfer, the symptoms of BD-like mice showed improvement and also the disease severity score was decreased compared to transfer of CD4+CD25-T cells to BD-like mice. It has been reported that disease severity score decreased by transfer with CD4+CD25+T cell in EAE (Zhang, et al., 2004) and CIA (Morgan, et al., 2005). We will do further research at a later date to confirm direct effect or proliferation. The improvement of symptoms and increase of Treg in peripheral tissues occurred after CD4+CD25+T cells transfer. Therefore, adoptive transfer definitely affected the improvement of BD-like symptoms.
After transfer of CD4+CD25+T cells, cytokine expression profiles were compared with control groups. Our results show the expression of TGF-β and IL-10 was increased after transfer compared to not transferred BD-like mice. Zheng et al. reported that CD4+CD25+T cells cultured, with TGF-β and IL-2, changed cytokines levels of IL-10 and TGF-β. IL-10 and TGF-β were increased but IFN-γ was decreased (Zheng, et al., 2004). According to a paper of Chai et al . Treg cells have up-regulated TGF-β and IL-10 (chai, et
al., 2008). We show CD4+CD25+T cell transfer regulated the improvement of symptoms
through up-regulation of TGF-β and IL-10. TNF-α, and IFN-γ levels were decreased after transfer compared to not transferred BD-like mice. IFN-γ is a Th1 cytokine (Mosmann, et al., 1989). TNF-α is a mediator of inflammatory and immune functions. Th17 cells are highly
pro-inflammatory cells and emerging data suggest that they orchestrated tissue inflammation and organ-specific autoimmune diseases (Bettelli, et al., 2007). IL-17 is a Th17 cell mediated cytokine and IL-6 inhibits CD4+CD25+T cell regulatory functions (Wan, et al., 2007). IL-6 is highly elevated in the culture supernatants of peripheral blood mononuclear cells (PBMC) of patients with active Behcet’s disease (Yamakawa, et al., 1996). From our results, IL-17 and IL-6 proteins were decreased by transfer with CD4+CD25+T cells to BD-like mice and indicated similar levels of BDN mice. Foxp3 inhibits RORγt-mediated IL-17A mRNA transcription (Ichiyama, et al., 2008). mRNA levels of ROR-γt, transcription factor
of Th17 cells, in 3 x 10⁵CD4+CD25+T cells transferred BD-like mice were lower than not
transferred BD-like mice. The levels of IL-17A (IL-17) and IL-17F produced by Th-17 cells
in 3 x 10⁵CD4+CD25+T cells transferred like mice were lower than not transferred
BD-like mice. Also Th17 cell-mediated cytokines and transcription factors were inhibited by CD4+CD25+ Treg cells transfer.
In summary, frequency of CD4+CD25+ Treg cells in BD-like mice was lower than BDN and normal mice. In vitro, the proliferation of splenocytes from BD-like mice was doen-regulated compared to BDN. Adoptive transfer of CD4+CD25+T cells in BD-like mice improved symptoms and up-regulated CD4+CD25+T cells from splenocytes. After transfer of CD4+CD25+T cells, IL-10 and TGF-β expressions increased but IFN-γ, TNF-α, IL-6, and IL-17 expressions decreased compared with not transfer BD-like mice.
Ⅴ. CONCLUSION
We confirmed the frequency of CD4+CD25+T cells in BD-like mice was lower than BDN mice. CD4+CD25+T and Treg cell levels by primary culture of splenocytes were lower in BD-like mice compared to BDN mice. The frequencies of CD4+CD25+T and Treg cells in co-cultures from normal CD4+T cells isolated from splenocytes with normal mDC was higher than CD4+T cells from splenocytes of BDN and BD-like. In vivo, the frequency
of CD4+CD25+T cells were higher in transfer with 3 x 10⁵CD4+CD25+T cells in BD-like
mice compared to transfer with 3 x 10³and 3 x 10⁴CD4+CD25+T cells. In addition, transfer
with CD4+CD25+T cells to BD-like mice improved the BD-like symptoms. The severity scores were accordingly decreased compared to transfer of CD4+CD25-T cells to BD-like
mice. After 3 x 10⁵ CD4+CD25+T cells transfer, the severity score of BD-like mice was
decreased compared to before the transfer. The serum protein levels of TGF-β and IL-10 in
BD-like mice transferred with 3 x 10⁵ CD4+CD25+T cells were higher, but IFN-γ, TNF-α,
IL-6, and IL-17 were lower than not transferred BD-like mice. The mRNA level of TGF-β was also affected in the transfer of CD4+CD25+T cells. TGF-β was higher than not transferred BD-like mice. Whereas IFN-γ, TNF-α, IL-17A, IL-17F, and ROR-γt of transferred with CD4+CD25+T cells were lower than not transferred BD-like mice.
REFERENCES
1. Adam B, Calikoglu E. Serum interleukin-6, procalcitonin and C-reactive protein levels in subjects with active Behçet’s disease. J Eur Acad Dermatol Venereol 18:318-320, 2004
2. Akdeniz N, Esrefoglu M, Keleş MS, Karakuzu A, Atasoy M. Serum interleukin-2, interleukin-6, tumour necrosis factor-alpha and nitric oxide levels in patients with Behcet's disease. Ann Acad Med Singapore 33:596-599, 2004
3. al-Dalaan A, al-Sedairy S, al-Balaa S, al-Janadi M, Elramahi K, Bahabri S. Enhanced interleukin 8 secretion in circulation in patients with Behçet’s disease. J Rheumatol 22: 904-907, 1995
4. Amelsfort J, Jacvobs K, Bijlsma J, Lafeber F, Taams L. CD4+ CD25+ regulatory T cells in rheumatoid arthritis: Difference in the presence, phenotype, and function between peripheral blood and synovial fluid. Arthritis Rheum 50:2775-2785, 2004
5. Baecher-Allan C, Hafler DA. Suppressor T cells in human diseases. J Exp Med 200:273-276, 2004
experimental autoimmune encephalomyelitis. J Neuroimmunol 204:58-65, 2008
7. Bettelli, E., M. Oukka, and V. K. Kuchroo. TH-17 cells in the circle of immunity and autoimmunity. Nat. Immunol 8:345-350, 2007
8. Chai JG, Coe D, Chen D, Simpson E, Dyson J, Scott D. In vitro expansion improves in vivo regulation by CD4+CD25+ regulatory T cells. J Immunol 180:858-69, 2008
9. Cao D. Isolation and functional characterization of regulatory CD25brightCD4 T cells from the target organ of patients with rheumatoid arthritis. Eur J Immunol 33:215-223, 2003
10. Choi B, Hwang Y, Kwon HJ, Lee ES, Park KS, Bang D, Lee S, Sohn S. Tumor necrosis factor alpha small interfering RNA decreases herpes simplex virus-induced inflammation in a mouse model. J Dermatol Sci 52:87-97, 2008
11. Crispin JC, Martinez A, Varela JA. Quantification of regulatory T cells in patients with systemic lupus erythematosus. J Autoimmun 21:273-276, 2003
12. Derynck R, Jarrett JA, Chen EY, Goeddel DV. The murine transforming growth factor-beta precursor. J Biol Chem 261:4377- 4379, 1986
13. Dieckmann D, Plottner H, Berchtold S, Berger T, Schuler G. Ex vivo isolation and characterization of CD4+CD25+ T cells with regulatory properties from human blood. J
Exp Med 193:1303-1310, 2001
14. Dieckmann D, Bruett CH, Ploettner H, Lutz MB, Schuler G. Human CD4+CD25+ regulatory, dependent T cells induce interleukin 10-producing, contact-independent type 1-like regulatory T cells. J Exp Med 196:247-253, 2002
15. Fantini MC, Becker C, Monteleone G, Pallone F, Galle PR, Neurath MF. TGF-beta induces a regulatory phenotype in CD4+CD25- T cells through Foxp3 induction and down-regulation of Smad7. J Immunol 172:5149-5153, 2004
16. Hamzaoui K, Hamzaoui A, Houman H. CD4+CD25+ regulatory T cells in patients with Behçet's disease. Clin Exp Rheumatol 24:S71-S78, 2006
17. Han GM, O'Neil-Andersen NJ, Zurier RB, Lawrence DA. CD4+CD25high T cell numbers are enriched in the peripheral blood of patients with rheumatoid arthritis. Cell
Immunol 253:92-101, 2008
19. Hsu HC, Yang P, Wang J, Wu Q, Myers R, Chen J, Yi J, Guentert T, Tousson A, Stanus AL, Le TV, Lorenz RG, Xu H, Kolls JK, Carter RH, Chaplin DD, Williams RW, Mountz JD. Interleukin 17-producing T helper cells and interleukin 17 orchestrate autoreactive germinal center development in autoimmune BXD2 mice. Nat Immunol 9:124-126, 2008
20. Huan J, Culbertson N, Spencer L, Bartholomew R, Burrows GG, Chou YK, Bourdette D, Ziegler SF, Offner H, Vandenbark AA. Decreased FOXP3 levels in multiple sclerosis patients. J Neurosci Res 81:45-52, 2005
21. Ichiyama K, Yoshida H, Wakabayashi Y, Chinen T, Saeki K, Nakaya M, Takaesu G, Hori S, Yoshimura A, Kobayashi T. Foxp3 Inhibits ROR{gamma}t-mediated IL-17A mRNA Transcription through Direct Interaction with ROR{gamma}t. J Biol Chem 283: 17003-17008, 2008
22. Jonuleit H, Schmitt E, Kakirman H, Stassen M, Knop J, Enk AH. Infectious tolerance: human CD25(+) regulatory T cells convey suppressor activity to conventional CD4(+) T helper cells. J Exp Med. 196:255-260, 2002
23. Katsantonis J, Adler Y, Orfanos CE, Zouboulis CC. Adamantiades– Behçet’s disease: serum IL-8 is more reliable marker for disease activity than C-reactive protein and erythrocyte sedimentation rate. Dermatology 201:37-39, 2000
24. Kimura A, Naka T, Kishimoto T. IL-6-dependent and -independent pathways in the development of interleukin 17-producing T helper cells. Proc Natl Acad Sci USA 104: 12099-12104, 2007
25. Korn T, Oukka M. Dynamics of antigen-specific regulatory T-cells in the context of autoimmunity. Semin Immunol 19:272-278, 2007
26. Kukreja A, Cost G, Marker J, Zhang C, Sun Z, Lin-Su K, Ten S, Sanz M, Exley M, Wilson B, Porcelli S, Maclaren N. Multiple immuno-regulatory defects in type-1 diabetes. J Clin Investig 109:131-140, 2002
27. Kulkarni AB, Karlsson S. Transforming growth factor-beta-1 knockout mice - a mutation in one cytokine gene causes a dramatic inflammatory disease. Am J Pathol 143:3-9, 1993
28. Langrish CL, Chen Y, Blumenschein WM, Mattson J, Basham B, Sedgwick JD, McClanahan T, Kastelein RA, Cua DJ. IL-23 drives a pathogenic T cell population that induces autoimmune inflammation. J Exp Med 201:233-240, 2005
30. Lindén A, Hoshino H, Laan M. Airway neutrophils and interleukin-17. Eur Respir J 15: 973-977, 2000
31. Marguti I, Yamamoto GL, da Costa TB, Rizzo LV, de Moraes LV. Expansion of
CD4(+)CD25(+) Foxp3(+) T cells by bone marrow-derived dendritic cells. Immunology Sep 5 [Epub ahead of print], 2008
32. Matusevicius D, Kivisäkk P, He B, Kostulas N, Ozenci V, Fredrikson S, Link H.
Interleukin-17 mRNA expression in blood and CSF mononuclear cells is augmented in multiple sclerosis. Mult Scler 5:101–104, 1999
33. McGeachy MJ, Stephens LA, Anderton SM. Natural recovery and protection from autoimmune encephalomyelitis: contribution of CD4+CD25+ regulatory cells within the central nervous system. J Immunol 175:3025-3032, 2005
34. Morgan ME, Flierman R, van Duivenvoorde LM, Witteveen HJ, van Ewijk W, van Laar JM, de Vries RR, Toes RE. Effective treatment of collagen-induced arthritis by adoptive transfer of CD25+ regulatory T cells. Arthritis Rheum 52:2212-2221, 2005
35. Mosmann, T.R, Coffman, R.L. Th1 and Th2 cell: different patterns of lymphokine secretion lead to different functional properties. Annu Rev immunol 7:145-173, 1989
disease. Relation of serum Creactive protein and erythrocyte sedimentation rates to disease activity. Int J Dermatol 25:235-239, 1986
37. Murray LJ, Lee R, Martens C. In vivo cytokine gene expression in T cell subsets of the autoimmune MRL/Mp-lpr/lpr mouse. Eur J Immunol 20:163-170, 1990
38. Nanke Y, Kotake S, Goto M, Ujihara H, Matsubara M, Kamatani N. Decreased percentages of regulatory T cells in peripheral blood of patients with Behcet's disease before ocular attack: a possible predictive marker of ocular attack. Mod Rheumatol 18:354-358, 2008
39. Oukka, M. Interplay between pathogenic Th17 and regulatory T cells. Ann Rheum Dis 66:iii87-iii 90, 2007
40. Papiernik M, do Carmo Leite-de-Moraes M, Pontoux C, Joret AM, Rocha B, Penit C, Dy M. T cell deletion induced by chronic infection with mouse mammary tumor virus spares a CD25-positive, IL-10-producing T cell population with infectious capacity. J Immunol 158:4642-4653, 1997