In vivo transfection system of the
nfa1 gene cloned from pathogenic
In vivo transfection system of the
nfa1 gene cloned from pathogenic
In vivo transfection system of the nfa1 gene
cloned from pathogenic Naegleria fowleri
by
Suk Yul Jung
A Dissertation Submitted to The Graduate School of Ajou University in Partial Fulfillment of the Requirements for the Degree of
DOCTOR OF PHILOSOPHY
Supervised by
Ho-Joon Shin, Ph.D.
Department of Medical Sciences
The Graduate School, Ajou University
-ABSTRACT-
In vivo transfection system of the nfa1 gene
cloned from pathogenic Naegleria fowleri
The nfa1 gene cloned from pathogenic amoeba, Naegleria fowleri consists of 360
bp and encodes the Nfa1 protein (13.1 kDa) which is located in pseudopodia of the
amoeba by immunochemistry as shown in the previous paper. On the contrary, in
nonpathogenic N. gruberi having an nfa1 gene, the Nfa1 protein was not detected by
western blotting using an anti-Nfa1 antibody. It was identified that other free-living
amoebae, Acanthamoeba spp. except for nonpathogenic A. royreba had an nfa1 gene
by RT-PCR, which suggested the possible involvement of nfa1 gene in in vitro
cytotoxicity and in vivo pathogenicity of N. fowleri.
In this study, DNA of the nfa1 gene was transfected into nonpathogenic N.
gruberi to address whether the nfa1 gene cloned from N. fowleri is related with in vitro cytotoxicity and in vivo pathogenicity. Eukaryotic transfection vector, pEGFP-C2 containing a CMV promoter and GFP gene, was used. Experimental vector was
pEGFP-C2/nfa1UTR (nfa1UTR containing 5' UTR, nfa1 ORF, and 3' UTR). After
transfection using SuperFectT M reagent, the green fluorescence expressed from N.
gruberi transfected with pEGFP-C2/nfa1UTR vector was observed in the cytoplasm of N. gruberi and the transfected N. gruberi was preserved over 9 months by G418
selection. The transfected nfa1 gene was observed by PCR using nfa1- and
pEGFP-C2/nfa1UTR vector. The nfa1 and GFP gene were also identified by RT-PCR in the
transgenic N. gruberi. The Nfa1 protein from the transgenic N. gruberi was
expressed and identified as a 13.1 kDa of band by western blotting using an
anti-Nfa1 antibody. Finally, N. gruberi transfected with pEGFP-C2/nfa1UTR vector
could induce the in vitro cytotoxicity but not in vivo pathogenicity. In conclusion, I
have established an efficient transfection system for N. gruberi for the first time.
Stable transfection into N. gruberi was established by using my system and the
expressed Nfa1 protein enhanced in vitro cytotoxicity of N. gruberi but not the in
vivo pathogenicity, suggesting the possible involvement of another factor(s) for in vivo pathogenicity of amoeba.
____________________________________________________________________
Key Words: Naegleria fowleri, Naegleria gruberi, nfa1 gene, in vivo transfection, in
TABLE OF CONTENTS
TITLE PAGE --- 1 ABSTRACT --- 2 TABLE OF CONTENTS --- 4 LIST OF FIGURES --- 7 LIST OF TABLES --- 9 ABBREVIATIONS --- 10 I. INTRODUCTION --- 12A. Free- living amoebae --- 12
B. Primary Amoebic Meningoencephalitis (PAME) --- 13
C. Pathogenicity --- 15
D. Gene transfer to eukaryotic cells --- 17
E. Consideration of the transfection --- 19
1. Use of strong and constitutive promoter --- 19
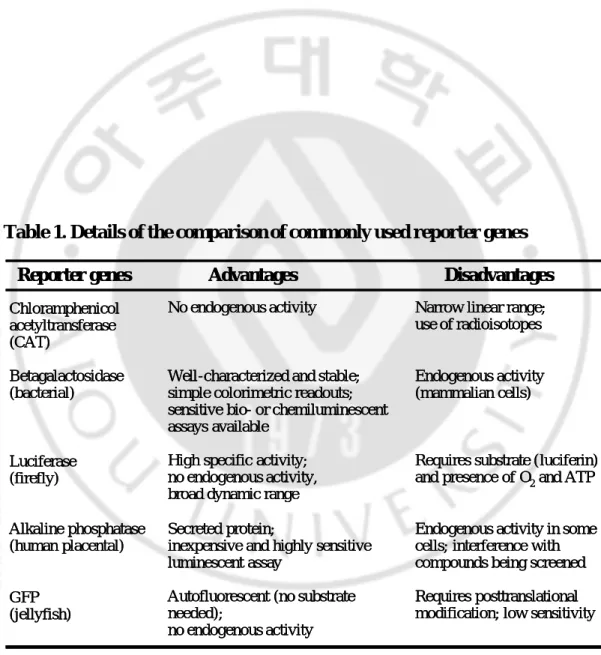
2. Reporter genes used commonly as screenable marker genes --- 20
3. Selection of transfected cells with antibiotics for stable transfectants --- 22
4. Choice of pEGFP-C2 vector --- 22
F. Introduction of N. fowleri antigen 1 (nfa1) gene and theme of this study --- 23
A. Materials --- 26
1. Animals --- 26
2. Reagents --- 26
B. Methods --- 28
1. Culture of Naegleria spp. --- 28
2. Construction of eukaryotic expression vectors --- 28
3. Transfection and G418 selection --- 31
4. Observation of EGFP expression and measurement of transfection efficiency in N. gruberi --- 34
5. PCR of a gDNA in N. gruberi --- 34
6. Reverse transcription (RT) PCR --- 35
7. Western blotting --- 37
8. Indirect immunofluorescence (IFA) test --- 38
9. In vitro cytotoxicity --- 39
10. In vivo pathogenicity --- 40
III. RESULTS --- 41
A. Description of nfa1UTR, ubiquitin gene, and the construction of transfection vectors --- 41
B. Transfection and expression of EGFP in N. gruberi --- 41
C. nfa1 gene in free- living amoebae --- 48
D. Integration of the pEGFP-C2/nfa1UTR vector into
5 3
E. Transcription and expression of the nfa1 gene in N. gruberi
transfected with pEGFP-C2/nfa1UTR vector --- 56
F. Cellular localization of Nfa1 protein --- 59
G. In vitro cytotoxicity of transgenic N. gruberi against CHO cells --- 59
H. Mortality of mice infected with transgenic N. gruberi --- 62
IV. DISCUSSION --- 66
V. CONCLUSION --- 72
BIBLIOGRAPHY --- 73
LIST OF FIGURES
Fig. 1. The life cycles of free- living amoebae --- 14
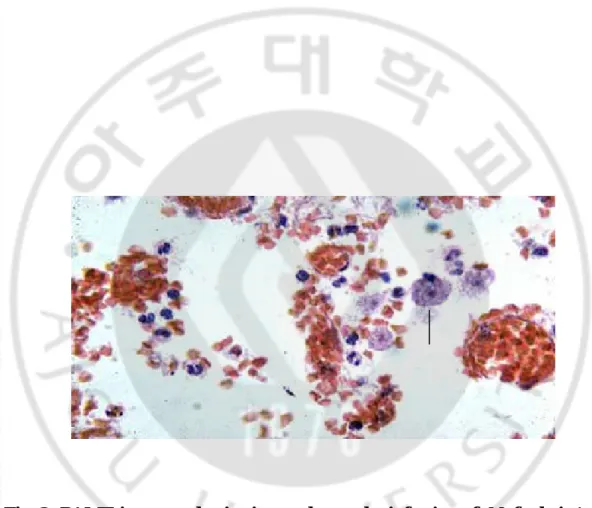
Fig. 2. PAME in mouse brain tissues due to the infection of N. fowleri --- 16
Fig. 3. Schematic representation of an activated dendrimer (left) and model of the SuperFectT M-DNA complex (right) --- 32
Fig. 4. The sequences of nfa1 and nfa1UTR --- 42
Fig. 5. Nucleotide sequences of the ubiquitin promoter in Acanthamoeba spp. --- 43
Fig. 6. Construction of eukaryotic transfection vectors --- 44
Fig. 7. Construction of eukaryotic transfection vectors --- 45
Fig. 8. Construction of eukaryotic transfection vectors --- 46
Fig. 9. Transfection efficiency by FACS analysis --- 47
Fig. 10. Photographs of trans fected N. gruberi trophozoites --- 49
Fig. 11. Western blotting for identifying the Nfa1 protein --- 50
Fig. 12. Identification of an nfa1 gene from gDNA of Naegleira spp. by PCR --- 51
Fig. 13. Identification of cDNA of an nfa1 gene in Naegleria spp. and Acanthamoeba spp. by RT-PCR --- 52
Fig. 15. Identification of transfection from gDNA by PCR --- 55
Fig. 16. Identification of transfection from gDNA by PCR --- 57
Fig. 17. RT-PCR of cDNA from N. gruberi transfected
with pEGFP-C2/nfa1UTR vector --- 58
Fig. 18. Identification of Nfa1 protein from lysate by Western blotting
(after 15% SDS-PAGE) with anti-Nfa1 polyclonal antibody --- 60 Fig. 19. Localization of Nfa1 protein in N. gruberi transfected
with pEGFP-C2/nfa1UTR vector --- 61
LIST OF TABLES
Table 1. Details of the comparison of commonly used reporter genes --- 21
Table 2. Primers used to clone the vectors for the transfection --- 30
Table 3. Primers used for PCR of gDNA or cDNA --- 36
Table 4. Measurement of in vitro cytotoxicity of N. fowleri, N. gruberi,
and transgenic N. gruberi against CHO cells by LDH release assay --- 64
Table 5. Mortality of mice infected with N. fowleri,
ABBREVIATIONS
AP BCIP CAT CHO CMV CNS CSF DEAE DEPC-DW EGFP EMEM FBS GAE gDNA GFP IFA LDH MCS NBT Alkaline phosphatase Bromo-chloro-indolyl-phosphate Chloramphenicol acetyltransferaseChinese hamster ovary
Cytomegalovirus
Central nervous system
Cerebrospinal fluid
Diethylaminoethyl
Diethylpyrocarbonate-treated distilled water
Enhanced GFP
Earle’s minimal essential medium
Fetal bovine serum
Granulomatous amebic encephalitis
Genomic DNA
Green fluorescent protein
Indirect immunoflourescence
Lactate dehydrogenase
Multicloning site
neo nfa1 ORF PAGE PAME PBS PBST RSV-LTR SDS UTR Neomycin phosphotransferase
Naegleria fowleri antigen 1 Open reading frame
Polyacrylamide gel electrophoresis
Primary amoebic meningoencephalitis
Phosphate buffered saline
PBS containing Tween 20
Rous sarcoma virus- long terminal repeat
Sodium dodecyl sulfate
I. INTRODUCTION
A. Free-living amoebae
Free-living amoebae belonging to the genera Naegleria, Acanthamoeba, and
Balamuthia are important causes of disease in humans and animals. Human disease caused by free-living amoebae was first reported in 1965 by Fowler and Carter, who
studied four patients with Primary amoebic meningoencephalitis (PAME) in South
Australia.1 Naegleria spp. and Acanthamoeba spp. have been commonly found in
lakes, swimming pools, tap water, and heating and air conditioning units. There are
six species of Naegleria: N. fowleri, N gruberi, N. australiensis, N. lovaniensis, N.
jadinii, and N. thorntoni.2,3 Naegleria fowleri, sometimes called N. aerobia4-6
produces an acute, and usually lethal, central nervous system (CNS) disease of
PAME.7-9 The infection results from introduction of water containing amoebae into
the nasal cavity and subsequent passage of the organisms to the CNS via the
olfactory apparatus.10-12 N. gruberi, a nonpathogenic species, was the first member of
the genus to be described and has been used extensively to define the molecular
biology of cellular differentiation.13 Acanthamoeba spp. and Balamuthia
mandrillaris are opportunistic free-living amoebae capable of causing granulomatous amebic encephalitis (GAE) in individuals with compromised immune systems.
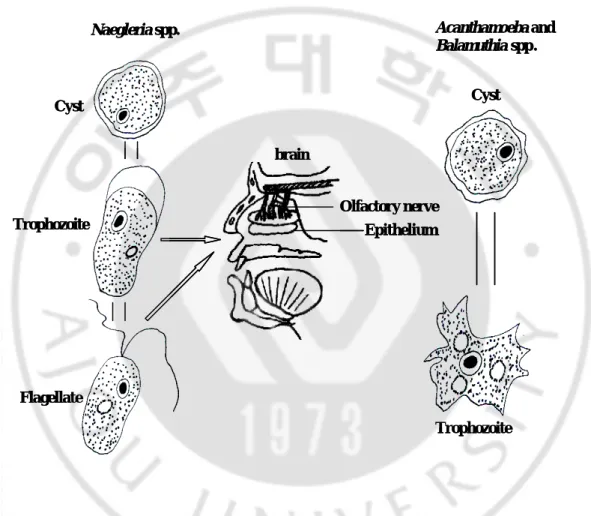
N. fowleri has three stages, cysts, trophozoites, and flagellate forms, in its life cycle (Fig. 1). Alternatively, the trophozoites can occur in two forms, amoeboid
and flagellate. The amoeboid form (the only form recognized in humans) is
elongated with a broad anterior end and tapered posterior end. The size ranges from 7
to 20 ìm. There is a large, central karyosome and no peripheral nuclear chromatin.
The cytoplasm is somewhat granular and contains vacuoles. The amoeboid form
replicates by promitosis (nuclear membrane remains intact). Amoeboid form can turn
into temporary flagellate forms which usually revert back to the amoeboid stage. The
flagellate form is pear-shaped, with two flagella at the broad end. These flagellate
forms do not divide, but when the flagella are lost, the amoeboid forms resume
reproduction. N. fowleri trophozoites are found in cerebrospinal fluid (CSF) and
tissue, while flagellate forms are found in CSF. Cysts from nature and from agar
cultures look the same and have a single nucleus almost identical to that seen in the
trophozo ite. They are generally round, measuring from 7 to 10 ìm, and there is a
thick double wall. Unlike N. fowleri, Acanthamoeba and Balamuthia have only two
stages, cysts and trophozoites, in their life cycle (Fig. 1). No flagellate stage exists as
part of the life cycle.
B. Primary Amoebic Meningoencephalitis (PAME)
PAME is a rapidly fatal disease which occurs generally in previously healthy
Presumably, infection results from introduction of water containing amoebae into the
nasal cavity and subsequent passage of the organisms to the CNS via the olfactory
brain Olfactory nerve Epithelium Trophozoite Cyst Flagellate Cyst Trophozoite
Naegleria spp. Acanthamoeba and
Balamuthia spp. brain Olfactory nerve Epithelium Trophozoite Cyst Flagellate Cyst Trophozoite
Naegleria spp. Acanthamoeba and
Balamuthia spp.
Fig. 1. The life cycles of free-living amoebae. Blank arrows show the route of
infection in Naegleria spp.. Naegleria spp. unlike other free- living amoebae have
three stage life cycles. Black arrows represent the morphological changes of
apparatus.7-9 Acute hemorrhagic necrotizing meningo-encephalitis follows invasion
of the CNS. Only amoebic tropho zoites are found in the lesions of patients with
PAME (Fig. 2).
PAME is a disease with an abrupt onset and a fulminant course. It is
characterized by the sudden onset of bifrontal or bitemporal headache, fever (from
38.2℃ to >40℃), nausea, vomiting (usually projectile), signs of meningeal irritation,
and encephalitis. There is often a rapid progression from fever and early signs of
leptomeningitis, encephalitis, or meningoencephalitis to coma and seizures. Nausea,
vomiting, photophobia, and other symptoms related to increase intracranial pressure
may also be prominent. The final diagnosis of PAME is based on the isolation and
culture of free-living amoebae from CSF or the demonstration of amoebic
trophozoites in biopsied brain tissue. Clinical diagnosis by experienced practitioners
is based on the characteristic stromal infiltrate. Antibodies may be detected in serum;
however, serologic tests usually are of no value in the diagnosis of infections with
free- living amoebae.14 Amphotercin B reportedly cured one case of PAME.15 High
morbidity and mortality may be reduced with rapid diagnosis and earlier treatment.
The studies of mechanisms of pathogenicity by free living amoebae have been
reported. In same free living amoeba, Acanthamoeba, with Naegleria,
cyto-pathogenic effects of Acanthamoeba on host cells require (i) adhesion of the amoeba
Fig. 2. PAME in mouse brain tissues due to the infection of N. fowleri . Arrow
indicates N. fowleri trophozoite surrounded by inflammatory cells (×400). The
to host cell,16 (ii) secretion of proteases,17 and (iii) phagocytosis. It has been shown
that adhesion is one of the crucial steps for the pathogenicity of amoeba16 as
non-pathogenic amoeba exhibit significant decreased binding to host cells. Yang et al.16
reported that the first step in the pathogenesis of Acanthamoeba infection involve
attachment of the parasite to the mannose residues of the plasma membrane
glycoproteins of host cells. This binding, in turn, may promote phosphorylation of
selective mannose residues by the amoeba enzyme, and it may be the presence of the
mannose-6-phosphate residues on the surface of host cells that is required for
infection to occur. According to Khan,18 the binding of Acanthamoeba to corneal
epithelial cells was acanthopodia-dependent as no binding of non-pathogenic amoeba
(which exhibit significant acanthopodia) with epithelial cells was observed. Also, he
reported that pathogenicity would be a complex process which involves both
contact-dependent and contact- incontact-dependent pathways in order to kill host cells quickly and to
reduce the degree to which defense can be induced.
D. Gene transfer to eukaryotic cells
Gene transfer to animal cells has been practiced now for over 40 years.
in culture, either to study gene function and regulation or to produce large amounts
of recombinant protein. Three techniques fall into three categories: transfection by
biochemical methods, transfection by physical methods, and virus- mediated
transduction. Some methods of these are as below. The first is DNA-calcium
phosphate coprecipitate method. The ability of mammalian cells to take up
exogenously supplied DNA from the ir culture medium was first reported by
Szybalska and Szybalski.19 The formation of a fine DNA/calcium phosphate
coprecipitate first settles on to the cells and is then internalized. It is thought that
small granules of calcium phosphate associated with DNA are taken up by
endocytois and transported to the nucleus, where some DNA escapes and can be
expressed.20 However, since the precipitate must coat the cells, this method is
suitable only for cells grown in monolayers, not those growing in suspension or as
clumps. Second, other chemical transfection methods are available. By the calcium
phosphate method, some cell lines are adversely affected by the coprecipitate due to
its toxicity and are hence difficult to transfect. Alternative chemical transfection
method has been developed to address this problem. One such method utilized
diethylaminoethyl dextran (DEAE-dextran), a soluble polycationic carbohydrate that
promotes interactions between DNA and the endocytotic machinery of the cell. It has
been reported that although efficient for the transient transfection of many cell types,
DEAE-dextran cannot be used to generate stably transformed cell lines. The third is
the method using phospholipid as gene delivery vehicle. It interacts with the target
terms of the number of transfo rmants obtained, but they are also labor- intensive and
so have not been widely adopted as a general transfection method. However, an
important advantage is that they are gentle, allowing the transfer of large DNA
fragments without shearing. More widespread use has been made of artificial
phospholipids vesicles, which are called liposomes.21 The low-toxicity transfection
method, commonly known as lipofection, which is applicable to many cell types that
are difficult to transfect by other means, including cells growing in suspension.22
Fourth, the electroporation method involves the generation of transient,
nanometer-sized pores in the cell membrane, by exposing cells to a brief pulse of electricity.
DNA enters the cell through these pores and is transported to the nucleus. The most
critical parameters are the intensity and duration of the electric pulse, and these must
be determined empirically for different cell types. Finally, there are direct transfer
methods. One such procedure is microinjection, a technique that is guaranteed to
generate successful hits on target cells but that can only be applied to a few cells in
any one experiment. In animals, this technique is most often used to transfect
multiple cells in tissue slices rather than cultured cells.23,24
E. Consideration of the transfection
Although the different expression systems vary in their total potential yield, in
term of vector design and experimental methodolo gy, the following consideration
1. Use of strong and constitutive promoter
Very active promoters provide the highest levels of transgene expression. In viral
vectors, the strongest endogenous promoters are used, for examples, human
cytomegalovirus (CMV) immediate early promoter, baculovirus polyhedron
promoter, adenoviral E1 promoter, and vaccinia virus p7.5 promoter, etc. Although
these function widely, they are not necessarily active in all mammalian cells, e.g., the
rous sarcoma virus long terminal repeat (RSV-LTR) promoter functions more poorly
in the Acanthamoeba than ubiquitin promoter from Acanthamoeba.25 According to
Kong et al,26 myosin gene was transcribed efficiently in Acanthamoeba under
ubiquitin promoter.
2. Reporter genes used commonly as screenable marker genes
Reporter genes are also known as screenable marker genes. Importantly, the
assays used to detect reporter gene activity are quantitative, so they can also be used
to measure transformation efficiency. The use of reporters is advantageous, because
it circumvents the necessity to derive different assays for individual genes and also
allows the activities of transgenes and homologous endogenous genes to be
genes are illustrated in Table 1. Especially, because green fluorescent protein (GFP)
exhibits the autofluorescence in transfected cells, it makes the efficiency of
transfection measure easily.
Table 1. Details of the comparison of commonly used reporter genes Reporter genes Advantages Disadvantages
Chloramphenicol acetyltransferase (CAT) Betagalactosidase (bacterial) Luciferase (firefly) Alkaline phosphatase (human placental) GFP (jellyfish) No endogenous activity
Well-characterized and stable; simple colorimetric readouts; sensitive bio- or chemiluminescent assays available
High specific activity; no endogenous activity, broad dynamic range Secreted protein;
inexpensive and highly sensitive luminescent assay
Autofluorescent (no substrate needed);
no endogenous activity
Narrow linear range; use of radioisotopes
Endogenous activity (mammalian cells)
Requires substrate (luciferin)
and presence of O2and ATP
Endogenous activity in some cells; interference with compounds being screened Requires posttranslational modification; low sensitivity
Reporter genes Advantages Disadvantages
Chloramphenicol acetyltransferase (CAT) Betagalactosidase (bacterial) Luciferase (firefly) Alkaline phosphatase (human placental) GFP (jellyfish) No endogenous activity
Well-characterized and stable; simple colorimetric readouts; sensitive bio- or chemiluminescent assays available
High specific activity; no endogenous activity, broad dynamic range Secreted protein;
inexpensive and highly sensitive luminescent assay
Autofluorescent (no substrate needed);
no endogenous activity
Narrow linear range; use of radioisotopes
Endogenous activity (mammalian cells)
Requires substrate (luciferin)
and presence of O2and ATP
Endogenous activity in some cells; interference with compounds being screened Requires posttranslational modification; low sensitivity
3. Selection of transfected cells with antibiotics for stable transfectants
If animal cells are exposed to toxic concentrations of certain drugs, rare
individual cells can survive because they have spontaneously undergone a mutation
that confers resistance to that drug. For example, neo gene (Neomycin
phosphotransferase from Escherichia coli) confers resistance to aminoglycoside
antibiotics. The concentration of antibiotics is determined with lethal dose which
makes the untransfected cells die after about one week. In addition to neo gene, there
has been used puromycin N-aceryltransferase from Streptomyces alboniger
conferring resistance to puromycin, or hygromycin phosphotransferase from E. coli
conferring resistance to hygromycin B, etc.
4. Choice of pEGFP-C2 vector
pEGFP-C2 vector encodes a red-shifted variant of wild-type GFP27-29 which has
been optimized for brighter fluorescence and higher expression in mammalian cells
(Excitation maximum = 488 nm; emission maximum = 507 nm). pEGFP-C2 vector
Phe-64 to Leu and Ser-65 to Thr. The coding sequence of the enhanced GFP (EGFP)
gene contains more than 190 silent base changes which correspond to human
codon-usage preferences.31 Sequences flanking EGFP have been converted to a Kozak
consensus translation initiation site32 to further increase the translation efficiency in
eukaryotic cells. The MCS in pEGFP-C2 vector is between the EGFP coding
sequences and the SV40 poly A. Genes cloned into the MCS will be expressed as
fusions to the C-terminus of EGFP if they are in the same reading frame as EGFP
and there are no intervening stop codons. SV40 polyadenylation signals downstream
of the EGFP gene direct proper processing of the 3' end of the EGFP mRNA. The
vector backbone also contains an SV40 origin for replication in mammalian cells
expressing the SV40 T-antigen. A neomycin-resistance cassette (neor), consisting of
the SV40 early promoter, the neomycin/kanamycin resistance gene of Tn5, and
polyadenylation signals from the Herpes simplex thymidine kinase gene, allows
stably transfected eukaryotic cells to be selected using G418. A bacterial promoter
upstream of this cassette (Pamp) expresses kanamycin resistance in E. coli. Fusions to
the C-terminus of EGFP retain the fluorescent properties of the native protein
allowing the localization of the fusion protein in vivo. The target gene should be
cloned into pEGFP-C2 vector so that it is in frame with the EGFP coding sequences,
with no intervening in- frame stop codons. The recombinant EGFP vector can be
transfected into mammalian cells using any standard transfection method. If required,
stable transformants can be selected using G418.33 pEGFP-C2 vector can also be
F. Introduction of N. fowleri antigen 1 ( nfa1) gene and theme of this study
Transfection system enables the study of gene function and regulation and
provides the technology to define the mechanisms regulating stage differentiation.34
Especially, it also will be able to contribute to the stud y of mechanisms of
pathogenicity. Transfection systems have been available for several important
species of protozoa, including Acanthamoeba sp., Entamoeba histolytica, members
of the kinetoplastida and the apicomplexan parasites Toxoplasma gondii and
Plasmodium spp..35-39 However, chromosome number and ploidy, as well as the
occurrence of sexual reproduction, are unknown in Naegleria spp., therefore,
classical mapping and genetic analysis is limited.35 The basic but important
technique for DNA transfection into Naegleria sp. has not been yet established.
At a molecular level, we previously reported the nfa1 gene encoding a 13.1 kDa
antigenic protein cloned from N. fowleri.40 An nfa1 gene consists of 360 bp, and the
Nfa1 protein is located in pseudopodia of trophozoite, which was identified by
immunocytochemistry with a transmission electron microscopic observation. The
Nfa1 protein was not detected in nonpathogenic N. gruberi by western blotting using
an anti-Nfa1 polyclonal antibody derived from BALB/c mouse, but the nfa1 gene
was detected in it by RT-PCR. It supports the fact that the nfa1 gene may be related
with the pathogenicity of Naegleria spp..41
to develop a stable transfection system, which would be helpful for this study
elucidating the mechanism of pathogenicity in Naegleria infection. For the
transfection of the nfa1 gene into N. gruberi, we have constructed some vectors
based on the C2 eukaryotic transfection vector, C2/nfa1,
pEGFP-C2/nfa1UTR, and other vectors containing an ubiquitin promoter. After each vector
was transfected with SuperFectTM reagent, expressed GFP was observed under a
fluorescent microscopy, and transfected nfa1 gene was detected by PCR. Also, the
Nfa1 protein expressed from transgenic N. gruberi was identified by western blotting
using an anti-Nfa1 antibody which was obtained from mice immunized with a
recombinant Nfa1 protein expressed from the N. fowleri nfa1 gene. Finally, the
experiments of in vitro cytotoxicity and in vivo pathogenicity were performed to
II. MATERIALS AND METHODS
A. Materials
1. Animals
7-week-old female BALB/c mice used in this experiment were purchased from
DaeHan Biolink (KIST, Daejeon, Korea) for in vivo pathogenicity.
2. Reagents
N. fowleri (ATCC No. 30215) and N. gruberi (ATCC No. 30960) were purchased from American Type Culture Collection (ATCC, Manassas, VA) for the transfection,
in vitro cytotoxicity, and in vivo pathogenicity.
pEGFP-C2 vector was purchased in Clontech Laboratories (Palo Alto,
California) for transfection and modified according to some purpose. pCR®
T7/NT-TOPO® vector was purchased in Invitrogen (San Diego, CA) to clone an nfa1 gene.
Kyung-pook University in Korea. The nfa1UTR sequence was kindly presented by Prof.
Park at Yonsei University in Korea. All primers were constructed in Bioneer Inc.
(Daejeon, Korea)
SuperFectT M reagent was purchased in Qiagen (GmbH, Germany) for
transfection.
All used restriction enzymes were purchased in New England Biolab Inc.
(Berverly, MA). FBS was purchased in Hyclone Laboratories (Logan, UT). The
penicillin, streptomycin, and G418 antibiotics was purchased in Gibco BRL
(Gaithersburg, MD).
25 cm2-culture flask and 24 well cell culture plate were purchased in Nunc A/S
(Roskilde, Denmark). The 0.22 µm syringe filter was purchased in Nalgene Europe Ltd. (Neerijse, Belgium).
Total RNA was prepared using an isolation kit RNAzolT M B (TEL-TEST,
Fiendswood, TX, USA). For reverse transcription, we used the Superscript First
Strand Synthesis System kit (Invitrogen, San Diego, CA). Taq DNA polymerase was
purchased in Promega (Madison, WI).
For western blotting and indirect fluorescent antibody (IFA) test, the secondary
antibody of a goat anti- mouse IgG conjugated with alkaline phosphatase (AP),
bromo-chloro- indolyl-phosphate (BCIP), and nitro blue tetrazolium (NBT) were
purchased in Sigma Chemical Co (St. Louis, MO) and the secondary antibody of an
AffiniPure rabbit anti- mouse IgG conjugated with rhodamine TRITC was obtained in
The Earle’s minimal essential medium (EMEM) was purchased in Gibco BRL
(Gaithersburg, MD) to culture chinese hamster ovary (CHO) cells.
CytoTox96® Non-radioactive Cytotoxicity Assay Kit for in vitro cytotoxicity was
purchased in Promega (Madison, WI).
B. Methods
1. Culture of Naegleria spp.
Trophozoites of N. fowleri (NF69 strain; ATCC No. 30215) were axenically
cultured in Nelson’s medium42 at 37 . Trophozoites of N. gruberi (ATCC No.
30960) were axenically cultured in 1034 modified PYNFH medium43 at 33 . They
were subcultured every week with about 80% confluence and N. gruberi was used as
the host for the transfection. Especially, optimal temperature of N. gruberi
commented in ATCC is 25 but it has been risen to 33 for the transfection, in vitro
cytotoxicity, and in vivo pathogenicity.
2. Construction of e ukaryotic e xpression vectors
The eukaryotic expression vectors transfected to nonpathogenic N. gruberi were
modified from the pEGFP-C2 vector (Clontech Laboratories, Palo Alto, California).
wild-type EGFP which has been optimized for brighter fluorescence and higher
expression in mammalian cells. It was used as a control construct.
An nfa1 gene (GeneBank Accession No. AF230370) was cloned into the
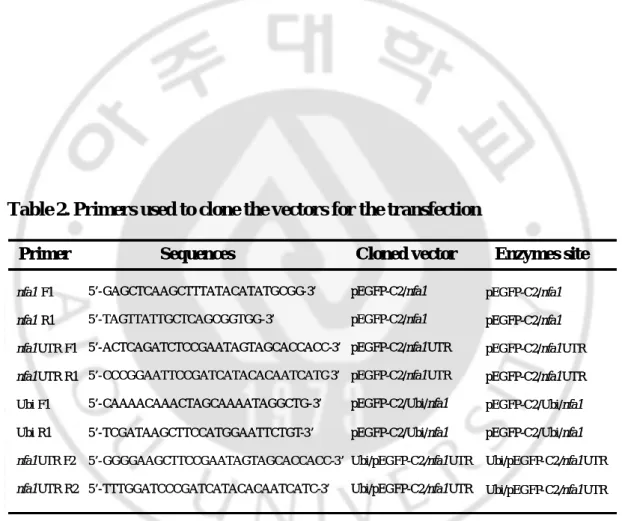
downstream of a gene encoding EGFP in a pEGFP-C2 vector. The various primers
for cloning are illustrated in Table 2.
The nfa1 gene was amplified from previously an nfa1 gene-cloned vector,
pCR®T7/NT-TOPO® (Invitrogen, San Diego, CA), by polymerase chain reaction
(PCR) using an nfa1 F1 primer containing Hind III site and an nfa1 R1 primer
containing Eco RI site, which produced 609 bp fragment. This fragment was cloned
into pEGFP-C2 vector using Hind III and Eco RI restriction sites to construct a
pEGFP-C2/nfa1 vector.
The nfa1UTR gene (kindly presented by Prof. Park at Yonsei University) was
cloned from a genomic DNA (gDNA) of N. fowleri. The nfa1UTR gene containing
5’ upstream regions, open reading frame (ORF), and 3’ downstream regions was
amplified by PCR using an nfa1UTR F1 primer containing Bgl II site and an
nfa1UTR R1 primer containing Eco RI site, which produced 615 bp fragment. This fragment was cloned into pEGFP-C2 vector using Bgl II and Eco RI sites to
construct a pEGFP-C2/nfa1UTR vector.
An ubiquitin promoter of 1894 bp from Acanthamoeba (kindly presented by Dr.
Kong at Kyung-pook University) was cloned into pEGFP-C2/nfa1 vector between
EGFP and nfa1 because it could act strongly more than CMV promoter in same
previously cloned pGL3 (Promega, Madison, WI) vector by PCR using an Ubi F1
primer containing Sac I site and an Ubi R1 primer containing Hind III site, which
produced a 1901 bp fragment. This fragment was cloned into pEGFP-C2/nfa1 vector
using Sac I and Hind III restriction sites to construct a pEGFP-C2/Ubi/nfa1 vector.
Table 2. Primers used to clone the vectors for the transfection
Primer Sequences Cloned vector Enzymes site
nfa1 F1 nfa1 R1 nfa1UTR F1 nfa1UTR R1 Ubi F1 Ubi R1 nfa1UTR F2 nfa1UTR R2 5’-GAGCTCAAGCTTTATACATATGCGG-3’ 5’-TAGTTATTGCTCAGCGGTGG-3’ 5’-ACTCAGATCTCCGAATAGTAGCACCACC-3’ 5’-CCCGGAATTCCGATCATACACAATCATC-3’ 5’-CAAAACAAACTAGCAAAATAGGCTG-3’ 5’-TCGATAAGCTTCCATGGAATTCTGT-3’ 5’-GGGGAAGCTTCCGAATAGTAGCACCACC-3’ 5’-TTTGGATCCCGATCATACACAATCATC-3’ pEGFP-C2/nfa1 pEGFP-C2/nfa1 pEGFP-C2/nfa1UTR pEGFP-C2/nfa1UTR pEGFP-C2/Ubi/nfa1 pEGFP-C2/Ubi/nfa1 Ubi/pEGFP-C2/nfa1UTR Ubi/pEGFP-C2/nfa1UTR pEGFP-C2/nfa1 pEGFP-C2/nfa1 pEGFP-C2/nfa1UTR pEGFP-C2/nfa1UTR pEGFP-C2/Ubi/nfa1 pEGFP-C2/Ubi/nfa1 Ubi/pEGFP-C2/nfa1UTR Ubi/pEGFP-C2/nfa1UTR
Primers were used to add restriction enzyme sites to nfa1 or nfa1UTR or ubiquitin
gene. Each gene amplified with primers above was cloned into a pEGFP-C2 vector
Alternatively, the ubiquitin promoter was inserted into the site, where CMV
promoter was deleted, for the purpose of acting on the EGFP and nfa1 gene. It was
thought that ubiquitin promoter might be able to act on an nfa1 gene and express it
more efficiently than CMV promoter. The amplified ubiquitin promoter was cloned
into CMV promoter-deleted pEGFP-C2 vector using Ase I and Nhe I restriction sties
to construct an Ubi/pEGFP-C2 vector by blunt-end ligation, and then nfa1 gene
digested from pEGFP-C2/nfa1 vector containing Bsr GI and Hind III site is cloned to
an Ubi/pEGFP-C2/nfa1 vector.
An nfa1UTR gene was amplified by PCR using an nfa1UTR F2 primer containing Hind III site and an nfa1UTR R2 primer containing Bam HI site, which produced 649 bp fragment. This sequence was cloned into an Ubi/pEGFP-C2 vector using Hind III and Bam HI sites to construct an Ubi/pEGFP-C2/nfa1UTR vector. All
cloned vectors were sequenced with ABI Perkin Elmer 373A automated DNA
sequencer (Applied Biosystems, Foster city, CA).
3. Transfection and G418 selection
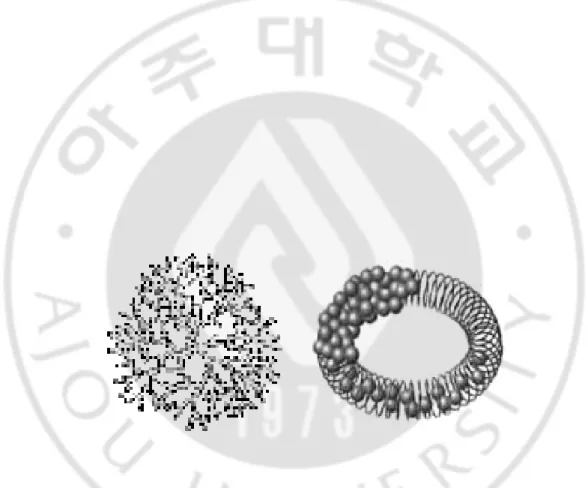
reagent (Fig. 3; Qiagen GmbH, Germany). It consists of activated-dendrimer
molecules with a defined spherical architecture.44 Branches radiate from a central
core and terminate at charged amino groups which can then interact with negatively
charged phosphate groups of nucleic acids. It assembles DNA into compact
Fig. 3. Schematic representation of an activated dendrimer (left) and model of the SuperFectTM-DNA complex (right). There is the highly branched structure in
dendrimer. SuperFectT M Reagent (black balls) interacts with DNA (black) to form a
structures that bind to the cell surface and are taken into the cell by nonspecific
endocytosis. The reagent buffers the pH of the endosome, leading to pH inhibition of
endosomal nucleases, which ensures stability of SuperFectT M-DNA complexes. Due
to highly controlled chemical synthesis the activated-dendrimer molecules in
SuperFectT M reagent (Qiagen GmbH, Germany) have a precise size and a defined
shape. This ensures consistent transfection-complex formation and reproducible
transfection results. N. gruberi (5×10⁵ trophozoites per 25 cm2-culture flask (Nunc
A/S, Roskilde, Denmark)) was cultured for 24 hr at 33 in 5 ml of 1034 modified
PYNFH medium containing 10% fetal bovine serum (FBS; Hyclone Laboratories,
Logan, UT) and antibiotics containing penicillin and streptomycin (Gibco BRL,
Gaithersburg, MD) to concentration of 10,000 unit ml-1, respectively. On the day of
transfection, a total of 5 ìg of supercoiled plasmid DNA dissolved in Tris-EDTA
(TE) buffer (pH 8.0) with PYNFH medium without serum, proteins and antibiotics
was added in 1.5 ml eppendorf tube to the final volume of 150 ìl. After SuperFectT M
reagent (30 ìl, Germany) have a precise size and a defined shape. This preincubated
at RT was added to the tube, and the mixture was incubated at room temperature for
10 min to allow the transfection-complex formation. While the complex formation
buffered saline (PBS), and resuspened in 1 ml of PYNFH complete medium. The
resuspended N. gruberi was added to reaction tube above, and immediately
transferred into a 25 cm2-culture flask (Nunc A/S, Roskilde, Denmark). N. gruberi
was incubated for 5 hr 30 min at 33 , and then 5 ml of PYNFH complete medium
was added to the flask. After N. gruberi was incubated for 24 hr at 33 , the medium
was removed, and fresh complete PYNFH medium was added. G418 (1 mg ml-1)
(Geneticin; Gibco BRL, Gaithersburg, MD) was added to N. gruberi-cultivating flask
for 48 hr after transfection.
The lethal dose of untransfected N. gruberi to G418 (Gibco BRL, Gaithersburg,
MD) was determined that it was died after 1 week. It was subcultured every week
with 80% confluence.
4. Observation of EGFP expression and measurement of transfection efficienc y in N. gruberi
The expression of EGFP in N. gruberi transfected with six vectors, respectively,
was observed under a fluorescent microscopy (model BX60; Olympus Optical Co.,
Japan) using standard FITC exitation/emission filters (488 nm/507 nm). For FACS
analysis, N. gruberi was washed twice with PBS and resuspended in 1 ml of PBS.
The EGFP was measured with a CellQuest 3.2 FACScan (Becton-Dickinson
Immunocytochemistry Systems, San Jose, CA). The N. gruberi expressing the EGFP
5. PCR of a gDNA in N. gruberi
For a gDNA preparation, trophozoites of N. gruberi were harvested and collected in
an 1.5 ml eppendorf tube. Pellets incubated with the digestion solution (125 ìl of
10% sodium dodecyl sulfate (SDS), 6.25 ìl of proteinase K (20 mg ml-1), 500 ìl of
TE buffer (pH 8.0)) for 30 min at 37 . After centrifuged at 10,000×g for 5 min at
4 , the supernatant was transferred to a 1.5 ml eppendorf tube, mixed with 630 ìl of
phenol (pH 7.4), and centrifuged 10,000×g for 10 min 4 . It was reacted with a
solution containing chloroform and isoamylalcohol (24:1) by the same methods
mentioned above. The 0.1 volume of 3 M sodium acetate (pH 7.5) and 2 volume of
absolute ethanol were added to supernatant. After centrifugation, the pellet was dried
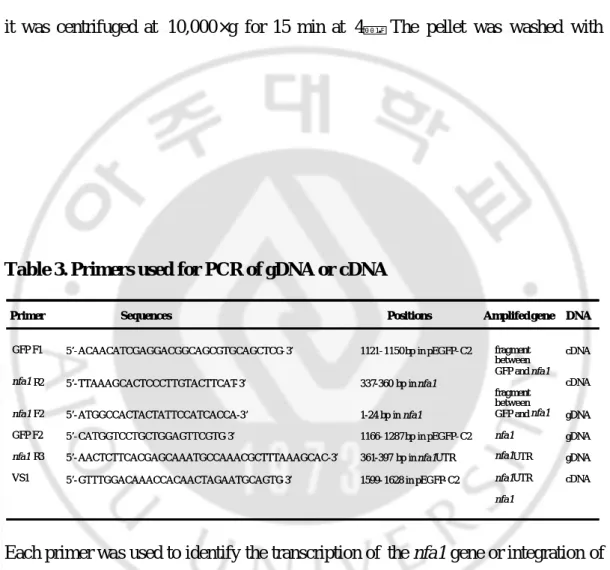
at room temperature. The primers used to identify the EGFP and nfa1 gene in
transgenic N. gruberi or the nfa1 gene in control N. gruberi were illustrated in Table
3. The program for PCR consists of 35 cycles at 94 for 1 min, 50 for 1 min, and
72 for 1 min 30 s.
6. Reverse transcription ( RT) PCR
Total RNA was prepared using an isolation kit RNAzolT M B (TEL- TEST,
Fiendswood, TX, USA) solution. Briefly presented, after 500 ìl of RNAzolT M B
chloroform was added to the mixture. It was incubated on ice for 10 min and
centrifuged at 10,000×g for 15 min at 4 . The supernatant was transferred to a new
eppendorf tube and reacted with 250 ìl of isoamylalchol. Incubated for 15 min at 4 ,
it was centrifuged at 10,000×g for 15 min at 4 . The pellet was washed with 1
Table 3. Primers used for PCR of gDNA or cDNA
Primer Sequences Positions Amplifed gene DNA
GFP F1 nfa1 R2 nfa1 F2 GFP F2 nfa1 R3 VS1 5’- ACAACATCGAGGACGGCAGCGTGCAGCTCG- 3’ 5’- TTAAAGCACTCCCTTGTACTTCAT- 3’ 5’- ATGGCCACTACTATTCCATCACCA-3’ 5’- CATGGTCCTGCTGGAGTTCGTG- 3’ 5’- AACTCTTCACGAGCAAATGCCAAACGCTTTAAAGCAC-3’ 5’- GTTTGGACAAACCACAACTAGAATGCAGTG- 3’ fragment between GFP and nfa1 fragment between GFP and nfa1 nfa1 nfa1UTR nfa1UTR nfa1 cDNA cDNA gDNA gDNA gDNA cDNA 1121- 1150 bp in pEGFP- C2 337-360 bp in nfa1 1-24 bp in nfa1 1166- 1287 bp in pEGFP- C2 361-397 bp in nfa1UTR 1599- 1628 in pEGFP- C2
Each primer was used to identify the transcription of the nfa1 gene or integration of it
ml of 70% ice-cold ethanol once and dried at room temperature. The total RNA was
suspended with 10 ìl of diethylpyrocarbonate (DEPC)-treated distilled water (DW)
and stored at -70 .
For reverse transcription, we used the Superscript First Strand Synthesis System
kit (Invitrogen, San Diego, CA) to generate cDNA with 5 ìg of total RNA from N.
gruberi. RT reaction was performed according to the manufacturer’s recommendation for first-strand synthesis using gene specific primers. PCR
fragments were amplified from cDNA using Taq polymerase (Promega, Madison,
WI). The program used consists of 35 cycles at 94 for 1 min, 50 for 1 min, and
72 for 1 min 30 s. GFP-F1 and nfa1 R2 primer were used to amplify the 717 bp
fragme nt between the GFP and nfa1 gene in pEGFP-C2/nfa1UTR vector.
7. Western blotting
Lysates of amoeba trophozoites were prepared by freezing- thawing as previously
described.45 The lysates were filtered through 0.22 µm filters (Nalgene Europe Ltd.,
Neerijse, Belgium) to obtain soluble proteins, and the protein concentration (adjusted to 10 mg ml-1) was determined by Bradford assay.46 Lysates containing 80 µg of protein were electrophoresed on a 15% SDS-polyacrylamide gel electrophoresis
with 3% bovine serum albumin (BSA) overnight and reacted with an anti-Nfa1
polyclonal antibody (1:200 dilution with 3% BSA) which was obtained from mouse
immunized with a recombinant Nfa1 protein exp ressed from the N. fowleri nfa1 gene.
The membrane was washed with PBS containing Tween 20 (PBST) three times for 5
min and reacted with secondary antibody of a goat anti- mouse IgG conjugated with
alkaline phosphatase (AP; Sigma Chemical Co., St. Louis, MO) (1:10,000 dilution
with 3% BSA), and developed with a solution with 33 µl of bromo-chloro- indolyl-phosphate (BCIP; Sigma) and 66 µl of nitro blue tetrazolium (NBT; Sigma) in 10 ml of AP buffer.
8. Indirect immunofl uorescence (IFA) test
Trophozoites were cultured on 24 well cell culture plate (Nunc A/S, Roskilde,
Denmark) overnight. After the culture medium was discarded, the trophozoites were
washed with 0.85% saline three times and were done with cold 0.85% saline at third
time. 200 µl of 10% formalin in 0.85% saline was added and the plate was incubated at room temperature for 30 min. The trophozoites was washed with 0.85% saline
three times, added 200 µl of 1% NH4OH to render them permeable, and then
incubated at room temperature for 5 min. The following washing steps were same
above. After blocking with 3% BSA in PBS, the cells were incubated with anti-Nfa1
polyclonal antibody (1:200 dilution with 3% BSA) at RT overnight. After several
AffiniPure rabbit anti- mouse IgG conjugated with rhodamine TRITC (Jackson
ImmunoResearch Laboratories Inc., West Grove, PA) (1:2,000 dilution with 3%
BSA) at room temperature for 2 hr and washed with PBST. The trophozoites were
analyzed under a fluorescent microscopy using standard FITC exitation/emission
filters (488 nm/507 nm).
9. In vitro cytotoxicity
As Chinese Hamster Ovary (CHO) cells are useful in observing in vitro
cytotoxicity of amoeba.47 CHO cells were cultured as monolayer in Earle’s minimal
essential medium (EMEM ; Gibco BRL, Gaithersburg, MD) at 37℃. The details of
this experiment using 96 well cell culture plate (Nunc A/S, Roskilde, Denmark) were
as follows: 3×10⁴ CHO cells only, 3×10⁴ CHO cells cultured with 3×10⁴ trophozoites
of N. fowleri, 3×10⁴ CHO cells cultured with 3×10⁴ trophozoites of N. gruberi, and
3×10⁴ CHO cells cultured with 3×10⁴ trophozoites of transfected N. gruberi. The
total volume per well was 200 µl with EMEM. CHO cells and trophozoites were observed using an inverted microscope at cultured intervals.
Lactate dehydrogenase (LDH) release assay was used to measure in vitro
cytotoxicity because the LDH could be released from lysed cells. For LDH assay, 50
ìl of reacted supernatant in each well was transferred on 96 well assay plate (Nunc
A/S, Roskilde, Denmark). After 50 ìl of the reconstituted assay buffer in
LDH assay was added, the plate was incubated 30 min at room temperature and then
50 ìl of stop solution was added. The reactants were read at 490 nm with ELISA
reader. The formula of in vitro cytotoxicity was as follows:
Cytotoxicity (%) =
Absorbance of control group
Absorbance of experimental group – Absorbance of control group ×100 Cytotoxicity (%) =
Absorbance of control group
Absorbance of experimental group – Absorbance of control group ×100
10. In vivo pathogenicity
1×10⁴ tropho zoites were inoculated intranasally into 7-week-old female BALB/c
mice (purchased from KIST, Daejeon, Korea) in order to induce of in vivo
pathogenicity, namely, PAME. After 0.05 mg of secobarbital as an anesthetic per
mouse body weight in grams was injected intraperitoneally, 1×10⁴ trophozoites were
inoculated into the nasal cavity of the mice with a micropipette. When infected mice
died or death was apparent, an autopsy or a biopsy was performed. In the brain,
III. RESULTS
A. Description of nfa1UTR, ubiquitin gene, and the construction of transfection vectors
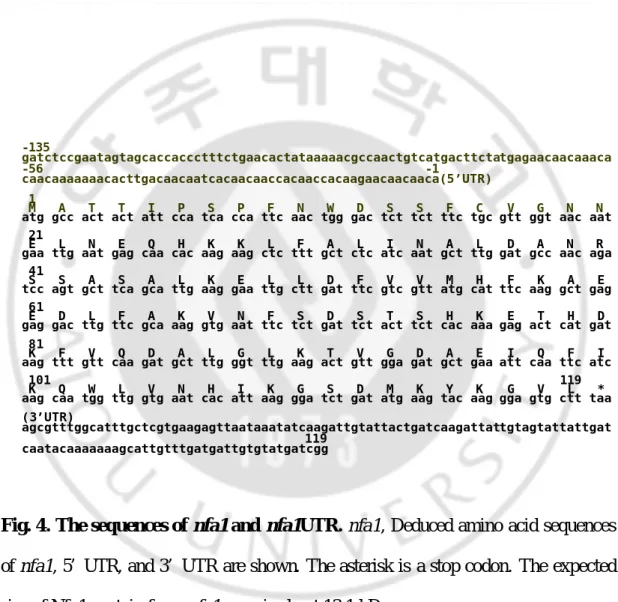
The nfa1UTR gene cloned from a gDNA of N. fowleri consists of 614 bp
containing 135 bp of 5’ untranslated regions (UTR), 360 bp of ORF of an nfa1 gene,
and 119 bp of 3’ UTR (Fig. 4) and the ubiquitin promoter from Acanthamoeba sp.
consists of 1894 bp (Fig. 5). Six vectors were constructed (Fig. 6, 7, 8) and overall
the transfection efficiency of N. gruberi using these vectors was about 20%-30%
measured at 48 hr after transfection by FACS analysis (Fig. 9). N. gruberi expressing
EGFP was increased maximum about 60% when N. gruberi transfected with
pEGFP-C2/nfa1UTR vector was selected with 1 mg ml-1 of G418 for 15 days after
transfection (data not shown). When 0.5 M beta- mercaptoethanol was added in the
transfection system, the transfection efficiency of N. gruberi was improved (data not
shown).
B. Transfection and e xpression of EGFP in N. gruberi
-135 gatctccgaatagtagcaccaccctttctgaacactataaaaacgccaactgtcatgacttctatgagaacaacaaaca -56 -1 caacaaaaaaacacttgacaacaatcacaacaaccacaaccacaagaacaacaaca(5’UTR) 1 M A T T I P S P F N W D S S F C V G N N
atg gcc act act att cca tca cca ttc aac tgg gac tct tct ttc tgc gtt ggt aac aat 21
E L N E Q H K K L F A L I N A L D A N R gaa ttg aat gag caa cac aag aag ctc ttt gct ctc atc aat gct ttg gat gcc aac aga
41
S S A S A L K E L L D F V V M H F K A E tcc agt gct tca gca ttg aag gaa ttg ctt gat ttc gtc gtt atg cat ttc aag gct gag
61
E D L F A K V N F S D S T S H K E T H D gag gac ttg ttc gca aag gtg aat ttc tct gat tct act tct cac aaa gag act cat gat
81
K F V Q D A L G L K T V G D A E I Q F I aag ttt gtt caa gat gct ttg ggt ttg aag act gtt gga gat gct gaa att caa ttc atc
101 119 K Q W L V N H I K G S D M K Y K G V L * aag caa tgg ttg gtg aat cac att aag gga tct gat atg aag tac aag gga gtg ctt taa (3’UTR)
agcgtttggcatttgctcgtgaagagttaataaatatcaagattgtattactgatcaagattattgtagtattattgat 119
caatacaaaaaaagcattgtttgatgattgtgtatgatcgg
Germany) and subsequently allowed to be assayed during the following 48 hr.
Expression of EGFP in N. gruberi transfected with six vectors was examined. No
Fig. 4. The sequences of nfa1 and nfa1UTR. nfa1, Deduced amino acid sequences
of nfa1, 5’ UTR, and 3’ UTR are shown. The asterisk is a stop codon. The expected
1 ctagcacaaactcggccacgtcgaccccgtcgggtccggacgtcgagcgaaagctgagcgagtgctcgatcggcgccaggctcaggct atagtcggcgtcggccaggagcacgacgtcgaacacctccaccttggccactgcgcgcgacgaggctcgcgtggacgacgacgacgag cgaatgggcagcgggacgtagtaggtggtcatgttggcctcgggtacgccgcgctggtgggtgatgctggcgttgaggtcgagcgggg ccgccaaggaagaattagcggccaagacacgcgtgacacggtatcgaaccgttgtgtgctcgacggccgacgatgaggaattggtaga tgaaaggcggagcgaccacttgaagctatggggcgcgatgccgaacgagcgaccgaagaagttgcctcgctccggcctccggtggaac gagatctcctgttcgatcgccgtcgcgtcggcgttggccacataggcaaaggtcgtccgagcgtcggagtctccgctggactcgttca gctgggttcgctggaagccggtcaacgatgaggccggaaccgtgatatcgcccacttggatgccttccagctcggcgcgcagtgtcag cactgcctcctcttcgctgcctgacgtcgtgtcattccctacaacacacacaaacacccaagatcagcgtgagcccacgaatcacgct gacgatgagcgaggcctaccgcgaatggtggcggtgaggttgaagctggcggcgtcggctccgaagctcgacgtcacgttgaccacct gcagccccggcagcttgatgccgggcaatggcgtcggcgacgacgacggggacggcattgaggagttgactggtccgggcgcgcagcc gctgaccgtcagcttgaagctgttgccgccgtcaaccacccatgactggttcgggttggcccggtaggccaggcctagcagcaccacc cgtgcagagcccgcgggactcgagtccacggccaggcgctcccagtgcgccgtggacccggcatcgaccacgagccaatagaggccag gcccaagcactaagtcatcggcagttgcggaggtcggcgttgccgtgaagccgacgatttctggtgtgacgtccagcgtggcgttggg cacggtggtggcgctgggtgcgcctgcgttatcggcgtagagccgcgccgaatccacgcctctgggccctgtccacaggcgcacagtc gcgatcagcccacaaaagaacgaaacgaataaagaacgaaataaaagaaagcgaagagaagccgtagggtacccgagagcggagcgta gaacccggtgatgatcacgctttcgttgacgacttggaagcgctgtgcgaggaggggccgggtgacggtggcgctggaagtccggtcg aggttgtccgccagcgggttcgcgcaaccttgcgtgaccccaaagaggtcaaagacaggaccaaaaaaataaaaaaaaacacaacagt attaggtaccctgcgcccgcgccggcggcgccgccagtcctaataacacgacggcgaccgcgaagaacggcagtgagggccagtgcat ctatgggtgccggagcaagagagcgactaacaaagaggcctcatgtttcattcccgggcgagccacacgcgatatctcgtgcgtcctt gttgattggttgaggtacaagccctaccctccgatttgcaatcactttcgggacgcgtttgggaaacatctcagaccgtcaccgaaaa gtttagggaactgcgaaaagacctgaatcgccttctcttccgctttttgccttggcgacctacaaaaaggccaccgctcgagcgcaat caaaccaccaaaccacaacaagcgctacacagcagccaacagaatt 1894
Fig. 5. Nucleotide sequences of the ubiquitin promoter in Acanthamoeba spp..
Ubiquitin promoter of 1894 bp in pGL3 vector was subcloned into an eukaryotic
pEGFP -C2 4735 b p EGFP MCS f1 ori region SV40 polyA CMV pUC ori Kanr/ Neor Ase I (8) Nco I (612) pEGFP-C2/nfa1 5337 b p EGFP nfa1 f1 ori region SV40 polyA CMV pUC ori Kanr/ Neor Ase I (8) Eco RI (1966) Hind III (1357) Nco I (612) pEGFP-C2/Ubi/nfa1 7236 b p nfa1 EGFP ubiquitin f1 ori region SV40 CMV pUC ori Kanr/ Neor Ase I (8) Hind III (3256) Sac I (1355) Eco RI (3856) pEGFP -C2 4735 b p EGFP MCS f1 ori region SV40 polyA CMV pUC ori Kanr/ Neor Ase I (8) Nco I (612) pEGFP-C2/nfa1 5337 b p EGFP nfa1 f1 ori region SV40 polyA CMV pUC ori Kanr/ Neor Ase I (8) Eco RI (1966) Hind III (1357) Nco I (612) pEGFP-C2/Ubi/nfa1 7236 b p nfa1 EGFP ubiquitin f1 ori region SV40 CMV pUC ori Kanr/ Neor Ase I (8) Hind III (3256) Sac I (1355) Eco RI (3856)
Fig. 6. Construction of eukaryotic transfection vectors. pEGFP-C2 vector was
used as a backbone for other vectors. In pEGFP-C2/nfa1 vector, an nfa1 gene was
inserted into MCS. In pEGFP-C2/Ubi/nfa1 vector, ubiquitin promoter was used
Ubi/pEGFP-C2 6 0 4 9 b p EGFP MCS f1 ori region SV40 polyA Ubiquitin pUC ori Kanr/ Neor Bsr GI (2637) S a c I(11) N c o I (1906) Ubi/pEGFP-C2/nfa1 6 6 3 4 b p nfa1 EGFP f1 ori region SV40 polyA Ubiquitin pUC ori Kanr/ Neor Bsr GI (2637) S a c I (11) X b a I ( 3 3 0 6 ) N c o I (1906) Ubi/pEGFP-C2 6 0 4 9 b p EGFP MCS f1 ori region SV40 polyA Ubiquitin pUC ori Kanr/ Neor Bsr GI (2637) S a c I(11) N c o I (1906) Ubi/pEGFP-C2 6 0 4 9 b p EGFP MCS f1 ori region SV40 polyA Ubiquitin pUC ori Kanr/ Neor Bsr GI (2637) S a c I(11) N c o I (1906) Ubi/pEGFP-C2/nfa1 6 6 3 4 b p nfa1 EGFP f1 ori region SV40 polyA Ubiquitin pUC ori Kanr/ Neor Bsr GI (2637) S a c I (11) X b a I ( 3 3 0 6 ) N c o I (1906) Ubi/pEGFP-C2/nfa1 6 6 3 4 b p nfa1 EGFP f1 ori region SV40 polyA Ubiquitin pUC ori Kanr/ Neor Bsr GI (2637) S a c I (11) X b a I ( 3 3 0 6 ) N c o I (1906)
Fig. 7. Construction of eukaryotic transfection vectors. In Ubi/pEGFP-C2 vector,
CMV promoter was replaced with ubiquitin promoter. In Ubi/pEGFP-C2/nfa1 vector,
ubiquitin promoter was replaced with CMV, and an nfa1 gene was inserted. The
pEGFP-C2/nfa1UTR 5 3 3 0 b p EGFP nfa1UTR f1 ori region SV40 polyA CMV pUC ori Kanr/ Neor Ase I ( 8 ) Eco R I (1959) B g l II (1344) Ubi/pEGFP-C2/nfa1UTR 6 6 2 6 b p EGFP nfa1UTR f1 ori region SV40 polyA Ubiquitin pUC ori Kanr/ Neor Bsr GI (2637) H i n d III (2671) B a m HI (3286) S a c I (11) N c o I (1906) pEGFP-C2/nfa1UTR 5 3 3 0 b p EGFP nfa1UTR f1 ori region SV40 polyA CMV pUC ori Kanr/ Neor Ase I ( 8 ) Eco R I (1959) B g l II (1344) Ubi/pEGFP-C2/nfa1UTR 6 6 2 6 b p EGFP nfa1UTR f1 ori region SV40 polyA Ubiquitin pUC ori Kanr/ Neor Bsr GI (2637) H i n d III (2671) B a m HI (3286) S a c I (11) N c o I (1906)
Fig. 8. Construction of eukaryotic transfection vectors. In pEGFP-C2/nfa1UTR
vector, an nfa1UTR gene containing 5’ UTR, ORF, and 3’ UTR was inserted. 5’
UTR might act as a promoter to transcript the nfa1 gene and 3’ UTR be related with
mRNA stability. In Ubi/pEGFP-C2/nfa1UTR vector, CMV promoter was replaced
Samples GFP (%)
N. gruberi cultured at 33℃ N. gruberi cultured at 27℃ N. gruberi transfected with pEGFP-C2 N. gruberi transfected with pEGFP-C2/Ubi/nfa1 N. gruberi transfected with pEGFP-C2/Ubi/nfa1 N. gruberi transfected with Ubi/pEGFP-C2/nfa1 N. gruberi transfected with pEGFP-C2/nfa1UTR N. gruberi transfected with Ubi/pEGFP-C2/nfa1UTR
1.18 0.67 22.55 22.92 22.92 23.47 14.91 18.15 Samples GFP (%) N. gruberi cultured at 33℃ N. gruberi cultured at 27℃ N. gruberi transfected with pEGFP-C2 N. gruberi transfected with pEGFP-C2/Ubi/nfa1 N. gruberi transfected with pEGFP-C2/Ubi/nfa1 N. gruberi transfected with Ubi/pEGFP-C2/nfa1 N. gruberi transfected with pEGFP-C2/nfa1UTR N. gruberi transfected with Ubi/pEGFP-C2/nfa1UTR
1.18 0.67 22.55 22.92 22.92 23.47 14.91 18.15 N. gruberi cultured at 33℃
Marker %Gated Mean All 100.00 79.84 M1 98.95 77.96 M2 1.18 240.52 N. gruberi cultured at 27℃
Marker %Gated Mean All 100.00 76.49 M1 99.33 75.16 M2 0.67 275.50
pEGFP-C2
Marker %Gated Mean All 100.00 146.77 M1 77.96 102.33 M2 22.55 301.55
pEGFP-C2/nfa1
Marker %Gated Mean All 100.00 157.24 M1 75.31 104.31 M2 24.93 317.53
pEGFP-C2/Ubi/nfa1
Marker %Gated Mean All 100.00 154.21 M1 77.64 107.07 M2 22.92 314.99
Marker %Gated Mean All 100.00 153.81 M1 76.90 104.85 M2 23.47 314.90 Ubi/pEGFP-C2/nfa1
pEGFP-C2/Ubi/nfa1 UTR
Marker %Gated Mean All 100.00 124.71 M1 85.29 93.35 M2 14.91 305.00
Ubi/pEGFP-C2/nfa1 UTR
Marker %Gated Mean All 100.00 142.30 M1 81.65 117.60 M2 18.95 250.50 N. gruberi cultured at 33℃
Marker %Gated Mean All 100.00 79.84 M1 98.95 77.96 M2 1.18 240.52 Marker %Gated Mean All 100.00 79.84 M1 98.95 77.96 M2 1.18 240.52 N. gruberi cultured at 27℃
Marker %Gated Mean All 100.00 76.49 M1 99.33 75.16 M2 0.67 275.50
pEGFP-C2
Marker %Gated Mean All 100.00 146.77 M1 77.96 102.33 M2 22.55 301.55 Marker %Gated Mean All 100.00 146.77 M1 77.96 102.33 M2 22.55 301.55
pEGFP-C2/nfa1
Marker %Gated Mean All 100.00 157.24 M1 75.31 104.31 M2 24.93 317.53 Marker %Gated Mean All 100.00 157.24 M1 75.31 104.31 M2 24.93 317.53
pEGFP-C2/Ubi/nfa1
Marker %Gated Mean All 100.00 154.21 M1 77.64 107.07 M2 22.92 314.99
Marker %Gated Mean All 100.00 153.81 M1 76.90 104.85 M2 23.47 314.90 Ubi/pEGFP-C2/nfa1
pEGFP-C2/Ubi/nfa1 UTR
Marker %Gated Mean All 100.00 124.71 M1 85.29 93.35 M2 14.91 305.00
Ubi/pEGFP-C2/nfa1 UTR
Marker %Gated Mean All 100.00 142.30 M1 81.65 117.60 M2 18.95 250.50 pEGFP-C2/Ubi/nfa1
Marker %Gated Mean All 100.00 154.21 M1 77.64 107.07 M2 22.92 314.99 Marker %Gated Mean All 100.00 154.21 M1 77.64 107.07 M2 22.92 314.99
Marker %Gated Mean All 100.00 153.81 M1 76.90 104.85 M2 23.47 314.90 Marker %Gated Mean All 100.00 153.81 M1 76.90 104.85 M2 23.47 314.90 Ubi/pEGFP-C2/nfa1
pEGFP-C2/Ubi/nfa1 UTR
Marker %Gated Mean All 100.00 124.71 M1 85.29 93.35 M2 14.91 305.00 Marker %Gated Mean All 100.00 124.71 M1 85.29 93.35 M2 14.91 305.00
Ubi/pEGFP-C2/nfa1 UTR
Marker %Gated Mean All 100.00 142.30 M1 81.65 117.60 M2 18.95 250.50 Marker %Gated Mean All 100.00 142.30 M1 81.65 117.60 M2 18.95 250.50
Fig. 9. Transfection efficiency by FACS analysis. The histograms (left) showed the
transfection efficiency measured at 48 hr after transfection with the mean value by
FACS analysis. GFP (%) represented the transfected cells expressing the GFP (right).
fluorescence was observed in trophozoites of N. gruberi used as a control group (Fig.
10). At 24 hr post transfection, GFP expression was observed in the cytoplasm of
trophozoites of N. gruberi transfected with the six different EGFP expressing vectors,
respectively but only N. gruberi transfected with pEGFP-C2/nfa1UTR vector has
been survived over 9 months since G418 antibiotics was treated 48 hr after
transfection. Nfa1 protein expressed from N. gruberi transfected with
pEGFP-C2/nfa1UTR vector could be identified using western blotting 48 hr after transfection
(Fig. 11).
C. nfa1 gene in free-living amoebae
To identify whether Naegleria spp. have the nfa1 gene, PCR was done with
gDNA using two nfa1-specific primers (nfa1 F2 and nfa1 R2). It was shown that the
nfa1 gene of 360 bp exist in nonpathogenic N. gruberi and N. lovaniensis as well as pathogenic N. fowleri (Fig. 12). However, it was previously reported that the
expression of Nfa1 protein was not detected in nonpathogenic N. gruberi by
immunoblotting.34 In addition, to investigate the transcription of nfa1 gene in
Acanthamoeba spp., RT was done using the nfa1 gene-specific primer (nfa1 R2), and then PCR was done using two nfa1-specific primers (nfa1 F2 and nfa1 R2) (Fig. 13).
Acanthamoeba sp. YM4, A. castellanii, and A. polyphaga have the cDNA of nfa1 gene.
Fig. 10. Photographs of transfected N. gruberi trophozoites. The fluorescence of
EGFP was observed 48 hr after transfection. A and A1; untransfected N. gruberi. B
and B1; pEGFP-C2-transfected N. gruberi. C and C1; pEGFP-C2/nfa1-transfected N.
gruberi. D and D1 ; pEGFP-C2/Ubi/nfa1-transfected N. gruberi. E and E1; Ubi/pEGFP-C2/nfa1-transfected N. gruberi. F and F1;
1 2 3 PM
13 kDa 1 2 3 PM
13 kDa
observed under light microscopy. Arrow heads in panel A1, B1, C1, D1, E1, and F1
indicate N. gruberi observed under fluorescent microscope. × 400.
Fig. 11. Western blotting for identifying the Nfa1 protein. Transient transfection
of N. gruberi with pEGFP-C2/nfa1UTR vector was performed. Whole cell lysates
were prepared and analyzed by western blotting. Lane 1; N. fowleri NF69. Lane 2; N.
Fig. 12. Identification of an nfa1 gene from gDNA of Naegleira spp. by PCR.
PCR was performed with nfa1-specific primers (nfa1 F2 and nfa1 R2). Lane 1; N.
gruberi cultured at 27 . Lane 2; N. gruberi cultured at 33 . Lane 3; N. gruberi transfected with pEGFP-C2/nfa1UTR vector. M; 1kb+ DNA ladder. Lane 4; N.
fowleri NF69. Lane 5; negative control (DW).
1 2 3 M 4 5
Fig. 13. Identification of cDNA of an nfa1 gene in Naegleria spp. and
Acanthamoeba spp. by RT-PCR. RT reaction was performed with the gene-specific primer (nfa1 R2) and PCR was done with the nfa1 F2 and nfa1 R2 primer. Lane 1; N.
gruberi cultured at 33 . Lane 2; A. culbertsoni. Lane 3; A. healyi. Lane 4; A. hatchetti. Lane 5; Acanthamoeba sp. YM4. Lane 6; A. castellanii. Lane 7; A. royreba. Lane 8; A. polyphaga. Lane 9; nfa1 gene of N. fowleri NF69.
360 bp
D. Integration of the pEGFP-C2/nfa1UTR vector into chromosomal DNA of N.
gruberi
After the treatment of G418, the integration of vector into chromosomal DNA was
examined. The possible integration of pEGFP-C2/nfa1UTR vector into chromosomal
DNA of N. gruberi was examined by PCR from a gDNA of transgenic N. gruberi as
illustrated in Fig. 14, Fig. 15, and Fig. 16. The DNA fragments amplified by PCR
using the vector-specific primers (GFP F1 and VS1) were shown in lane 7, 8, and 9
(Fig. 14).
The fragment of 992 bp, which contained 3’ regions of GFP, nfa1 ORF, and 3’
regions to MCS in Ubi/pEGFP-C2/nfa1 vector, was amplified in N. gruberi
transfected with Ubi/pEGFP-C2/nfa1 vector (lane 7 of Fig. 14). No fragment (lane 7
of Fig. 15) was amplified using GFP F2 primer and nfa1 R3 primer in
Ubi/pEGFP-C2/nfa1 vector compared with lane 7 of Fig. 14. The reason why it did was unclear,
but no fragment was observed although the other primers were used and the
conditions of PCR were changed.
The amplified fragment of 1102 bp (lane 8 of Fig. 14), which contained 3’
regions of GFP, nfa1UTR, and 3’ regions to MCS in pEGFP-C2/nfa1UTRvector,
was exact in size. On using other vector-specific primer (GFP-F2) and an
