Abstract. Acute myeloid leukemia (AML) is a heterogeneous group of diseases with respect to biology and clinical course. Through genome-wide scanning, we can have an improvement of the diagnosis and assay system of AML. Microarray was performed for the identification of acute myeloid leukemia prognosis. We divided patients into two groups (good prognosis group, GPG and poor prognosis group, PPG) based on differences in the individual reactions to treatment. Gene expression profiles were analyzed using microarray. Among genes up-regulated at least two-fold and down-regulated at least 0.5-fold in HL-60, we chose three up-regulated genes (PPP2CA, ME3, and CCDN2) and three down-regulated genes (GLO1, ANXA2, and BMI1) and confirmed the expression of these six genes by RT-PCR. We created a leukemia-specific subclass microarray, based on the gene expression profiles. Clinical samples from the bone marrow of four patients were hybridized on this microarray. Among the genes selected by the microarray technology, NB4, silenced TRIB3 and overexpressed XRN2 were not differentiated in spite of treatment with ATRA. This indicates that XRN2 and TRIB3 play an important role in cell differentiation. These data provided an expression profile for the diagnosis and prognosis of AML patients and identified candidate genes that might allow the prognosis of AML through the relative comparison of the expression level of genes between GPG and PPG.
Introduction
Because acute myeloid leukemia (AML) is a heterogeneous group of diseases with respect to biology and clinical course, estimations of prognosis and reactivation to existing treatment
are not straightforward. Many clinical features are associated with a poor outcome and include advanced age, high leukocyte count, extramedullary mass and a history of proceeding hematologic disorders such as myelodysplastic syndrome (1,2). Cytogenesis is recognized as an important prognostic parameter that is used to determine the response to therapy in AML. The good prognostic group of AML is associated with t(8,21) (q22;q22), t(15,17) (q22;q11-12) or inv(16) (p13;q22). Conversely, AML associated with -5, del(5q), or -7 belongs to the poor prognostic group. The remaining group, the intermediate prognostic group, includes AML associated with a normal karyotype and rare chromosome aberration (3). At present, cytogenetics is one of the important deter-minants in prognosis and choices of chemotherapy. On the other hand, a chromosome aberration is occasionally detected within 6 months of post-bone marrow transplantation, but it is often the case that no relapse occurs. However, it is known that the frequency of relapse is high if a chromosome aberration is found wihin 6 months to one year. In addition, many biological and genetic features, which include the internal tandem duplication of the FLT3 gene (4-6) and aberrant expression of drug-resistance transporter genes (7,8) and of the BCL2 family genes (9,10), are reportedly associated with outcome and are useful prognostic factors. Although many prognostic factors are now available, the accurate prediction of risk for treatment failure or relapse is still difficult. To improve risk assignment and develop new therapeutic strategies, we must learn more about the biological charac-teristics of leukemic cells. Therefore, the development of a method by which to measure an exact minimum threshold of relapse is necessary.
In a promotion of the general and integrated study reported to date, genomic technology will be a key point in developing a technique that produces large quantities of information with high speed and efficiency. Because cDNA microarrays among them are capable of profiling gene expression patterns of tens of thousands of genes in a single experiment, various types of cancers were investigated using cDNA microarrays, including breast and colon cancer (9,11-13). To improve the diagnostic and assay system of AML, we divided the study population into two groups based on the degree of differences in terms of the reactions to existing treatment; these two groups were the good prognosis group (GPG) and the poor prognosis group (PPG). NB4 with t(15,17) (q22;q11-12) is
Gene expression profile related to prognosis
of acute myeloid leukemia
MIN HA PARK1, SUN A. CHO1, KYUNG HYUN YOO1, MOON HEE YANG1, JI YOUNG AHN2, HYO SOO LEE1, KYOUNG-EUN LEE2, YEUNG-CHUL MUN2, DAE HO CHO1, CHU MYONG SEONG2,3 and JONG HOON PARK1,3
1Biological Science, Sookmyung Women's University, Chung pa dong 2 Ga 53-12, Seoul 140-742; 2Hematology-Oncology, Ewha Women's University Mock-dong Hospital, Seoul 158-710, Korea
Received July 20, 2007; Accepted August 27, 2007
_________________________________________
Correspondence to: Dr Jong Hoon Park, Biological Science, Sookmyung Women's University, Seoul 140-742, Korea
E-mail: [email protected]
one of the GPG cell lines and KG-1 with del(5q) is one of the PPG cell lines (14). HL-60 is a GPG cell line that is differentiated by all-trans-retinoic acid (ATRA) and THP-1 is a PPG cell line that shows mixed lineage leukemia (MLL) translocation (15,16) and multiple karyotypes. Gene expression profiles between the GPG cell line (NB4 and HL-60) and PPG cell line (KG-1 and THP-1) were analyzed by the use of an array consisting of 14,080 human UniGenes. Clinical bone marrow samples from four patients were also hybridized on a cDNA microarray that contained 296 genes based on the gene expression profiles of the cell line. We identified candidate gene expression profiles that might distinguish the prognosis of AML through the relative comparison of gene expression patterns between GPG and PPG.
We hybridized clinical samples on an in-house microarray that consisted of genes identified according to the cell line and the results of a previous study (17). Through a clinical hybridization, we determined that XRN2 and TRIB3 express differently according to the prognosis in AML. We expect that TRIB3 is overexpressed and XRN2 is down-regulated in NB4 differentiated by ATRA (18).
Materials and methods
Cell culture and RNA isolation. NB4 and HL-60, GPG cell lines and KG-1 and THP-1, PPG cell lines, were cultured in RPMI-1640 medium supplemented with 10% FBS and 1% penicillin-streptomycin and were maintained at 37˚C in a 5% CO2environment. Freshly isolated cells from each separate
culture were lysed in Trizol (Invitrogen Life Technologies, Canada). The RNA was extracted from the cell lysate by adding 0.2 vol of chloroform. RNA was precipitated with isopropanol in the aqueous phase and washed in 70% ethanol. The RNA pellet was dissolved in diethylene-pyrocarbonate (DEPC) treated water. The total RNA was assessed with a spectrophotometer (Nanodrop Technologies, USA) within a 260/280 nm O.D. ratio of 1.9-2.1.
cDNA microarray hybridization. Fluorescence-labeled probes for cDNA microarrays were generated using 100 μg of total RNA from each cell by oligo dT, superscript II (Invitrogen Life Technologies) and cy3-UTP or cy5-UTP (Amersham, UK). Probes were combined and hybridized in the array overnight at 56˚C in a buffer containing Poly dA, yeast tRNA and human Cot1 DNA. Slides were washed in the buffers containing 1X SSC, 0.1% SDS for 10 min and 0.1X SSC, 0.1% SDS for 10 min and 0.1X SSC for 10 min. Slides were centrifuged at 1,000 rpm for 1 min to dry.
Scanning and data analysis. The ArrayWoRx scanner, containing two lasers that excite cyanine dyes at 685 nm for cy5 and 595 nm for cy3, was used for scanning the hybridized cDNA microarrays. ImaGene 5.1 version soft-ware (Biodiscovery, USA) was used to automate the time-consuming process of measuring and visualizing the gene expression data from high-density array images. GeneSight 3.2 version software (Biodiscovery) was used for data analysis with normalization using the subtract mean and use all genes methods.
RT-PCR. A semi-quantitative analysis for the confirmation of the cDNA microarray data was performed using the RT-PCR method. Total RNA was extracted using a Trizol reagent and first-strand cDNA was synthesized using Superscript II reverse transcriptase (Invitrogen Life Technologies). cDNA obtained by this method was used as the template for the PCR amplification to generate the products corresponding to the mRNA encoding the gene product of interest. The PCR product was separated by 1% agarose gel electrophoresis. ß-actin was used as the internal control.
Analysis of clinical samples. Clinical samples were transferred to a leukemia-specific subclass cDNA microarray. The leukemia-specific subclass cDNA microarray consisted of 296 cDNA spots including 256 genes based on the gene expression profiles of the cell line, ß-actin and GAPDH. Each pair of patients of the GPG and PPG on the leukemia-specific cDNA microarray was hybridized and the sample obtained prior to chemotherapy was labeled cy3 and the sample obtained following chemotherapy (anthracycline, 12 mg/m2; cytrabine
arabinoside 100 mg/m2) was labeled cy5.
NBT assay. The presence of terminally-differentiated granulocytes in a cell population was assessed by the NBT assay. For each experiment, siRNA was synthesized for TRIB3 and transfected to NB4 cells (1x10⁶/ml) for 24 h. Then,
1 μM of ATRA was added for 24 h. XRN2 overexpression was also induced to recreate the exact conditions of NB4 cells. After that, cells were harvested by centrifugation and re-suspended in 1.0 ml Hanks' balanced salt solution (HBSS) containing 0.05% (w/w) nitro blue tetrazolium (NBT) (Sigma, St. Louis, MO, USA) and 1.0 μg of TPA (Sigma). The cell suspensions were incubated at 37˚C for 1 h in the dark and were then placed into 96-well flat-bottom microtiter plates in a 100 μl/well. A solution containing NBT was removed by centrifugation and 200 μl of 10% Triton 100 (Sigma) in 0.1 M HCl (Fluka, Buchs, Switzerland) was added into each well. Cells were then incubated at 37˚C for 30 min in the dark and the absorbance was measured at 570 nm using the Spectra Shell microplate reader.
Results
Comparison of expression profiles. A mixture of cy3-labeled NB4 cDNA and cy5-labeled KG-1 cDNA was hybridized with a cDNA microarray containing 14,080 human UniGenes. Expression levels of 234 genes increased significantly; at least two-fold, whereas the expression of 447 genes decreased at least two-fold in NB4 as compared to KG-1. To identify the different gene expression between NB4 and KG-1, we confirmed significantly up- and down-regulated genes using RT-PCR. We chose annexin A2, HSPC144, DDB1 and NACA in 234 up-regulated genes and examined the mRNA expression levels of CML66, PRDM4, DD5 and STAT1 among 447 down-regulated genes (Fig. 1). Both HL-60 and THP-1 are peripheral blood cell lines and each of the cell lines was labeled by cy3 and cy5, so the total RNA was hybridized on a 14,080 human UniGene microarray. From 837 genes, up-regulated at least two-fold and 836 genes down-regulated at least 0.5-fold in HL-60; we chose three
up-regulated genes (PPP2CA, ME3, CCDN2) and three down-regulated genes (GLO1, ANXA2, BMI1) and confirmed the expression of these six genes by RT-PCR (Fig. 2). The results indicated that NB4 and HL-60 are common to GPG cell lines and KG-1 and THP-1 are common to PPG cell lines.
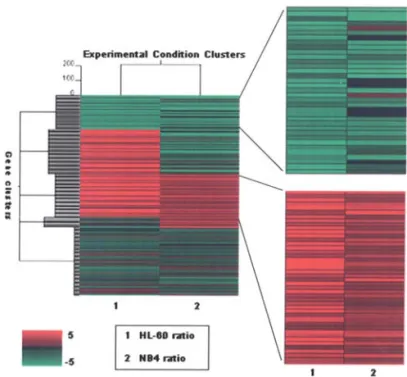
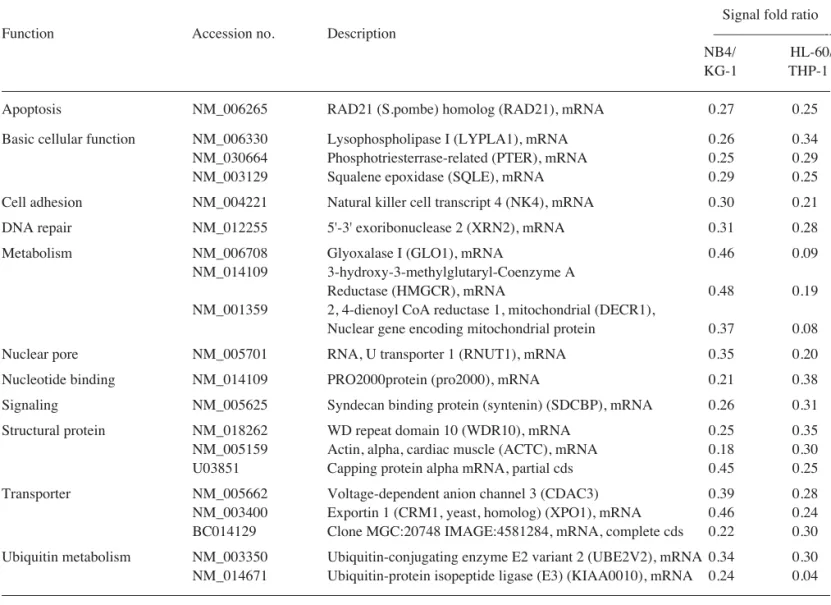
We clustered genes that were up- and down-regulated more than two-fold in the two sets of cell line hybridization with K-means (Fig. 3). We selected 234 genes that showed significant increases in expression: the expression of 447 genes was decreased significantly in NB4, the expression of 837 genes was up-regulated at least two-fold and the expression of 836 genes was down-regulated at least 0.5-fold in HL-60. We classified the selected genes into clusters by K-means clustering. We identified 44 up-regulated genes in both NB4 and HL-60 and these included two development-related genes, three cell cycle-related genes and 18 function-unknown genes. The 35 genes that are down-regulated in both GPG cell lines included three metabolism-related genes, two ubiquitin-related genes and 15 function-unknown genes. Table I lists the commonly up-regulated genes and Table II the commonly down-regulated genes.
Clinical sample hybridization. We created a cDNA microarray containing 288 genes, which were selected from the results of cell line hybridizations and previously published data (17). Using 100 ng total RNA of a clinical sample, we amplified 100 μg aRNA. We hybridized three sets of clinical samples on this microarray using the direct method and analyzed cDNA microarray data using Lowess normalization. The prognosis of clinical samples was determined in the Ewha Women's University Medical Center. We clustered genes that were up-or down-regulated in each test. In three clinical samples of hybridization experiments, the number of up-regulated genes was 74, 57 and 3 and the number of down-regulated genes was 100, 49 and 35 in each GPG. Among the genes that were differently expressed according to the prognosis in each experiment with three clinical samples, we validated the genes that were expressed similarly by using hierarchical clustering Figure 1. Validation of the microarray data in NB4 and KG-1 by RT-PCR. (A)
Up-regulated genes in NB4. (B) Down-regulated genes in NB4. The lower graphs show the correlation compared with the expression ratio of microarray data and RT-PCR. The blue bar indicates the expression ratio in microarray and the purple bar is the expression ratio in RT-PCR.
Figure 2. Validation of the microarray data in HL-60 and THP-1 by RT-PCR. (A) Up-regulated genes in HL-60. (B) Down-regulated genes in HL-60. The lower graphs show the correlation compared with the expression ratio of microarray data and RT-PCR. The blue bar indicates the expression ratio in microarray and the purple bar is the expression ratio in RT-PCR. ß-actin was used as an internal control.
Figure 3. Clustering of the significant genes by K-means clustering. Clustering gene expression levels are indicated by color, with red representing a high expression and green representing a low expression in GPG cells. The blue bar indicates commonly down-regulated genes and the gray bar indicates up-regulated genes in GPG cells.
of the clustering methods in all clinical sample experiments. DEFA5 and TRIB3 were up-regulated in GPG in all of the three sets. In contrast, XRN2 was down-regulated in GPG in all three sets (Fig. 4). These genes are thought to play an important role in the prognosis of acute myeloid leukemia.
Expression of significant genes. We hybridized clinical samples on an in-house microarray that consisted of genes identified by cell lines and previously collected data. Through clinical hybridization, we determined that XRN2 and TRIB3 are expressed differently according to the prognosis in AML. XRN2 was up-regulated in three AML patients and two AML cell lines of PPG and we predicted that this is related to cell growth by ontology. TRIB3 was up-regulated in three AML
patients and two AML cell lines of GPG and we predicted that this is related to apoptosis by ontology. After clustering of the meaningful genes (DEFA5, TRIB3, and XRN2), we investigated whether the expression levels of XRN2 and TRIB3 from the clinical samples and from the AML cell lines are identical. As expected, TRIB3 is overexpressed and XRN2 is down-regulated in NB4 and HL-60 (Fig. 5).
Comparison between before and after chemotherapy. We hybridized each pair of samples of the GPG and PPG on a leukemia-specific cDNA microarray to investigate changes of the mRNA expression following chemotherapy. In each test, samples obtained prior to chemotherapy were labeled cy3 and samples obtained following chemotherapy were labeled Table I. Up-regulated genes in the GPG cell lines.
–––––––––––––––––––––––––––––––––––––––––––––––––––––––––––––––––––––––––––––––––––––––––––––––––––––
Signal fold ratio Function Accession no Description –––––––––––––––––––––––
NB4/KG1 HL-60/THP-1
–––––––––––––––––––––––––––––––––––––––––––––––––––––––––––––––––––––––––––––––––––––––––––––––––––––
Antigen binding NM_014312 Cortical thymocyte receptor (X. laevis CTX) like (CTXL), mRNA 2.16 3.03 Apoptosis NM_021158 Protein kinase domains containing protein similar to phosphoprotein
C8FW (TRIB3), mRNA 2.46 8.21 Basic cellular function AJ245539 Partial mRNA for GalNAc-T5 (GALNT5 gene) 2.02 2.72 NM_000382 Aldehyde dehydrogenase 3 family, member A2 (ALDH3A2), mRNA 2.13 7.48
NM_002970 Spermidine 2.45 2.66
NM_005700 Dipeptidylpeptidase III (DPP3), mRNA 2.16 6.15 NM_005781 Activated p21cdc42Hskkinase (ACK1), mRNA 2.31 2.64 Proliferation NM_003739 Aldo-keto reductase family 1, member C3 (AKR1C3), mRNA 2.67 9.60 NM_005228 Epidermal growth factor receptor (RGFR), mRNA 2.73 2.64 Circulation NM_020350 ATRAP protein (ATRAP), mRNA 3.11 4.01 Cytoskeleton NM_005507 Cofilin 1 (non-muscle) (CFL1), mRNA 2.09 6.36 Development NM_002165 Inhibitor of DNA binding1, dominant negative helix-loop-helix protein 3.95 4.42 NM_012242 Dickkopf (Xenopus laevis) homolog (DKK1), mRNA 2.88 10.07 DNA repair U63139 Rad50 (Rad50) mRNA, complete cds 2.08 4.27 Basic cellular function NM_004074 Cytochrome c axidase subunit VIII (COX8), nuclear gene encoding
Mitochondrial protein, mRNA 2.06 8.72 NM_004813 Peroxidomal biogenesis factor 16 (PEX16), mRNA 2.11 7.46 Transporter activity NM_006854 KDEL (Lys-Asp-Glu-Leu) endoplasmic reticulum protein retention
Receptor 2 (KDELR2), mRNA 9.34 2.27 Regulation of cell cycle BC005848 Similar to RIKEN cDNA 2410015A15 gene, clone MGC:2769
IMAGE 2.13 1.80
NM_001760 Cyclin D3 (CCND3), mRNA 2.90 2.45
BC058896 DDX9 2.05 5.71
Transcription NM_030794 Hypothetical protein FLJ21007 (FLJ21007), mRNA 6.69 2.20 Signal transduction NM_004423 Dishevelled 3 (homologous to Drosophuladsh) (DVL3), mRNA 2.20 8.37 Structural protein NM_015920 40S ribosomal protein S27 isoform (LOC51065), mRNA 2.14 8.53 Transporter NM_030777 Solute carrier family 2 (facilitated glucose transporter), member 10
(SLC2A10), mRNA 2.28 5.53
Metastasis NM_005561 Lysosomal-associated membrane protein 1 (LAMP1), mRNA 2.33 9.53 Ubiquitin catabolism NM_004181 Ubiquitin carboxyl-terminal esterase L1 (ubiquitin
thiolesterase) (UCHL1), mRNA 2.16 2.14
cy5. Fig. 6 shows the hierarchical clustering of each prognosis group; PPG patients had a varied mRNA expression after chemotherapy compared to GPG patients because the
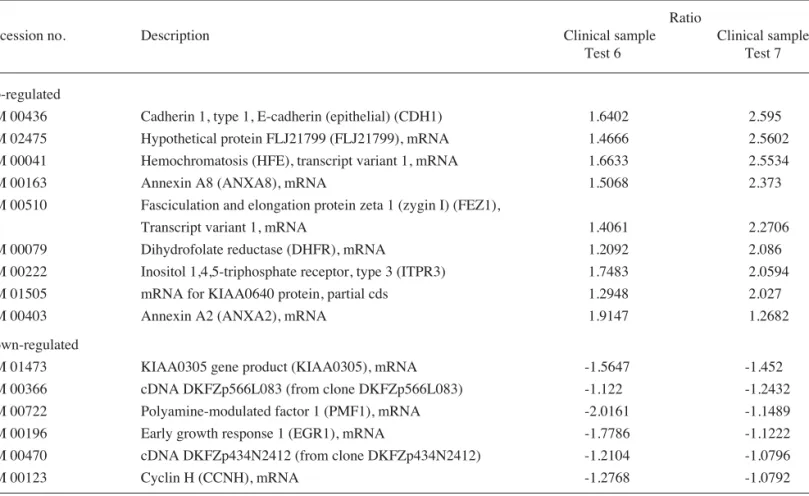
pathway was blocked at a different step after the drug treatment in each of the PPG patients, while proteins activated by the pathway after drug treatment were common in each of the GPG patients. Table III shows the commonly up- and down-regulated genes after drug treatment in GPG patients.
Blocking of cell differentiation by significant genes. NB4 cells treated with ATRA appear as a high value of positive NBT assay. However, neither siRNA of TRIB3 nor overexpressed XRN2 in NB4, known as a GPG cell line, showed a high rate of positivity on an NBT assay. In other Table II. Down-regulated genes in the GPG cell lines.
–––––––––––––––––––––––––––––––––––––––––––––––––––––––––––––––––––––––––––––––––––––––––––––––––––––
Signal fold ratio Function Accession no. Description
–––––––––––––––--NB4/ HL-60/ KG-1 THP-1
–––––––––––––––––––––––––––––––––––––––––––––––––––––––––––––––––––––––––––––––––––––––––––––––––––––
Apoptosis NM_006265 RAD21 (S.pombe) homolog (RAD21), mRNA 0.27 0.25 Basic cellular function NM_006330 Lysophospholipase I (LYPLA1), mRNA 0.26 0.34 NM_030664 Phosphotriesterrase-related (PTER), mRNA 0.25 0.29 NM_003129 Squalene epoxidase (SQLE), mRNA 0.29 0.25 Cell adhesion NM_004221 Natural killer cell transcript 4 (NK4), mRNA 0.30 0.21 DNA repair NM_012255 5'-3' exoribonuclease 2 (XRN2), mRNA 0.31 0.28 Metabolism NM_006708 Glyoxalase I (GLO1), mRNA 0.46 0.09
NM_014109 3-hydroxy-3-methylglutaryl-Coenzyme A
Reductase (HMGCR), mRNA 0.48 0.19 NM_001359 2, 4-dienoyl CoA reductase 1, mitochondrial (DECR1),
Nuclear gene encoding mitochondrial protein 0.37 0.08 Nuclear pore NM_005701 RNA, U transporter 1 (RNUT1), mRNA 0.35 0.20 Nucleotide binding NM_014109 PRO2000protein (pro2000), mRNA 0.21 0.38 Signaling NM_005625 Syndecan binding protein (syntenin) (SDCBP), mRNA 0.26 0.31 Structural protein NM_018262 WD repeat domain 10 (WDR10), mRNA 0.25 0.35 NM_005159 Actin, alpha, cardiac muscle (ACTC), mRNA 0.18 0.30 U03851 Capping protein alpha mRNA, partial cds 0.45 0.25 Transporter NM_005662 Voltage-dependent anion channel 3 (CDAC3) 0.39 0.28 NM_003400 Exportin 1 (CRM1, yeast, homolog) (XPO1), mRNA 0.46 0.24 BC014129 Clone MGC:20748 IMAGE:4581284, mRNA, complete cds 0.22 0.30 Ubiquitin metabolism NM_003350 Ubiquitin-conjugating enzyme E2 variant 2 (UBE2V2), mRNA 0.34 0.30 NM_014671 Ubiquitin-protein isopeptide ligase (E3) (KIAA0010), mRNA 0.24 0.04
–––––––––––––––––––––––––––––––––––––––––––––––––––––––––––––––––––––––––––––––––––––––––––––––––––––
Figure 4. A cluster analysis showing the relative mRNA levels of significant genes from GPG patients by hierarchical clustering. Expression levels are indicated by color, with red representing a high expression and green representing a low expression in GPG cells.
Figure 5. mRNA expression level of XRN2 and TRIB3 in AML cell lines. mRNA of NB4, KG-1, HL-60 and THP-1 used for RT-PCR analysis with a TRIB3- and XRN2-specific primer set. Internal control with ß-actin level is shown.
Table III. Up- and down-regulated genes after chemotherapy in GPG patients.
–––––––––––––––––––––––––––––––––––––––––––––––––––––––––––––––––––––––––––––––––––––––––––––––––––––
Ratio
Accession no. Description Clinical sample Clinical sample Test 6 Test 7
–––––––––––––––––––––––––––––––––––––––––––––––––––––––––––––––––––––––––––––––––––––––––––––––––––––
Up-regulated
NM 00436 Cadherin 1, type 1, E-cadherin (epithelial) (CDH1) 1.6402 2.595 NM 02475 Hypothetical protein FLJ21799 (FLJ21799), mRNA 1.4666 2.5602 NM 00041 Hemochromatosis (HFE), transcript variant 1, mRNA 1.6633 2.5534 NM 00163 Annexin A8 (ANXA8), mRNA 1.5068 2.373 NM 00510 Fasciculation and elongation protein zeta 1 (zygin I) (FEZ1),
Transcript variant 1, mRNA 1.4061 2.2706 NM 00079 Dihydrofolate reductase (DHFR), mRNA 1.2092 2.086 NM 00222 Inositol 1,4,5-triphosphate receptor, type 3 (ITPR3) 1.7483 2.0594 NM 01505 mRNA for KIAA0640 protein, partial cds 1.2948 2.027 NM 00403 Annexin A2 (ANXA2), mRNA 1.9147 1.2682 Down-regulated
NM 01473 KIAA0305 gene product (KIAA0305), mRNA -1.5647 -1.452 NM 00366 cDNA DKFZp566L083 (from clone DKFZp566L083) -1.122 -1.2432 NM 00722 Polyamine-modulated factor 1 (PMF1), mRNA -2.0161 -1.1489 NM 00196 Early growth response 1 (EGR1), mRNA -1.7786 -1.1222 NM 00470 cDNA DKFZp434N2412 (from clone DKFZp434N2412) -1.2104 -1.0796 NM 00123 Cyclin H (CCNH), mRNA -1.2768 -1.0792
–––––––––––––––––––––––––––––––––––––––––––––––––––––––––––––––––––––––––––––––––––––––––––––––––––––
Figure 6. A cluster analysis showing the relative mRNA levels from before and after chemotherapy by hierarchical clustering. Expression levels are indicated by color, with red representing a high expression and green representing a low expression after chemotherapy. (A) PPG patients. (B) GPG patients.
Figure 7. NBT positive cells (%) in ATRA-treated NB4 cells that were transfected with significant genes. (A) TRIB3 knock-down. (B) XRN2 overexpression.
words, NB4, silenced TRIB3 (Fig. 7A) and overexpressed XRN2 (Fig. 7B) were not differentiated in spite of treatment with ATRA. This indicates that XRN2 and TRIB3 play an important role in cell differentiation.
Discussion
As acute myeloid leukemia (AML) is a tumor that normally appears in children, more than 85% of cases are known to accompany specific gene variations. Many efforts were made to develop methods by which to estimate the prognosis. Although many prognostic factors such as cytogenetics (14) and gene expression (4) are now available, an accurate prediction of the risk for failure of treatment or relapse remains quite difficult. Through genome-wide scanning, the diagnostic and assay system for AML has been improved. Microarrays are capable of profiling gene expression patterns of tens of thousands of genes in a single experiment (13). Therefore, the cDNA microarray is a very useful method for screening many genes involved in the prognosis of AML. We divided our subjects into two groups based on the degree of difference in their reactions to existing treatment: the good prognosis group (GPG) and the poor prognosis group (PPG) and the prognosis of samples was determined in the Ewha Women's University Medical Center.
Cell lines, after prognosis by chemotherapy, were hybri-dized on microarrays consisting of 14,080 human UniGenes. NB4 and KG-1 are bone marrow cell lines; NB4 with t(15,18) is known as a GPG cell line that is differentiated by ATRA and KG-1 with del(5q) is a PPG cell line (14). HL-60 and THP-1 are peripheral blood cell lines; HL-60 is a GPG cell line that is differentiated by ATRA, while THP-1 is a PPG cell line that shows MLL translocation (15,16). Differently expressed genes were confirmed by RT-PCR. To confirm the results of cDNA microarray analysis, we examined the levels of specific mRNAs by RT-PCR. Among up-regulated genes in NB4 compared to those of KG-1, HSPC144-expressing CD34 hematopoietic stem cells are thought to be involved in hematopoietic development (19). DDB1 is a damage-specific DNA binding protein (20) and NACA is decreased in patients with down syndrome (21) in relation to AML (14).
In contrast, CML66, DD5 and PRDM4 mapped to tumor suppressor (22), are down-regulated in NB4 (Fig. 1). CML66 levels are correlated with the immune response, which involves the remission of chronic myeloid leukemia (CML) in a patient who receives an infusion of normal donor lymphocytes for the treatment of relapse. The CML66 antibody was also found in sera from 18-38% of patients with melanoma, lung and prostate cancer. These findings suggest that CML66 might be immunogenic in a wide variety of malignancies and might be a target for antigen-specific immunotherapy (23). Our data suggest the possibility that CML66 is involved not only in the remission of CML, but also in the prognosis of AML.
DD5 plays a role in the regulation of cell proliferation or differentiation and might function as an E3 ubiquitin-protein ligase (12,24). DD5 mRNA and its protein are frequently overexpressed in breast and ovarian cancer, while among breast cancer cell lines, the DD5 overexpression and increased gene copy number are correlated. These results demonstrate that the allelic imbalance at the DD5 locus is common in a
variety of carcinomas and that the DD5 gene is frequently overexpressed in breast and ovarian cancer, implying a potential role in cancer progression (12,24). CML66 and DD5 were excessive in PPG and are known to be overexpressed in cancer.
PPP2CA, ME3 and CCND2 are highly expressed in HL-60 compared to THP-1. PPP2CA functions in cell cycle control and growth factor signaling that p53 plays an important role in PPP2CA-directed cell cycle arrest and apoptosis (25). In neutrophils, a p38 MAPK, through a PPP2CA-mediated mechanism, regulates the JNK pathway, thereby determining the extent and nature of subsequent responses such as apoptosis (11). It was recently shown that ceramide, a potent apoptotic agent, activates a mitochondrial PPP2CA and promotes dephosphorylation of the anti-apoptotic molecule, Bcl2 (26).
On the other hand, GLO1, ANXA2 and BMI1 are down-regulated in HL-60. Previous studies reported that GLO1 is up-regulated in an apoptosis-resistant leukemia cell line and is involved in apoptosis suppression caused by drugs (27); our data are in agreement with these findings. BMI1, a gene that is up-regulated in THP-1 with an MLL-AF9 translocation, potentiates the MLL repression domain activity (28). Finally, rearrangements of the MLL gene correlate with a poor outcome (15,16).
In GPG cell lines, there is a case of remission by apoptosis. Therefore, XRN2 and TRIB3 are thought to play important roles in the treatment of AML. In our data, genes that are manifested in GPG are correlated with cell cycle arrest or apoptosis, while in PPG, tumor-related genes were over-expressed.
We found that these genes play a role in leukemogenesis and prognosis in AML. TRIB3 is included among the genes that are commonly down-regulated after drug treatment in GPG patients. As the TRIB3 gene is differently expressed in all of the different prognosis groups and after chemotherapy, this gene is thought to play an important role in the treatment of AML. The silencing of TRIB3 and the overexpression of XRN2 have a function in the blocking of cell differentiation. These findings prove that XRN2 and TRIB3 play important roles in the treatment of AML. The protein encoded by TRIB3 is a putative protein kinase that is induced by the transcription factor, NF-κB. The encoded protein is a negative regulator of NF-κB and can also sensitize cells to TNF- and TRAIL-induced apoptosis. In addition, this protein can negatively regulate the cell survival serine-threonine kinase Akt1. In contrast, XRN2 shares a similarity with the mouse Dhm1 and the yeast dhp1 gene. The yeast gene is involved in homologous recombination and RNA metabolism, including RNA synthesis and trafficking. Complementation studies show that, in mice, Dhm1 has a similar function to dhp1. The function of the human gene has yet to be determined. Transcript variants encoding different isoforms were noted for this gene; however, their full-length nature is not known. Further study is required to clarify the putative pathway where both TRIB3 and XRN2 interrupt differentiation in NB4.
Acknowledgements
This study was supported by the Korea Science and Engineering Foundation (KOSEF) through the National
Research Lab. The program was funded by the Ministry of Science and Technology (M10500000101-06J0000-10110) and the SRC/ERC program of MOST/KOSEF (Research Center for Women's Diseases).
References
1. Lowenberg B, Downing JR and Burnett A: Acute myeloid leukemia. N Engl J Med 341: 1051-1062, 1999.
2. Nguyen S, Leblanc T, Fenaux P, Witz F, Blaise D, Pigneux A, Thomas X, Rigal HF, Lioure B, Auvrignon A, Fiere D, Reiffers J, Castaigne S, Leverger G, Harousseau JL, Socie G and Dombret H: A white blood cell index as the main prognostic factor in t(8,21) acute myeloid leukemia (AML): a survey of 161 cases from the French AML Intergroup. Blood 99: 3517-3523, 2000.
3. Alon U, Barkai N, Notterman DA, Gish K, Ybarra S, Mack D and Levine AJ: Broad patterns of gene expression revealed by clustering analysis of tumor and normal colon tissues probed by oligonucleotide arrays. Proc Natl Acad Sci USA 96: 6745-6750, 1999.
4. Kiyoi H, Naoe T and Nakano Y: Prognostic implication of FLT3 and N-RAS gene mutations in acute myeloid leukemia. Blood 93: 3074-3080, 1999.
5. Kottaridis PD, Gale RE and Frew ME: The presence of an FLT3 internal tandem duplication in patients with acute myeloid leukemia (AML) adds important prognostic information to the cytogenetic risk group and response to the first cycle of chemo-therapy: analysis of 854 patients from the United Kingdom Medical Research Council AML 10 and 12 trials. Blood 98: 1752-1759, 2001.
6. Hasle H, Clemmensen IH and Mikkelsen M: Risks of leukemia and solid tumors in individuals with Down's syndrome. Lancet 355: 165-169, 2000.
7. Leith CP, Kopecky KJ and Chen IM: Frequency and clinical significance of the expression of the multidrug resistance proteins MDR1/P-glycoprotein, MRP1 and LRP in acute myeloid leukemia: a Southwest Oncology Group Study. Blood 94: 1086-1099, 1999.
8. Steinbach D, Sell W, Voigt A, Hermann J, Zintl F and Sauerbrey A: BCRP gene expression is associated with a poor response to remission induction therapy in childhood acute myeloid leukemia. Leukemia 16: 1443-1447, 2002.
9. Campos L, Rouault JP and Sabido O: High expression of bcl-2 protein in acute myeloid leukemia cells is associated with poor response to chemotherapy. Blood 81: 3091-3096, 1993. 10. Kohler T, Schill C and Deininger MW: High Bad and Bax
mRNA expression correlate with a negative outcome in acute myeloid leukemia (AML). Leukemia 16: 22-29, 2002.
11. Avdi NJ, Malcolm KC, Nick JA and Worthen GS: A role for protein phosphatase-2A in p38 mitogen-activated protein kinase-mediated regulation of the c-Jun NH(2)-terminal kinase pathway in human neutrophils. J Biol Chem 277: 40687-40696, 2002.
12. Clancy JL, Henderson MJ, Russell AJ, Anderson DW, Bova RJ, Campbell IG, Choong DY, Macdonald GA, Mann GJ, Nolan T, Brady G, Olopade OI, Woollatt E, Davies MJ, Segara D, Hacker NF, Henshall SM, Sutherland RL and Watts CK: EDD, the human orthologue of the hyperplastic discs tumor suppressor gene, is amplified and overexpressed in cancer. Oncogene 22: 5070-5081, 2003.
13. Duggan DJ, Bittner M, Chen Y, Meltzer P and Trent JM: Expression profiling using cDNA microarray. Nat Genet 21: 10-14, 1999.
14. Grimwade D, Walker H and Oliver F: The importance of diagnostic cytogenetics on outcome in AML: analysis of 1,612 patients entered into the MRC AML 10 trial: the Medical Research Council Adult and Children's Leukemia Working Parties. Blood 92: 2322-2333, 1998.
15. Steudel C, Wermke M, Schaich M, Schakel U, Illmer T, Ehninger G and Thiede C: Comparative analysis of MLL partial tandem duplication and FLT3 internal tandem duplication mutations in 956 adult patients with acute myeloid leukemia. Genes Chromosome Cancer 37: 237-251, 2003.
16. Thiede C, Steudel C and Mohr B: Analysis of FLT3-activating mutations in 979 patients with acute myelogenous leukemia: association with FAB subtypes and identification of subgroups with poor prognosis. Blood 99: 4326-4335, 2002.
17. Armstrong SA, Staunton JE, Silverman LB, Pieters R, Boer ML, Minden MD, Sallan SE, Lander ES, Golub TR and Korsmeyer SJ: MLL translocations specify a distinct gene expression profile that distinguishes a unique leukemia. Nat Genet 30: 41-47, 2002.
18. Qian XJ and Lin MF: Experimental study of the enhancement effect of aminopeptidase N inhibitor ubenimex on the differentiation induction activity of all-trans-retinoic acid in acute promyelocytic leukemia cells and its mechanism. Zhonghua Xue Ye Xue Za Zhi 7: 445-448, 2006.
19. Zhang QH, Ye M, Wu XY, Ren SX, Zhao M, Zhao CJ, Fu G, Shen Y, Fan HY, Lu G, Zhong M, Xu XR, Han ZG, Zhang JW, Tao J, Huang QH, Zhou J, Hu GX, Gu J, Chen SJ and Chen Z: Cloning and functional analysis of cDNAs with open reading frames for 300 previously undefined genes expressed in CD34+ hematopoietic stem/progenitor cells. Genome Res 10: 1546-1560, 2000.
20. Lin GY, Paterson RG, Richardson CD and Lamb RA: The V protein of the paramyxovirus SV5 interacts with damage-specific DNA binding protein. Virology 249: 189-200, 1998. 21. Kim SH, Shim KS and Lubec G: Human brain nascent
polypeptide-associated complex alpha subunit is decreased in patients with Alzheimer' s disease and Down syndrome. J Investig Med 50: 293-301, 2002.
22. Yang XH and Huang S: PFM1 (PRDM4), a new member of the PR-domain family, maps to a tumor suppressor locus on human chromosome 12q23-q24.1. Genomics 61: 319-325, 1999. 23. Yang XF, Wu CJ, McLaughlin S, Chillemi A, Wang KS,
Canning C, Alyea EP, Kantoff P, Soiffer RJ, Dranoff G and Ritz J: CML66, a broadly immunogenic tumor antigen, elicits a humoral immune response associated with remission of chronic myelogenous leukemia. Proc Natl Acad Sci USA 98: 7492-7497, 2001.
24. Henderson MJ, Russell AJ, Hird S, Munoz M, Clancy JL, Lehrbach GM, Calanni ST, Jans DA, Sutherland RL and Watts CK: EDD, the human hyperplastic discs protein, has a role in progesterone receptor coactivation and potential involvement in DNA damage response. J Biol Chem 277: 26468-26478, 2002.
25. Ofek P, Ben-Meir D, Kariv-Inbal Z, Oren M and Lavi S: Cell cycle regulation and p53 activation by protein phosphatase 2C alpha. J Biol Chem 278: 14299-14305, 2003.
26. Ruvolo PP, Clark W, Mumby M, Gao F and May WS: A functional role for the B56 alpha-subunit of protein phosphatase 2A in ceramide-mediated regulation of Bcl2 phosphorylation status and function. J Biol Chem 277: 22847-22852, 2002. 27. Sakamoto H, Mashima T, Kizaki A, Dan S, Hashimoto Y,
Naito M and Tsuruo T: Glyoxalase I is involved in resistance of human leukemia cells to antitumor agent-induced apoptosis. Blood 95: 3214-3218, 2000.
28. Xia ZB, Anderson M, Diaz MO and Zeleznik-Le NJ: MLL repression domain interacts with histone deacetylases, the polycomb group proteins HPC2 and BMI-1 and the corepressor C-terminal-binding protein. Proc Natl Acad Sci USA 100: 8342-8347, 2003.