Evaluation of Truncation Error in Minimal Cut Set-Based Fault Tree Analysis
Jong Soo Choia, Nam Zin Chob
aKorea Institute of Nuclear Safety, 19 Guseong-dong Yuseong-gu Daejeon 305-338, [email protected] bDepartment. of Nuclear and Quantum Engineering, Korea Advanced Institute of Science and Technology, 373-1
Guseong-dong, Yuseong-gu, Daejeon, 305-701, [email protected]
1. Introduction
Truncation neglecting low-probability cut sets is usually applied to determine the minimal cut sets of a manageable size in probabilistic safety assessment (PSA). The truncation error has been of great concern in PSAs because risk and important measures are only computed from an incomplete cut set equation. A truncation error evaluation method, which is based on Monte Carlo techniques and the characteristics of coherent reliability systems, is proposed in this paper. The applicability and accuracy of the proposed method are described.
2. Method and Results
This section presents the mathematical formulation of truncation errors and the proposed algorithm for quantifying truncation errors in MCS-based fault tree analyses.
2.1 Mathematical Formulation of Truncation Errors
We consider a coherent fault tree consisting of k basic events B = (b1, …, bk). The structure function φ(X) of the fault tree is a deterministic binary function of the basic event state vector X = (x1, …, xk). When the top event is occurring, φ(X) is equal to 1. We denote the probability of the top event by h(p) = E[φ(X)] where p = (p1, ..., pk) and pi = Pr{xi = 1}. Similarly, the functions with the probability of a specific basic event bi set to 0 and 1 are denoted by h(0i,p) = E[φ(0i,X)] and h(1i,p) =
E[φ(1i,X)], respectively [1,2].
In evaluating fault trees with probability-based truncation, only the MCSs with probability above pre-established cut-off value Vc are developed and the other cut sets are discarded. The developed MCSs, K1, …, Km, have probability greater than Vc. We can define a new structure function in terms of only the developed MCSs as follows: . min max ) ( i 1 j m i m x j K X ∈ ≤ ≤ ≡ φ (1)
Let us define a new binary function δ(X) associated with the truncation error as:
. ) ( ) ( ) (X φ X φm X δ ≡ − (2)
Then, the actual truncation error can be written as:
)]. ( [ ) ( ) ( ) (p h p h p Eδ X d = − m = (3)
Let us define a new value W(X) related to the occurrence probability of B1(X)={bi|xi=1} for a sample state vector X as:
. ) ( 1 ) ( 1 ∏ = ∏ ≡ = ∈ k i x i B b i i i p p W X X (4)
The binary function δ(X) has the following properties: P1: If W(X) > Vc, then δ(X) = 0.
P2: If δ(X) = 0, then δ(0i,X) = 0 for all i. P3: If δ(X) = 1 and bi ∉ B1(X), then δ(0i,X) = 1.
D A
B C
Figure 1. Relations among the binary functions: A B C D = {∪ ∪ ∪ X|φ(X)=1}, A B = {∪ X|φm(X)=1}, A C = {∪ X|φ(0i,X)=1}, A = {X|φ m(0i,X)=1}, C D = {∪ X|δ(X)=1} and C = {X|δ(0i,X)=1}.
2.2 Evaluation of Truncation Errors
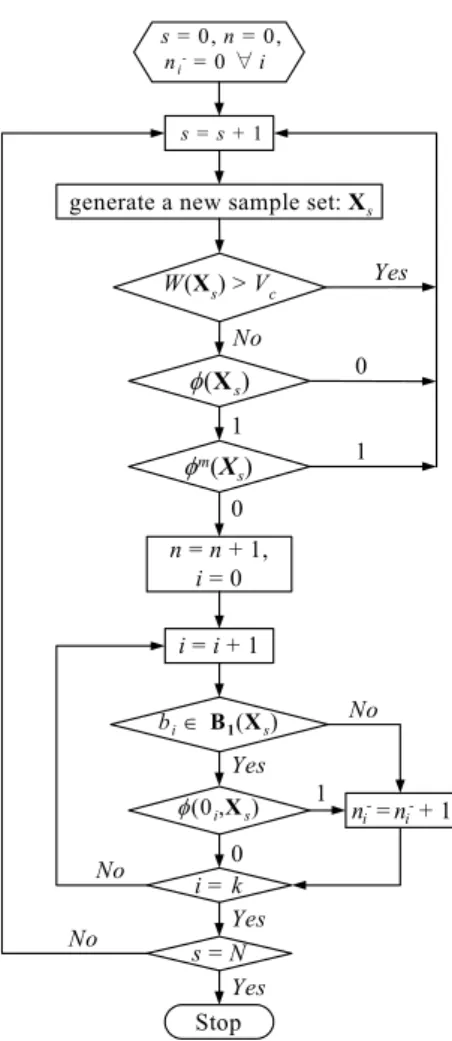
We developed a Monte Carlo algorithm to quantify the truncation errors for coherent fault trees. The proposed algorithm determines a random state vector Xs=(x1, …, xk) by the dagger sampling and its binary values δ(X) and δ(0i,X) using their properties.
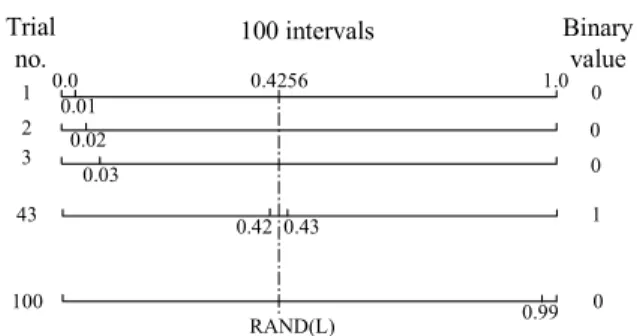
Kumamoto et al. [3] proposed the dagger sampling method, which appreciably reduces computing time to use a large number of trials for rare-event problems.
100 intervals Binary value Trial no. 1 2 3 43 100 0.0 1.0 0.01 0.02 0.03 0.99 0.42 0.43 0.4256 RAND(L) 0 0 0 1 0 Figure 2. Generation of 100 samples for event with probability 0.01 by the dagger sampling method.
Transactions of the Korean Nuclear Society Autumn Meeting Busan, Korea, October 27-28, 2005
φ(Xs)
Stop
generate a new sample set: Xs
s = s + 1 i = k ni-= ni-+ 1 Yes No 0 1 1 1 0 0 Yes Yes Yes No No No n = n + 1, i = 0 i = i + 1 s = N s = 0, n = 0, ni-= 0 ∀ i bi∈ B1(Xs) φ(0i,Xs) W(Xs) > Vc φm(X s)
Figure 3. Flow chart for the proposed algorithm.
We have
= ∑ = N s s n 1 (X ) δ and = ∑ = − N s i s i n 1 ) , (0 X δ ∀ifrom a proposed Monte Carlo simulation with sample size N. Then the truncation errors can be estimated by the unbiased binominal estimators,
N n dˆ(p)= and N n d i i − = ) , 0 (
ˆ p ∀i. The variances of dˆ p( )and dˆ(0i,p)∀i
can be estimated by the following equations: )), ( ˆ 1 ( ) ( ˆ 1 -1 )) ( ˆ ( 2 p d p d p N d S = − (5) )). , 0 ( ˆ 1 ( ) , 0 ( ˆ 1 -1 )) , 0 ( ˆ ( 2 p p p i i i N d d d S = − (6)
Inferring from the characteristics of coherent reliability systems, we get for all i
. ) , 0 ( ˆ ) , 0 ( ˆ ) ( ˆ ) , 1 ( ˆ p p p p i i i i d pd d d = − + (7) 2.3 Numerical Example
The example is a binary coherent fault tree, which contains 613 logic gates and 677 independent basic events. All runs were performed on a 2 GHz Pentium
IV using the FORTRAN program based on the proposed algorithm.
Table 1 gives simulation results of the truncation errors for 5 different cut-off value cases with a sample size N = 108. Table 2 provides an example simulation result in terms of importance measures of some basic events that are selected in the order of change ratio of RRW. This result is obtained from one simulation with
N = 108 and V
c = 10-8.
Table 1. Truncation errors (with N = 108)
Vc MCSs # of hm(p) dˆ p( ) 95% Limit of dˆ p( ) CPU time (sec.) 1E-8 1E-10 1E-12 1E-14 1E-15 230 2245 12201 51321 103170 2.4164E-4 2.4407E-4 2.4420E-4 2.4420E-4 2.4420E-4 2.01E-6 6.00E-8 2.00E-8 1.00E-8 0.0 2.24E-06 1.00E-07 4.33E-08 2.65E-08 0.0 404.03 179.72 98.92 71.95 65.97
Table 2. Importance measures considering truncation errors (with N = 108 and V
c = 10-8) i pi RRWma RRWb RAWmc RAWd 4 93 94 7 242 345 … 1.0 7.41E-3 7.41E-3 1.0 1.20E-3 3.40E-4 … 1.0878 1.0623 1.0645 1.0043 1.0087 1.0025 … 1.0943 1.0638 1.0660 1.0056 1.0097 1.0034 … 1.0000 8.8585 9.1182 1.0000 8.1892 8.4556 … 1.0000 9.0392 9.2914 1.0000 8.9875 11.0534 … aRRW m = hm(p)/hm(0i,p) bRRW = {hm(p)+dˆ p( )}/{hm(0i,p)+dˆ(0i,p)} cRAW m = hm(1i,p)/hm(p) dRAW = hm(1i,p)+dˆ(1i,p)}/{hm(p)+dˆ p( )} 3. Conclusions
This paper presents a practical tool to evaluate truncation errors in minimal cut set-based fault tree analyses. This method can be easily applied in PSAs and does not require much computation time. The method will be useful in reviewing PSA results, particularly for the regulatory purpose.
REFERENCES
[1] E. Henley, H. Kumamoto, Reliability Engineering and Risk Assessment, Prentice Hall, New Jersey, p.288, 1981.
[2] R. Barlow, F. Proschan, Statistical Theory of Reliability and Life Testing: Probability Models, Silver Spring, MD, p.6, 1981.
[3] H. Kumamoto, K. Tanaka, K. Inoue, et al., Dagger sampling Monte Carlo for system unavailability evaluation, IEEE Trans. Reliab., Vol.R-29[2], p.122, 1980.