Sparse-view computed laminography with a
spherical sinusoidal scan for nondestructive
testing
Sajid Abbas,1 Miran Park,1 Jonghwan Min,1 Ho Kyung Kim,2 and Seungryong Cho1,* 1 Department of Nuclear and Quantum Engineering, Korea Advanced Institute of Science and Technology, Daejeon,
South Korea
2 School of Mechanical Engineering, Pusan National University, Busan, South Korea *[email protected]
Abstract: X-ray computed laminography is widely used in nondestructive testing of relatively flat objects using an oblique scanning configuration for data acquisition. In this work, a new scanning scheme is proposed in conjunction with the compressive-sensing-based image reconstruction for reducing imaging radiation dose and scanning time. We performed a numerical study comparing image qualities acquired by various scanning configurations that are practically implementable: single-arc, double-arc, oblique, and spherical-sinusoidal trajectories. A compressive-sensing-inspired total-variation (TV) minimization algorithm was used to reconstruct the images from the data acquired at only 40 projection views in those trajectories. It was successfully demonstrated that the proposed scanning scheme outperforms the others in terms of image contrast and spatial resolution, although the oblique scanning scheme showed a comparable resolution property. We believe that the proposed scanning method may provide a solution to fast and low-dose nondestructive testing of radiation-sensitive and highly integrated devices such as multilayer microelectronic circuit boards.
©2014 Optical Society of America
OCIS codes: (340.7440) X-ray imaging; (110.0110) Imaging systems; (110.1758) Computational imaging; (110.6955) Tomographic imaging.
References and links
1. L. Helfen, F. Xu, H. Suhonen, L. Urbanelli, P. Cloetens, and T. Baumbach, “Nano-laminography for three-dimensional high-resolution imaging of flat specimens,” J. Instrum. 8(05), C05006 (2013).
2. D. T. C. Allcock, T. P. Harty, C. J. Ballance, B. C. Keitch, N. M. Linke, D. N. Stacey, and D. M. Lucas, “A microfabricated ion trap with integrated microwave circuitry,” Appl. Phys. Lett. 102(4), 044103 (2013). 3. L. Helfen, A. Myagotin, A. Rack, P. Pernot, P. Mikulík, M. Di Michiel, and T. Baumbach,
“Synchrotron-radiation computed laminography for high-resolution three-dimensional imaging of flat devices,” Phys. Status Solidi 204(8), 2760–2765 (2007).
4. E. Maire, T. Morgeneyer, C. Landron, J. Adrien, and L. Helfen, “Bulk evaluation of ductile damage development using high resolution tomography and laminography,” C. R. Phys. 13(3), 328–336 (2012). 5. V. Altapova, L. Helfen, A. Myagotin, D. Hänschke, J. Moosmann, J. Gunneweg, and T. Baumbach, “Phase
contrast laminography based on Talbot interferometry,” Opt. Express 20(6), 6496–6508 (2012).
6. A. Cecilia, E. Hamann, T. Koenig, F. Xu, Y. Cheng, L. Helfen, M. Ruat, M. Scheel, M. Zuber, T. Baumbach, A. Fauler, and M. Fiederle, “High resolution 3D imaging of bump-bonds by means of synchrotron radiation computed laminography,” J. Instrum. 8(12), C12029 (2013).
7. L. A. Feldkamp, L. C. Davis, and J. W. Kress, “Practical cone-beam algorithm,” J. Opt. Soc. Am. A 1(6), 612– 619 (1984).
8. D. N. Nguyen, S. M. Guertin, G. M. Swift, and A. H. Johnston, “Radiation effects on advanced flash memories,” IEEE Trans. Nucl. Sci. 46(6), 1744–1750 (1999).
9. R. H. Bossi and J. R. Kruse, “X-ray tomography inspection of printed wiring assemblies and electrical components,” Boeing Aerospace & electronics co. Seattle WA, ADA234748 (1990).
10. F. Xu, L. Helfen, T. Baumbach, and H. Suhonen, “Comparison of image quality in computed laminography and tomography,” Opt. Express 20(2), 794–806 (2012).
11. D. L. Donoho, “Compressed sensing,” IEEE Trans. Inf. Theory 52(4), 1289–1306 (2006).
12. E. Candes and M. B. Wakin, “An introduction to compressive sampling,” IEEE Signal Process. Mag. 25(2), 21– 30 (2008).
13. S. Abbas, T. Lee, S. Shin, R. Lee, and S. Cho, “Effects of sparse sampling schemes on image quality in low-dose CT,” Med. Phys. 40(11), 111915 (2013).
14. S. Abbas, J. Min, and S. Cho, “Super-sparsely view-sampled cone-beam CT by incorporating prior data,” J. XRay Sci. Technol. 21(1), 71–83 (2013).
15. J. T. Dobbins 3rd and D. J. Godfrey, “Digital x-ray tomosynthesis: current state of the art and clinical potential,” Phys. Med. Biol. 48(19), R65–R106 (2003).
16. V. Krishnaswamy, K. E. Michaelsen, B. W. Pogue, S. P. Poplack, I. Shaw, K. Defrietas, K. Brooks, and K. D. Paulsen, “A digital x-ray tomosynthesis coupled near infrared spectral tomography system for dual-modality breast imaging,” Opt. Express 20(17), 19125–19136 (2012).
17. M. K. Cho, H. Youn, S. Y. Jang, and H. K. Kim, “Cone-beam digital tomosynthesis for thin slab objects,” NDT Int. 47, 171–176 (2012).
18. E. Y. Sidky, C.-M. Kao, and X. Pan, “Accurate image reconstruction from few-views and limited-angle data in divergent-beam CT,” J. X-Ray Sci. Tech. (Paris) 14, 119–139 (2006).
19. E. Y. Sidky and X. Pan, “Image reconstruction in circular cone-beam computed tomography by constrained, total-variation minimization,” Phys. Med. Biol. 53(17), 4777–4807 (2008).
20. A. Wirgin, “The inverse crime,” http://arxiv.org/abs/math-ph/0401050 (2004).
21. Z. Wang, A. C. Bovik, H. R. Sheikh, and E. P. Simoncelli, “Image quality assessment: From error visibility to structural similarity,” IEEE Trans. Image Process. 13(4), 600–612 (2004).
22. X. Duan, L. Zhang, Y. Xing, Z. Chen, and J. Cheng, “Few-View Projection Reconstruction With an Iterative Reconstruction-Reprojection Algorithm and TV Constraint,” IEEE Trans. Nucl. Sci. 56(3), 1377–1382 (2009). 1. Introduction
X-ray computed laminography (CL), also known as oblique computed tomography (CT), is an imaging modality that is usually employed in nondestructive testing (NDT) of the laterally extended objects such as microelectronic circuit boards. Due to the limited penetration power of x-rays in conventional scanners, the object is scanned in a tilted angle to the rotation axis so that the penetration thickness of the object always stays within the possible range of x-ray penetration. Although accurate tomographic image reconstruction of the object therefore is limited, the images obtained by CL technique are often acceptable for various inspection applications. Currently, in the electronic industry for example, devices like microchips for cell phones are undergoing miniaturization and high-density packaging [1,2]. CL enables the manufacturers to visualize soldering defects and to indicate missing components in such devices [3–6]. A number of projection data, e.g., 300 views, are required for image reconstruction in conventional CL which uses an analytic algorithm like Feldkamp, Davis, and Kress (FDK) algorithm [7]. This requirement results in undesirable features of CL that include a prohibitively long scanning time and high radiation dose to the devices. It may pose an overload problem on the x-ray tube. Particularly, the radiation damage issue is critical in that it may cause gross failure of commercial devices such as dynamic random-access memory, microprocessors, flash memories, and etc [8,9]. One possible solution to overcome these issues is scanning the object for a limited range of angles, which is often referred to digital tomosynthesis (DTS) in medical imaging area. However, Xu et al. [10] confirmed that image quality of DTS is inferior to that of CL.
As an alternative, one can scan the object by taking sparse-view data during a complete rotation. In other words, one can take much less number of projections than is required conventionally. Compressive sensing (CS) theory enables us to obtain acceptable image quality from the incomplete data [11,12]. Unlike Nyquist sampling theory, CS theory exploits the sparsity of the object image function and allows image reconstruction from much less sampled data than is required by the Nyquist condition. The CS theory assumes that the objective function can be sparsely represented in some basis or in the sparsifying transformation of the objective function. In the CT applications, the magnitude of image derivative is corresponding to such a sparsifying transform. Sparsity and incoherence of data sampling have been exploited in the context of x-ray cone-beam CT [13]. Additionally, in the
CS-based image reconstruction framework, the amount of sampled data can be further reduced by use of a prior data in some NDT applications [14].
In this work, we proposed a new scanning scheme namely a spherical-sinusoidal scan for the NDT of flat objects, and performed a comparison study by simulating four scanning configurations: single-arc, double-arc, oblique, and spherical-sinusoidal. The schematic illustrations of all the scanning configurations are shown in Fig. 1. Figure 1(a) shows a single-arc configuration that is equivalent to CT with a limited angle or digital tomosynthesis [15– 17]. Figure 1(b) illustrates a arc configuration. In addition to a single-arc, the double-arc contains one more source trajectory which intersects the first one by 90 degrees. Figure 1(c) shows a conventional CL configuration i.e. an oblique CT, which is actively used in the industry for NDT of laterally extended objects. Figure 1(d) shows our proposed configuration. It is similar to the oblique CT with an addition that the source to rotation axis distance is changing in a sinusoidal fashion with respect to the source rotation angle. For all the configurations, the total number of views was fixed by a constant, e.g. 40 in this study. We implemented a total-variation minimization algorithm for image reconstruction from the data acquired by the above mentioned scanning schemes. Contrast and resolution property of the reconstructed images were analyzed both qualitatively and quantitatively particularly to the depth direction of the object.
2. Methods
In each of the four scanning schemes, for a fair comparison, we restrict the source to span on a spherical surface within 30 degrees with respect to the x-axis as shown in Fig. 1. It is also noted that detector surface always faces normal to the source position. Practically, the source and detector units are stationary while the object is moving in a way that can produce such a scanning geometry in the object-fixed coordinates. In our simulation study, the source-to-detector and source-to-object distances were fixed by 55 cm and 25 cm, respectively. The detector array size was 512 by 512 with the size of each pixel of 0.62 mm. The data for image reconstruction was collected at 40 views on regular angular intervals in each case. Compared to a single-arc scan, the double-arc scan therefore contains 20 views per each arc trajectory. In the oblique trajectory, the source is tilted to an angle 30 degrees away from the x-axis and is rotating around the x-axis. We added a rocking motion to the source in the spherical sinusoidal scan so that the source moves toward the x-axis up to the angle θ1 while rotating
around the x-axis. We used 5 degrees for θ1 in this work, and a six periods of sinusoidal
motion per rotation was implemented.
For image reconstruction, we implemented CS-inspired adaptive-steepest-descent projection-onto convex-sets (ASD-POCS) algorithm that has been proposed by Sidky et al. [18,19] which we will refer to total-variation (TV) minimization algorithm in this paper. It is to be noted that TV in this work was not implemented as an edge-preserving, denoising regularization. As has been fully discussed by Sidky et al. [18,19], TV was used to seek an exact image solution among the set of possible images which satisfy the data consistency constraint. To do so the TV minimization algorithm minimizes the l1− norm of magnitude of
image derivative and seeks the solution to the following:
argmin s.t.
TV
z=
z
M z p− <δ
(1) where zis the solution of the optimization problem constrained by data fidelity. Data fidelity term insures that the difference between calculated projection data M z and measured projection data p should be less than δ . The value of δ can be found empirically and is task-dependent. The TV minimization algorithm consists of two steps. First step is projection-onto convex-sets which respects the data fidelity and image pixel positivity condition. The
second step is adaptive-steepest-decent operation to find the minimum-TV image. The optimization algorithm that was utilized for minimizing the image TV is gradient decent method. In an attempt to move toward the minimum image TV solution, in each TV step gradient decent method calculates the new search direction or gradient vector by taking the derivative of the image TV.
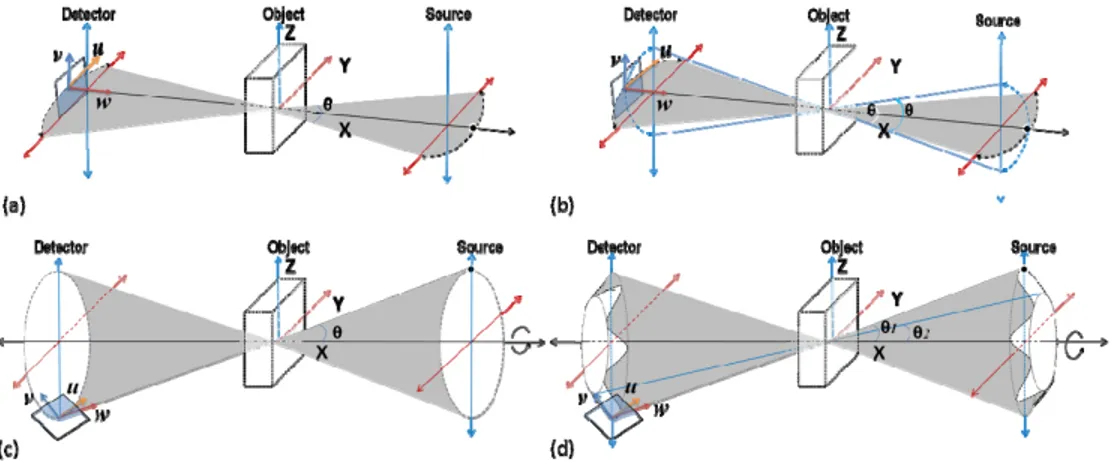
Fig. 1. Geometric illustration of CL configurations in 3D Cartesian coordinate: (a) Single-arc, (b) Double-arc, (c) Oblique, and (d) Spherical sinusoidal.
In order to compare image quality from the four scanning configurations, spatial resolution and contrast of the reconstructed images were analyzed quantitatively. We developed a resolution-test phantom which is similar to the one that has been used in Xu’s work [10]. The phantom consists of a large rectangular box in which fourteen high contrast boxes are placed along the x-axis. The dimensions of the phantom are 2.0cm x 4.0cm x 4.0 cm. The largest high contrast box in the phantom is a cube with each side of 1.56 mm. The height of rest of the boxes varied between 0.46 mm to 1.56 mm. The attenuation values of high contrast boxes and the background were set to be 3.0 cm−1 and 1.0 cm−1, respectively. In
current simulation, we discretized the reconstructed image volume in 64 pixels/cm. The detector grid size was actually selected to be finer than that of image reconstruction grid in our simulation avoiding the so-called inverse crime [20].
Fig. 2. Numerical resolution-test phantom in: (a) increasing and (b) decreasing aspect ratio. The arrow represents the x-axis directed toward the source.
In order to check the spatial resolution of the images in the depth direction, we placed the phantom in an increasing order of aspect ratio along the x-axis and also in a decreasing order as well. Trimmed cross-sectional images of the phantom are shown in Fig. 2. Another
phantom named box phantom was also developed to quantitatively analyze the depth spatial resolution by calculating the modulation transfer function (MTF). It was difficult to accurately calculate the MTF from the previously mentioned resolution-test phantom due to the limited number of pixels between the high contrast boxes. The box phantom is similar to the resolution-test phantom except that, instead of fourteen high contrast boxes, it contains only four equally spaced cubes.
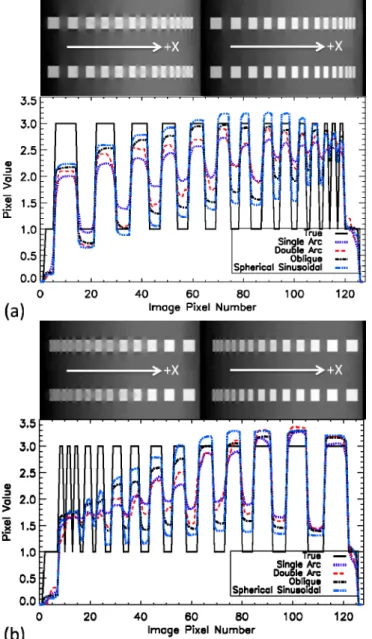
Fig. 3. Reconstructed images and midline profiles of resolution-test phantom aligned along x-axis in different orientation: i.e. (a) increasing and (b) decreasing aspect ratio. The left top corner corresponds to the single-arc and the left bottom to the double-arc scans. The right top corresponds to the oblique and the right bottom to the spherical sinusoidal scans.
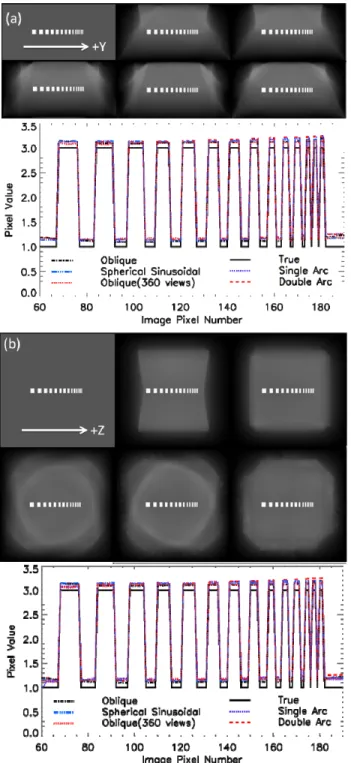
Fig. 4. Reconstructed images and midline profiles of the resolution-test phantom acquired by all the scanning schemes in different phantom orientations: i.e. aligned along (a) y-axis and (b) z-axis. In each first row, images arranged in an order starting from left to right with ground truth image, reconstructed images from 40 views in single-arc and double-arc scanning schemes. Similarly, in second row reconstructed images are arranged in an order starting from 360 view in oblique, and from 40 views in oblique and spherical sinusoidal scanning schemes.
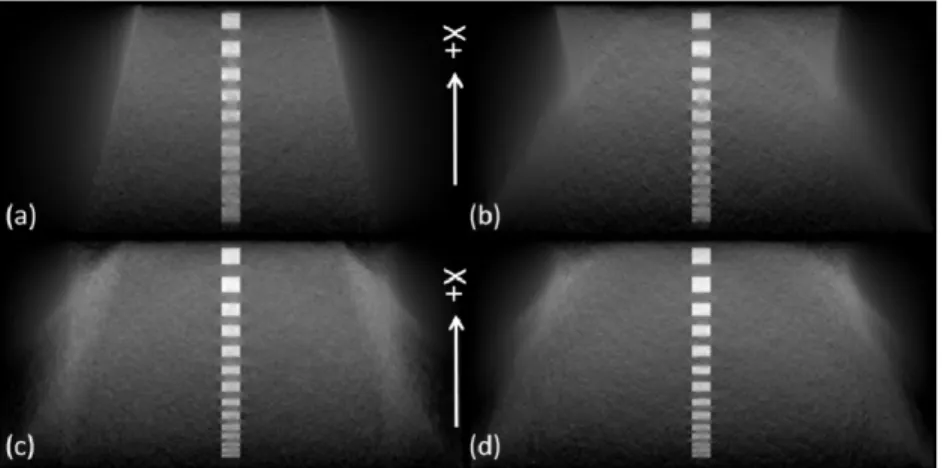
Fig. 5. Reconstructed images of the resolution-test phantom aligned along the x-axis in decreasing aspect ratio from noisy data by all the scanning schemes: (a) single-arc, (b) double-arc, (c) oblique, and (d) spherical sinusoidal scan.
3. Results
The reconstructed images of the resolution-test phantom and their midline profiles for all the four scanning geometries are shown in Fig. 3. Note that the reconstructed images are trimmed vertically for a better visualization. In Fig. 3, it can be visually noticed that the image reconstructed from the single-arc scan shows the worst resolution. Oblique and spherical sinusoidal scans appear to outperform the others in terms of image resolution. In the line profiles, one can see that none of the scanning cases produce accurate profiles compared to the ground truth. This is a natural consequence of incomplete data for image reconstruction in all the scanning configurations. One can also notice in the line profiles that boundaries of high contrast boxes in cases of oblique and spherical sinusoidal scans are sharper than those in the other scans.
However, the primary interest of NDT exists in detecting defects, which means that contrast of the image plays a key role in addition to spatial resolution. Interestingly, the spherical sinusoidal scan, or our proposed scheme, produced highest contrast of the boxes among all the scanning schemes. Higher contrast of the boxes is observed in the line-profile of spherical sinusoidal scan than in the profiles of other scans. Furthermore, the reconstructed images of the phantom with the boxes in a decreasing aspect ratio along the x-axis as shown in Fig. 3(b) reveal that the spatial resolution varies along the depth direction. The deeper to the detector direction, the worse the depth resolution becomes. This point will be quantitatively confirmed in the MTF analysis later in this section.
As we have mentioned, the depth resolution property is important in NDT of laterally extended objects. It is worth while to mention that the in-plane resolution property is usually acceptable in most scanning geometries. To validate this, we have also reconstructed the phantoms with the boxes oriented along in-plane axes and the results are shown in Fig. 4. The image resolution and contrast are visually comparable in all the in-plane images and mid-line profiles. Interestingly, it can be also noticed from the images in Fig. 4 that the images reconstructed from the data at 40 views by all the scanning schemes are in a good agreement with the images reconstructed by the oblique scanning scheme from the data at 360 views which is considered a gold standard.
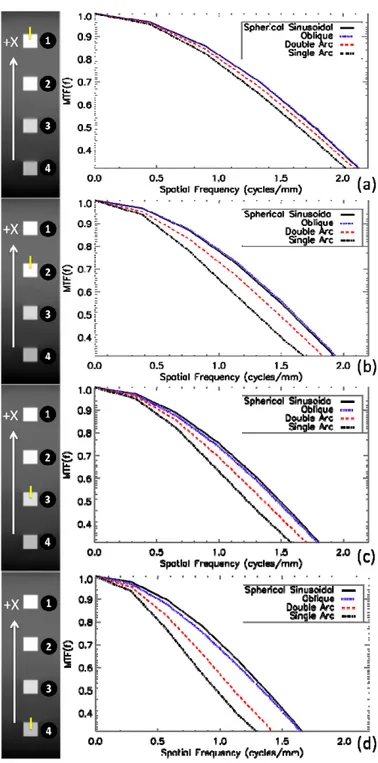
Fig. 6. Reconstructed images and MTF profiles acquired at different positions starting from surface to its depth in the box phantom by different scanning schemes. Reconstructed images are arranged in an order starting from top with (a) single-arc, (b) double-arc, (c) oblique, and (d) spherical sinusoidal.
To analyze the effect of noise in the data on the reconstructed image, we added a Gaussian noise into the projection data of the resolution-test phantom aligned along x-axis in decreasing aspect ratio. The noise level in the data was set to be 1 percent. The reconstructed
images from the noisy data in all the scanning schemes are shown in Fig. 5. It can be seen in Fig. 5(a) that the noise significantly drops the resolution and contrast. Compared to the single-arc, the image reconstructed by the double-arc shows slightly better quality as is shown in Fig. 5(b). However, they show poorer image quality than those reconstructed by the oblique and spherical sinusoidal scans as shown in Fig. 5(c) and Fig. 5(d), respectively.
The reconstructed images of the box phantom along with their MTF profiles at four selected ROIs are shown in Fig. 6. Reconstructed images of the box phantom shown on the left side of Fig. 6 are arranged in an order starting from top with single-arc, double-arc, oblique, and spherical sinusoidal. ROIs were numbered in a descending order starting from the top of the box phantom, or near from the x-ray source. It can be seen from the plots that the MTF degrades from ROI-1 to ROI-4 in each of the four scanning schemes, which confirms our finding in the previous section on depth resolution. Additionally, a comparison of the MTF plots of the same ROI in all the scanning schemes ensures that the spherical sinusoidal and oblique scans produce a comparable resolution property in the images and that these scans surpass the other two scans i.e., single- and double-arc.
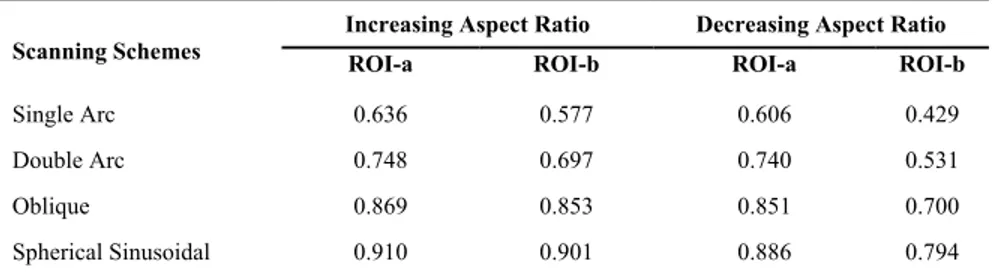
Table 1. SSIM values of the reconstructed images of a resolution-test phantom.
Scanning Schemes
Increasing Aspect Ratio Decreasing Aspect Ratio
ROI-a ROI-b ROI-a ROI-b
Single Arc 0.636 0.577 0.606 0.429
Double Arc 0.748 0.697 0.740 0.531
Oblique 0.869 0.853 0.851 0.700
Spherical Sinusoidal 0.910 0.901 0.886 0.794
Additionally, we have performed a quantitative analysis that measures similarity (SSIM) index [21]. SSIM measures the degree of similarity with respect to image contrast, luminance and structure between the reference and the target images. Its value ranges between 0 and 1. The closer to 1 the SSIM value becomes, the more similar the two images are. The original phantom images shown in Fig. 2 were used as reference for SSIM calculations. Two regions of interest (ROIs) as defined in Fig. 2 were selected from each reconstructed image in Fig. 4, and the SSIM results are summarized in Table 1.
ROI-a includes all the high contrast boxes and ROI-b restricts to include only the seven boxes of higher aspect ratio. As one can see, the highest accuracy of the image reconstruction in terms of SSIM is achieved by use of a spherical sinusoidal scan. It can be noticed from the results of ROI-a and ROI-b that the performance difference among the scanning geometries becomes larger when fine structures are under a focus. In addition, spatially varying property of the depth resolution makes a clear distinction in SSIM values of ROI-b between the two different orientations of the contrast boxes.
4. Discussion
The focus of this paper is to present a novel CL scanning scheme that can be practically implemented to improve visualization of small structures particularly along the object depth direction. Additionally, radiation dose to radio-sensitive devices can be much reduced by use of sparse scanning scheme with a CS theory-inspired image reconstruction algorithm.
In our previous work, effects of various sparse scanning schemes were investigated on image quality in a CS based image reconstruction framework [14]. It was found that uniformly sampled and highly uncorrelated data result in better image quality. Duan et al. [22] also confirmed that less correlated data result in better image quality. The reason why the proposed scanning scheme performs better than other scanning configurations is due to the least correlated data among the scanning schemes investigated. As one can see in Fig. 7, the source trajectory circumference is larger in case of the spherical sinusoidal scan compared to
the oblique scanning scheme, which implies that the gap between two neighboring source points is also larger in case of the spherical sinusoidal scheme. For better understanding and clarity, we draw only one ray from each of the two consecutive source points that pass through the image pixel marked by the black color in Fig. 7. In each case, we highlighted the pixels in gray color that were sampled by both rays. It can be visually noticed from Fig. 7 that the sampled data are more correlated in the oblique scanning scheme than in the spherical sinusoidal scheme. Therefore, the higher data incoherence can be obtained in the spherical sinusoidal than in the oblique scanning scheme. In other words, given the number of rays per pixel, the CS-based image reconstruction would perform best when the rays are least correlated.
Fig. 7. Schematic illustration of data correlation in the sampled data.
This is the first study to our knowledge that investigates sparse scanning scheme in CL using a CS based image reconstruction framework. A visual comparison between the image sets in Fig. 3 confirms that the image reconstructed from data at 40 views in the proposed scanning scheme outperforms the investigated scanning schemes. Moreover, the SSIM measurements in Table 1 quantitatively support this.
A study incorporating data noise was also performed to simulate more realistic situations. It appears that effects of noise on the image quality in single-arc and double-arc scanning schemes are more prominent than in the other scanning schemes. We conjecture that this is due to higher correlation of the data in the arc scans than that in the oblique or spherical sinusoidal scans. In an iterative image reconstruction framework, unlike analytic image reconstruction algorithms, noise in the correlated data would impair accuracy of the reconstruction. Particularly, in an under-sampled data situation, it would be more challenging for an iterative image reconstruction algorithm to meet the data-consistency when the data are contaminated by noise and are more correlated.
5. Conclusion
In summary, we proposed a new CL scanning scheme named spherical sinusoidal scan that can be practically implemented for NDT of flat objects. The proposed scanning scheme outperforms the conventional CL scanning schemes such as oblique, single-arc and double-arc in terms of image contrast and accuracy. In addition, it showed a comparable spatial resolution with that of the oblique scanning scheme. In this work, we utilized CS based TV minimization algorithm and successfully demonstrated image reconstruction from sparse projection data at only 40 views on regular interval. In conclusion, a spherical sinusoidal geometry can provide a solution for acquiring high contrast images for NDT of microelectronic devices with fast and low-dose options.
Acknowledgments
The authors are grateful to the support in part by the National Research Foundation of Korea funded by the Ministry of Science, ICT & Future Planning NRF-2013M2A2A9043476 and NRF-2011-0030450, and H.K. Kim was supported by NRF-2013M2A2A9046313.