Blood-brain barrier stabilization effects
of agmatine assessed by dynamic
contrast-enhanced MRI in a rat model
of transient cerebral ischemia
Sung Soo Ahn
Department of Medicine
Blood-brain barrier stabilization effects
of agmatine assessed by dynamic
contrast-enhanced MRI in a rat model
of transient cerebral ischemia
Directed by Professor Seung-Koo Lee
The Doctoral Dissertation
submitted to the Department of Medicine,
the Graduate School of Yonsei University
in partial fulfillment of the requirements for the degree
of Doctor of Philosophy of Medical Science
Sung Soo Ahn
This certifies that the Doctoral
Dissertation of Sung Soo Ahn is
approved.
---
Thesis Supervisor: Seung-Koo Lee
---
Thesis Committee Member#1: Se Hoon Kim
---
Thesis Committee Member#2: Jong Eun Lee
---
Thesis Committee Member#3: Kook Jin Ahn
---
Thesis Committee Member#4: Dong Joon Kim
The Graduate School
Yonsei University
ACKNOWLEDGEMENTS
I acknowledge my deep gratitude to Prof. Seung-Koo Lee,
who has been training me in neuroradiology division, for
supporting my efforts with total commitment and facilitating
every step in the process of completing my thesis. My
appreciation for his guidance and encouragement is
tremendous.
Also, I am indebted to Prof. Jong Eun Lee, for her help
providing experimental techniques as well as discussing
enthusiastically to assure the superior quality of this paper.
Special thanks to Ah-Reum Yang and Jae Young Kim, who
helped me through the experimental processes from making
the animal experimental models to obtaining pathologic
specimens.
Finally, I would like to thank Prof. Se Hoon Kim, Dong Joon
Kim, and Kook Jin Ahn for their support of me personally.
<TABLE OF CONTENTS>
ABSTRACT ··· 1
I. INTRODUCTION ··· 3
II. MATERIALS AND METHODS ··· 4
1. Animal preparation ··· 4
2. Image acquisition ··· 5
3. Image analysis ··· 7
4. Pathologic specimens ··· 10
5. Immunohistochemical analysis ··· 10
6. Statistical analysis ··· 11
III. RESULTS ··· 11
1. Image analysis ··· 11
2. Histopathologic analysis··· 16
IV. DISCUSSION ··· 18
V. CONCLUSION ··· 22
REFERENCES ··· 22
ABSTRACT(IN KOREAN) ··· 26
LIST OF FIGURES
Figure 1. Flowchart overview of the experimental protocols ·· 5
Figure 2. Middle cerebral artery infarction on conventional and
diffusion-tensor MR imaging ··· 6
Figure 3. Semiautomatic measurement of infarct volume on
diffusion-weighted imaging using thresholding method ··· 8
Figure 4. Color-coded permeability maps ··· 9
Figure 5. Infarct volumes at two different time points ··· 12
Figure 6. Permeability changes at two different time points ··· 15
Figure 7. Representative images of MRI ··· 16
Figure 8. Immunohistochemical staining with primary antibodies
against factor VIII ··· 17
Figure 9. Correlation between Ktrans and number of factor VIII
positive cells ··· 18
LIST OF TABLES
Table 1. Effects of agmatine on infarct volume and growth···· 12
Table 2. Diffusion tensor and permeability imaging parameters
measured at 4 hours after reperfusion ··· 13
Table 3. Diffusion tensor and permeability imaging parameters
1
<ABSTRACT>
Blood-brain barrier stabilization effects of agmatine assessed by dynamic
contrast-enhanced MRI in a rat model of transient cerebral ischemia
Sung Soo Ahn
Department of Medicine
The Graduate School, Yonsei University
(Directed by Professor Seung-Koo Lee)
Purpose: Blood-brain barrier (BBB) disruption after acute ischemic
stroke and subsequent permeability increase may be enhanced by
reperfusion. Agmatine has been reported to attenuate BBB disruption.
Therefore, the aim of this study was to evaluate BBB stabilization effect
of agmatine in a rat model of transient cerebral ischemia using
permeability (dynamic contrast-enhanced, DCE) MRI at early stages, and
to demonstrate the feasibility of DCE-MRI for the investigation of new
therapies
.
Materials and Methods: Thirty male Sprague-Dawley rats were subjected
to transient middle cerebral artery occlusion for 90 min. Immediately
after reperfusion, agmatine (100 mg/kg) was injected intraperitoneally in
the agmatine-treated group (n=15) and normal saline in the control group.
MRI was performed at 4 hours and 30 hours after reperfusion in 18 rats
(n=9 agmatine-treated, n=9 control) and only at 4 hours after reperfusion
in 12 rats (n=6 agmatine-treated, n=6 control) before obtaining the
specimens. Infarct volumes were calculated on diffusion-weighted
imaging. For quantitative analysis, regions of interest were defined
within the infarct area and ADC, FA, volume transfer constant (Ktrans),
2
rate transfer coefficient (Kep), and volume fraction of extravascular
extracellular
space
(Ve)
values
were
obtained
from
MRI.
Immunohistochemical staining was performed and the numbers of factor
VIII positive cells were counted. Infarct volume, infarct growth,
quantitative imaging parameters, and numbers of factor VIII positive
cells were compared between the control and the agmatine-treated
groups.
Results: Agmatine reduced infarct volume (36.1±10.8% vs. 54.2±7.1%,
P<0.001) and infarct growth (60±44.4 mm
3vs. 130±55.2 mm
3, P=0.009).
There was no significant difference in ADC and FA between the two
groups. Ktrans was significantly lower in the agmatine-treated group
compared to the control group (0.05±0.02 min
-1vs. 0.08±0.03 min
-1,
P=0.012) at 4 hour-reperfusion. Other permeability parameters were not
significantly different between the groups. The number of factor VIII
positive cells was less in the agmatine-treated group than in the control
group (3-fold vs. 4-fold compared to contralateral hemisphere, P=0.037).
Conclusion: Agmatine protects the BBB in ischemic stroke, which can be
monitored in vivo by quantification of permeability with DCE-MRI.
Therefore, DCE-MRI provides imaging biomarkers for assessing the
BBB stabilization properties of pharmacological agents to reduce the
complications associated with thrombolytic therapy in ischemic stroke.
---
Key words : blood-brain barrier, magnetic resonance imaging, agmatine,
brain ischemia, rats
3
Blood-brain barrier stabilization effects of agmatine assessed by dynamic
contrast-enhanced MRI in a rat model of transient cerebral ischemia
Sung Soo Ahn
Department of Medicine
The Graduate School, Yonsei University
(Directed by Professor Seung-Koo Lee)
I. INTRODUCTION
Blood-brain barrier (BBB) disruption occurs within 1 to 2 hours after acute
ischemic stroke by inflammatory cytokines and protease.1 Although
thrombolysis has been increasingly used for the treatment of acute ischemic stroke, reperfusion after thrombolytic therapy has been reported to enhance BBB breakdown and consequently symptomatic hemorrhagic transformation,
which is a fatal complication of ischemic stroke.2,3 Therefore, evaluation of the
therapeutic effect of a BBB blocking agent is important to improve treatment outcome in stroke patients. One can estimate permeability properties of BBB by using various techniques, which are invasive or suitable only for animal
models.4 Therefore, there have been many reports to measure BBB permeability
using MRI to evaluate the integrity of BBB and to predict hemorrhagic
transformation in acute ischemic stroke.5-7 Dynamic contrast-enhanced (DCE)
MRI using contrast agent, an emerging MRI technique based on kinetic modeling of microvascular permeability, enables quantification of BBB
breakdown.8 A recent animal study reported that increased permeability
measured by MRI correlates well with BBB disruption and hemorrhagic
transformation on histology. 9
A number of investigators have attempted to explore neuroprotective drugs in animal experimental studies to salvage the regions of ischemia and to minimize
4
reperfusion injury.10-12 Agmatine is a primary amine formed by the
decarboxylation of L-arginine and has shown to protect neurons by blocking
N-methyl-D-aspartate receptor or nitric oxide synthase.13 Since a previous animal study reported that agmatine showed protective effect in rodent models
of neurotoxic and ischemic brain injuries,14 many studies have shown beneficial
effects of agmatine and its mechanisms.15-17 Another recent study also suggested
that agmatine attenuated BBB disruption and consequently reduced brain
swelling when administered at the time of reperfusion.11
Therefore, the aim of this study was to quantitatively evaluate BBB stabilization effect of agmatine in rat models of transient cerebral ischemia using DCE-MRI at early stages, and to demonstrate the feasibility of DCE-MRI for the investigation of new therapies.
II. MATERIALS AND METHODS 1. Animal preparation
All animal procedures were performed according to a protocol approved by institutional Animal Care and Use Committee in accordance with NIH guidelines. Thirty male Sprague-Dawley rats (Orient Bio Inc.; Seongnam, Korea) weighing 250 g to 300 g were subjected to transient middle cerebral artery occlusion. Animals were anesthetized with Rumpun 10 mg/kg and Zoletil 30 mg/kg intraperitoneally. Rectal temperature was maintained at 37°C by a heating pad during the operation. Depth of anesthesia was assessed by toe pinch every 15 min. Middle cerebral artery occlusion was induced using the filament
model as previously described.18 Briefly, under an operating microscope, an
uncoated 23-mm segment of 4–0 polypropylene monofilament suture with the tip rounded by a flame was inserted into the arteriotomy and advanced into the internal carotid artery approximately 19 to 20 mm from the bifurcation to occlude the ostium of the middle cerebral artery. After 90 min, the suture was
5
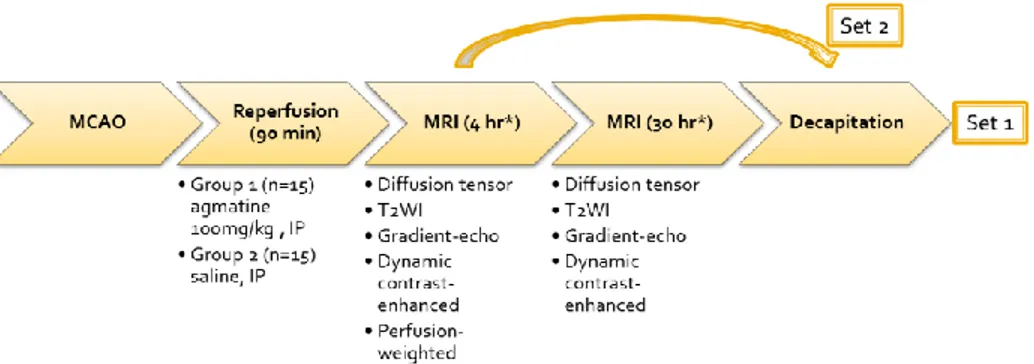
withdrawn and surgical incisions were closed. The animal was allowed to awaken and recover with free access to food and water. Agmatine (100 mg/kg, Sigma, St Louis, MO, USA) mixed in normal saline solution were injected intraperitoneally immediately after reperfusion for the agmatine-treated group (n=15). In the experimental control group, the animals received normal saline in equivalent volumes (n=15). The experimental design is shown in Fig 1. Seven rats died before obtaining pathologic specimens (2 rats in the agmatine-treated group and 5 rats in the control group).
Figure 1. Flowchart overview of the experimental protocols. Middle cerebral artery occlusion was induced using the filament model and the suture was withdrawn after 90 min. Agmatine was injected in the agmatine-treated group and normal saline in the control immediately after reperfusion. MRI was performed at 4 hours and 30 hours after reperfusion. After performing MRI, the rats were sacrificed and the brain specimens were obtained.
2. Image acquisition
After anesthesia with Rumpun 10 mg/kg and Zoletil 30 mg/kg intraperitoneally, MRI was performed using 3.0-T system (Achieva, Philips, Best, Netherlands) and 8-channel coil. Animals were prepared into two sets in order to correlate
6
MRI with histopathology at two different stages. MRI was performed at 4 hours and 30 hours after reperfusion in 18 rats (set 1; n=9 agmatine-treated, n=9 control) and only at 4 hours after reperfusion in 12 rats (set 2; n=6 agmatine-treated, n=6 control) before obtaining the specimens. All images were obtained in the coronal plane with a 60-mm field of view. Pre- and postcontrast T1-weighted (TR/TE 625/18 ms), T2-weighted (TR/TE 2006/80 ms), and T2*-weighted images (TR/TE 549/16 ms) were acquired with 2-mm slice thickness, 0.2-mm slice gap and 192 x 192 matrix. Diffusion-tensor imaging (DTI) was obtained by applying six different directions of orthogonal diffusion
gradients and b value of 600 s/mm2 and 0 s/mm2 (TR/TE 3327/52 ms; slice
thickness 2 mm; 0.2-mm slice gap; matrix 128x128). Apparent diffusion coefficient (ADC) and fractional anisotropy (FA) maps were generated from the DTI images (Fig 2).
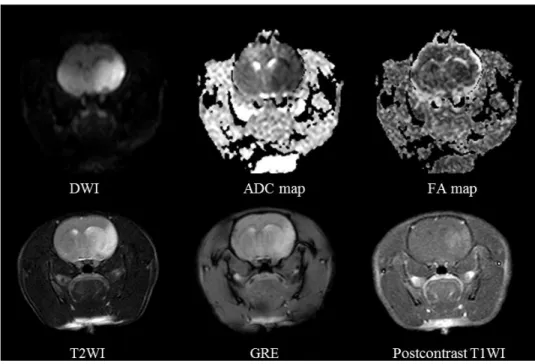
Figure 2. Middle cerebral artery infarction on conventional and diffusion-tensor MRI. DWI shows diffusion restriction with ADC decrease in the middle cerebral artery territory. No hemorrhage is noted on GRE. Postcontrast T1WI
7
demonstrates contrast leakage in the infarcted area. DWI: diffusion-weighted image, ADC: apparent diffusion coefficient, FA: fractional anisotropy, GRE: gradient-echo imaging.
To achieve quantitative hemodynamic measurements of cerebral permeability and perfusion, 2 boluses were injected via tail veins. The first bolus of contrast was administered to measure permeability and served as a preload bolus for the perfusion scans. For DCE-MRI, precontrast 3D T1-weighted images were obtained with the following parameters: TR/TE 13.2/6.5 ms; matrix 112 x112 mm; slice thickness 2 mm; 0.2-mm slice gap; and flip angle of 5°. After precontrast scan, 60-dynamic contrast enhanced T1-wighted images were obtained with the same MR parameters except for an increased flip angle of 15°. After acquisition of the fifth image volume, gadolinium-based contrast Gadovist (0.2 mmol/kg, Bayer Schering Pharma, Berlin, Germany) was injected. Total scan time for DCE-MRI was 4 minutes and 30 seconds with a temporal resolution of 4.5 seconds. Perfusion-weighted imaging (PRESTO, the rapid principles of echo shifting with a train of observations; TR/TE 26.6/38.2 msec; 64 x 64 matrix) with a total of 60 dynamic scans was obtained following injection of second bolus of Gadovist (0.2 mmol/kg) only at 4 hours after reperfusion. Perfusions maps were acquired using commercially available postprocessing software (ViewForum, Philips, Best, Netherlands) and reperfusion status was examined. All animals showed more than 90% of reperfusion.
3. Image analysis
Quantitative imaging analysis was performed by an investigator blinded to treatment.
First, all digital imaging and communication in medicine (DICOM) data of DTI were transferred to a commercial software package (Nordic ICE; Nordic
8
Imaging Lab). On diffusion-weighted images, infarct volumes were calculated using a semiautomated thresholding method to identify regions of interest with high signal intensity and expressed as a percentage of the volume of ipsilateral hemisphere (Fig 3). Then, volumes of infarct growth were calculated in set 1.
Figure 3. Semiautomatic measurement of infarct volume on diffusion-weighted imaging using thresholding method. The infarcted area with diffusion restriction is semiautomatically segmented (red) using a commercial software package.
All images were reviewed and slices with the largest infarct area, near the slices of Bregma -1.60 mm, were selected for quantitative analysis of DTI and DCE-MRI.
DICOM data of ADC, and FA maps from the selected slices were coresigtered with the aid of Image J software (NIH) to obtain their values from the same ROI. After that, we defined two ROIs: the first ROI within the core region of infarct and the second ROI within the homologous location in the contralateral hemisphere. The ADC and FA ratios were calculated by dividing mean value from the first ROI by that from the second ROI.
All image data from DCE-MRI were transferred to an independent workstation for analysis. Permeability parameters for each pixel from DCE-MRI―volume transfer constant (Ktrans), rate transfer coefficient (Kep), volume fraction of extravascular extracellular space (Ve)―were calculated and color-coded
9
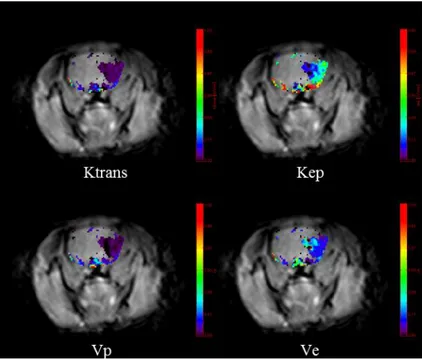
parametric maps were generated by off-line Pride tools provided by Philips Medical System (Fig 4), which is based on the pharmacokinetic
two-compartment model of Tofts.8 Post-processing was composed of motion
correction of pixels from dynamic images, T1 mapping using different flip angles (5° and 15°), registration of pixels on T1 map, arterial input function estimation, and pharmacokinetic modeling. All these process was automatically performed by Pride tools except drawing ROIs for arterial input function.
Figure 4. Color-coded permeability maps. Permeability parameters increase in the infarcted area. Ktrans: volume transfer constant, Kep: rate transfer coefficient, Vp: blood plasma volume per unit volume of tissue, Ve: volume fraction of extravascular extracellular space.
Each permeability parameter was obtained in the infarct area. Permeability maps were also used for estimating brain tissue volume with BBB disruption, which was expressed as a percentage to the ipsilateral hemisphere.
10 4. Pathologic specimens
After performing MRI, the rats were anesthetized with zoletil 150 mg/kg intravenously and perfused transcardially with 4% paraformaldehyde until the outflow fluid from the right atrium was colorless. The brain was rapidly removed and embedded in paraffin for histological processing. Coronal sections (6-μm thick) were taken at 2-mm intervals through the brain region corresponding to the MRI sections and stained with hematoxylin and eosin for histopathologic evaluation. Gross hemorrhage was defined as blood evident to the unaided eye on the hematoxylin and eosin-stained sections and confirmed by microscopy. Microscopic hemorrhage was defined as blood evident only by microscopy (x40).
5. Immunohistochemical analysis
Seven rats were used in each group for immunohistochemical analysis. Paraffin-embedded sections were rehydrated. After permeabilization with proteinase K, sections were immunostained with primary antibodies against factor VIII (Abcam, Cambridge, MA, 1:200) followed by biotinylated secondary antibodies. Sections were visualized by the horseradish peroxidase, and then reacted with diaminobenzidine (DAB; Sigma, St. Luis, USA) as a substrate.
Images were observed and captured on an Olympus AX80 microscope equipped with a DP-72 digital camera (Olympus, Japan). The stained cells were assessed in 2 consecutive coronal sections with the largest infarct areas from each rat. All of the data for immunohistochemistry were collected from 10 high-power fields (HPF, x200) within the infarct area per slide, which are 5 regions from the striatum, 3 regions from the parietal cortex, and 2 regions from the border area of infarct, showing the highest expression. Another 10 regions were selected in the corresponding regions in the contralateral hemisphere.
11
The captured images of immunohistochemistry were analyzed by an investigator blinded to treatment with the aid of Image J software. The numbers of factor VIII positive cells were counted in 10 images from infarct area and from contralateral hemisphere and expressed as ratio.
6. Statistical analysis
As infarct volume, quantitative imaging parameters, and volume with BBB disruption showed interaction with group and time, linear mixed modeling followed by Bonferroni correction was used for between-group comparisons and within-group comparisons at different time points. Otherwise, independent t tests were performed to compare infarct growth and numbers of factor VIII positive cells between the control and agmatine-treated groups based on normality testing. The relationship between the permeability parameters and numbers of factor VIII positive cells in set 1 was assessed using Spearman’s rho. All statistical analyses were performed using statistical software (SAS version 9.2m SAS Institute Inc,. Cary, Nc, USA). P values less than 0.05 were considered significant.
III. RESULTS 1. Image analysis
To investigate the effect of agmatine in ischemic damage, infarct volume was assessed on MRI and we found that agmatine significantly reduced infarct volume (Fig 5, Table 1). Infarct volumes were 36.1±10.8% in the agmatine-treated group and 54.2±7.1% in the control group at 4 hour-reperfusion (P<0.001). At 30 hour-reperfusion in set1, infarct volumes were 45.8±13% in the agmatine-treated group and 73.9±10.8% in the control group (P<0.001). In addition, infarct growth was less in the agmatine-treated
12
Figure 5. Infarct volumes at two different time points. Agmatine significantly reduced infarct volume and infarct growth at both 4 hour- and 30-hour reperfusion. Color dots are mean values, the horizontal lines above and below the dots represent 95% confidence intervals. (* P< 0.05)
Table 1. Effects of agmatine on infarct volume and growth
Control group Agmatine-treated
group P value Infarct volume at 4-h reperfusion (%) 54.2±7.1 36.1±10.8 <0.001 Infarct volume at 30-h reperfusion (%) 73.9±10.8 45.8±13 <0.001 Infarct growth (mm 3 ) 130±55.2 60±44.4 0.009
In the agmatine-treated group, ADC values were estimated to be 617±87.9 x 10⁻⁶ mm2/s and 906.5±64.5 x 10⁻⁶ mm2/s in the ipsilateral and contralateral hemispheres, respectively. In the control group, ADC values were estimated to be 627±88.3 x 10⁻⁶ mm2/s and 921.9±49.4 x 10⁻⁶ mm2/s in the ipsilateral and contralateral hemispheres, respectively. The ADC value in the ipsilateral ROI dropped to about 67% of that in the corresponding contralateral areas in the
13
agmatine-treated group, and to 69% in the control group at 4 hour-reperfusion. In the agmatine-treated group, FA values were estimated to be 0.255±0.05 and 0.359±0.04 in the ipsilateral and contralateral hemispheres, respectively. In the control group, FA values were estimated to be 0.25±0.04 and 0.339±0.06 in the ipsilateral and contralateral hemispheres, respectively. The FA value in the ipsilateral ROI dropped to about 72% of that in the corresponding contralateral areas in the agmatine-treated group, and to 75% in the control group at 4 hour-reperfusion. There was no significant difference in ADC ratio and FA ratio between the two groups (Table 2).
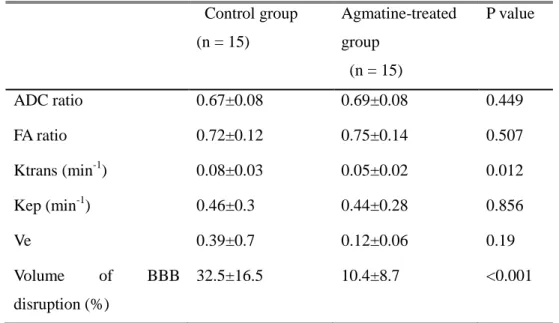
Table 2. Diffusion tensor and permeability imaging parameters measured at 4 hours after reperfusion
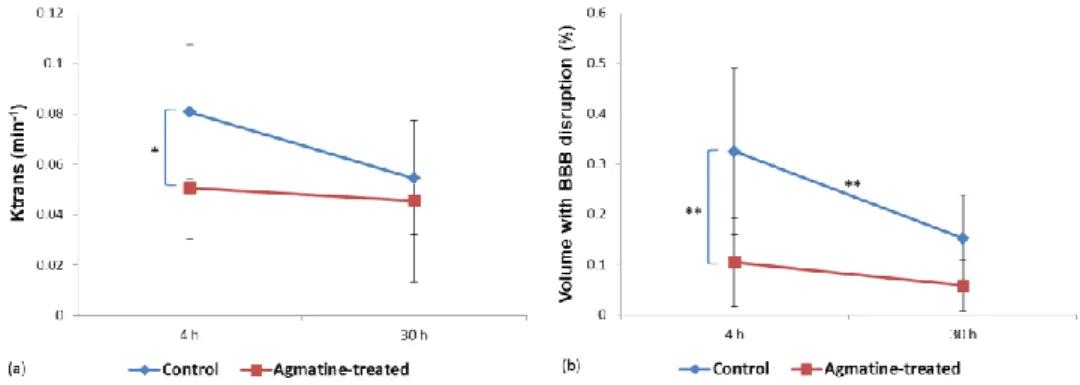
Control group (n = 15) Agmatine-treated group (n = 15) P value ADC ratio 0.67±0.08 0.69±0.08 0.449 FA ratio 0.72±0.12 0.75±0.14 0.507 Ktrans (min-1) 0.08±0.03 0.05±0.02 0.012 Kep (min-1) 0.46±0.3 0.44±0.28 0.856 Ve 0.39±0.7 0.12±0.06 0.19 Volume of BBB disruption (%) 32.5±16.5 10.4±8.7 <0.001
Data are presented as mean ± standard deviation. ADC: apparent diffusion coefficient, FA: fractional anisotropy, BBB: blood-brain barrier.
14
Table 3. Diffusion tensor and permeability imaging parameters measured at 30 hours after reperfusion
Control group (n = 9) Agmatine-treated group (n = 9) P value ADC ratio 0.75±0.08 0.76±0.11 0.726 FA ratio 0.6±0.09 0.61±0.14 0.765 Ktrans (min-1) 0.05±0.02 0.06±0.06 0.920 Kep (min-1) 0.41±0.16 0.4±0.29 0.875 Ve 0.17±0.11 0.15±0.17 0.779 Volume of BBB disruption (%) 15.2±8.6 5.8±5.1 0.367
Data are presented as mean ± standard deviation. ADC: apparent diffusion coefficient, FA: fractional anisotropy, BBB: blood-brain barrier.
DCE-MRI showed increase in permeability parameters in the ipsilateral hemisphere of middle cerebral artery occlusion. There were no cases with positive value of permeability parameters in the contralateral hemisphere on DCE-MRI. Among permeability parameters, Ktrans was significantly lower in
the agmatine-treated group compared to the control group (0.05±0.02 min-1 vs.
0.08±0.03 min-1, P=0.012) at 4 hours after reperfusion (Fig 6, 7). However,
Ktrans measured at 30 hours after reperfusion in set 1 showed no significant difference between the two groups (Table 3). Overall, there was a tendency of
Ktrans decrease over time without statistical significance (0.06±0.03 min-1 at
4-hour reperfusion vs. 0.05±0.03 min-1 at 30-hour reperfusion, P=0.06). Other
permeability parameters were not significantly different between the groups at each time point, either (Table 2, 3). The volume with BBB disruption estimated from the permeability map was significantly less in the agmatine-treated group
15
than in the control group. The volumes were 10.4±8.7% in the agmatine-treated group and 32.5±16.5% in the control group at 4 hour-reperfusion (P<0.001) (Fig 6). At 30 hour-reperfusion in set1, volume with BBB disruption was 5.8±5.1% in the agmatine-treated group and 15.2±8.6% in the control group (P=0.367). Overall, the volume with BBB disruption at 30-hour reperfusion was significantly less than that at 4-hour reperfusion (22.4±15.4% at 4-hour reperfusion vs. 10.5±8.4% at 30-hour reperfusion, P<0.001).
Figure 6. Permeability changes at two different time points. (a) Ktrans values. (b) Brain tissue volume with BBB disruption expressed as a percentage to the ipsilateral hemisphere. Color dots are mean values, the horizontal lines above and below the dots represent 95% confidence intervals. (* P< 0.05; ** P< 0.01)
16
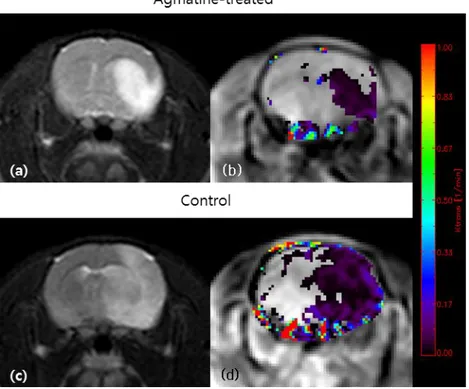
Figure 7. Representative images of MRI. Infarcted areas can be seen as hyperintensity on T2-weighted images (a, c). The color-coded permeability maps obtained at 4 hours after reperfusion demonstrate increased permeability
in the infarcted areas (b, d). The mean Ktrans values were 0.05±0.02 min-1 and
0.08±0.03 min-1 in the agmatine-treated and in the control groups, respectively
(P=0.002).
2. Histopathologic analysis
On histopathologic examination, gross hemorrhage was observed within the ischemic region in one rat of the agmatine-treated group and two rats of the control group; microscopic hemorrhage was observed in two rats of the agmatine-treated group and two rats of the control group.
The ratio of the number of factor VIII positive cells in ipsilateral to that in contralateral hemisphere was lower in the agmatine-treated group than in the
17
control group (3.1-fold vs. 4-fold, P=0.037) (Fig 8). The ratio of the number of factor VIII positive cells in ipsilateral to that in contralateral hemisphere in set 2, of which histopathology was obtained after first MRI acquisition, was lower than that in set 1 (2.8-fold vs. 3.9-fold, P=0.021).
Figure 8. Immunohistochemical staining with primary antibodies against factor VIII. The ratio of the number of factor VIII positive cells (brown) in ipsilateral to that in contralateral hemisphere was lower in the agmatine-treated group (upper row) than in the control group (lower row) (3.1-fold vs. 4-fold, P=0.037), x200.
The correlations between the permeability parameters and numbers of factor VIII positive cells were not statistically significant (Fig 9). Spearman's correlation coefficients were 0.445 for Ktrans (P=0.2), 0.596 for Kep (P=0.07), and -0.188 for Ve (P=0.6).
18
Figure 9. Correlation between Ktrans and number of factor VIII positive cells. There is no correlation between Ktrans and number of factor VIII positive cells with a correlation coefficient of 0.445 for Ktrans (P=0.2).
IV. DISCUSSION
In this study, we found that agmatine protects the BBB in ischemic stroke, and BBB stabilization effect of agmatine can be monitored in vivo by quantification of permeability with DCE-MRI. Ktrans and volume with BBB disruption of the agmatine-treated group were significantly less than those of the control group at 4-hour reperfusion. Our results support the previous study that has shown the
protective effects of agmatine on BBB using Evans blue.11 In a previous study,
decreased expression of matrix metalloproteinase by agmatine was suggested as a possible mechanism limiting BBB disruption as matrix metalloproteinase is
19
known to be associated with BBB disruption and subsequent vasogenic edema
after cerebral ischemia.19 Although the Evans blue has been widely used to
assess BBB disruption with its property of binding to serum albumin, it is only
available in animal models.20 DCE-MRI provides both permeability values and
spatial maps of the permeability changes without killing the animals, which enables us to investigate the BBB-blocking properties of pharmaceutical agents as a longitudinal study by acquiring multiple images at different time-points. In addition, MRI would be more sensitive for detecting BBB disruption with lower molecular weight of gadolinium than that of Evans blue as described in
previous experimental study (604.7 Da vs. 75.8 kDa).21 Therefore DCE-MRI
was used for monitoring time-course of focal cerebral ischemia as well as BBB stabilization effects of agmatine.
The results showed that the first significant increase of Ktrans and volume with BBB disruption at 4-hour reperfusion, which may be attributed to increased
inflammatory and oxidative stress on BBB after reperfusion.20,22 There was a
tendency of Ktrans decrease over time and the volume with BBB disruption at 30-hour reperfusion was less than that at 4-hour reperfusion. Previous experimental studies have also shown a biphasic opening of BBB after transient
ischemic injury, which has been generally accepted.20,23,24 Even though the
mechanisms of this partial recovery in BBB at 30-hour reperfusion are not well understood, the results suggested that reverse of reactive oxygen species-mediated disassembly of tight junction proteins within a period of 6 hours may contribute to decrease in extravasation of gadolinium contrast
agent.23 On the other hand, recent animal studies suggested continuous opening
of BBB.21,25 However, they also observed a nonsignificant drop in gadolinium
enhancement and Evans blue extravasation at 24-hour and 36-hour reperfusion, which was explained by microvascular plugging caused by infiltrating neutrophils, fibrin, and platelets. Therefore, longitudinal studies with a large number of subjects need to be conducted to investigate the temporal change of
20 BBB and its mechanisms.
The expression of factor VIII positive cells was less in the agmatine-treated group than in the control group. These results may be because BBB disruption of the agmatine-treated group was significantly less than that of the control group according to DCE-MRI. As the formation of new microvessels is a hallmark tissue response to ischemic injury, less expression of factor VIII positive cells in the agmatine-treated group may be attributed to the protective effect of agmatine on BBB. Overall, the expression of factor VIII positive cells was less at 4-hour reperfusion than at 30-hour reperfusion. Although expression of angiogenesis-related factors begins within 1 to 2 hours after focal ischemia, it
increases up to 14 days,1 and therefore, new vessels can be seen more at delayed
stage. There was no significant correlation between Ktrans and expression of factor VIII positive cells. These results may be attributed to the fact that increased permeability is not only because of the newly formed vessels, but also because of leakage of the existing vessels.
Increase in permeability measured on DCE-MRI may not directly reflect hemorrhagic transformation because the size of gadolinium molecule is much smaller than that of RBC. Although BBB disruption was demonstrated in all cases of transient ischemic stroke, gross hemorrhage was observed only in one rat of the agmatine-treated group and two rats of the control group. Therefore, it is difficult to say based on this study if agmatine would have a potential effect preventing gross hemorrhage, which is clinically significant.
Previous studies suggested that lower ADC values representing more severely injured tissue may be associated with BBB damage and therefore at higher risk
of hemorrhagic transformation following acute ischemic stroke.26,27 In addition
to ADC, FA may be related to the severity of the ischemic insult and can be
used as a potential marker to predict stroke outcome.28 However, the ADC and
FA ratios were not different between the two groups in our study. One explanation for these results could be that ADC and FA values can be affected
21
by multiple factors. For example, ADC may be complicated by cytotoxic edema, T2 relaxation due to vasogenic edema, and spatial heterogeneity within the stroke lesion. Obtaining average ADC and FA values for the entire ischemic lesion may be insufficient to accurately identify important variations because ADC and FA values show spatial heterogeneity among different regions in the brain. Such variations may need to be accounted for in future investigations. Therefore, it might be suggested that permeability maps from DCE-MRI would be better for assessing protective effect of novel drugs on BBB than ADC or FA maps.
Agmatine was administered immediately after reperfusion because this timing would be optimal for using such an agent with BBB blocking property in a clinical setting. In addition, previous animal experimental study reported that
agmatine showed neuroprotective effect until 4 hours after reperfusion.16
Further study is needed to investigate functional recovery and ultimate stroke outcome when agmatine is administered early, late or throughout the phase of ischemic injury as timely pharmacotherapy is important with dynamic temporal changes in BBB permeability.
If the treatment window for effective reperfusion therapy can be expanded with agmatine, considerably more stroke patients would be eligible for therapy. In this study, the results suggest the possibility that DCE-MRI provides imaging biomarkers that may be valuable for adjunctive therapy to reduce the complications associated with thrombolytic therapy in ischemic stroke.
There are several limitations in our study. First, it could not be correlated spatial maps of permeability with images of immunohistochemical stain as it is not technically possible to match regions on both MRI and histopathology. Second, the long term effects of agmatine could not be assessed because the rats were sacrified after performing MRI to obtain pathologic specimen. Further study is warranted to determine the neuroprotective effects of agmatine such as functional recovery with serial follow-up. Third, 3.0-T MR scanner, which is
22
not dedicated for animal imaging, was used in this study. However 3.0-T MR scanner is commonly used in clinical practice and the acceptable images could be obtained to evaluate permeability in rat stroke model, which may suggest the possibility of the application in human with identical methods as used in this study.
V. CONCLUSION
Agmatine protects the BBB in ischemic stroke, which can be monitored in vivo
by quantification of permeability with DCE-MRI. Therefore, DCE-MRI
provides imaging biomarkers for assessing the BBB stabilization properties of pharmacological agents including agmatine at early stages to reduce the complications associated with thrombolytic therapy in ischemic stroke.
REFERENCES
1. del Zoppo GJ, Mabuchi T. Cerebral microvessel responses to focal
ischemia. J Cereb Blood Flow Metab 2003;23:879-94.
2. Tissue plasminogen activator for acute ischemic stroke. The National
Institute of Neurological Disorders and Stroke rt-PA Stroke Study Group. N Engl J Med 1995;333:1581-7.
3. Berger C, Fiorelli M, Steiner T, Schabitz WR, Bozzao L, Bluhmki E, et
al. Hemorrhagic transformation of ischemic brain tissue: asymptomatic or symptomatic? Stroke 2001;32:1330-5.
4. Sood R, Taheri S, Estrada EY, Rosenberg GA. Quantitative evaluation
of the effect of propylene glycol on BBB permeability. J Magn Reson Imaging 2007;25:39-47.
5. Kassner A, Roberts T, Taylor K, Silver F, Mikulis D. Prediction of
23
AJNR, American journal of neuroradiology 2005;26:2213-7.
6. Bang OY, Buck BH, Saver JL, Alger JR, Yoon SR, Starkman S, et al.
Prediction of hemorrhagic transformation after recanalization therapy using T2*-permeability magnetic resonance imaging. Annals of neurology 2007;62:170-6.
7. Wu S, Thornhill RE, Chen S, Rammo W, Mikulis DJ, Kassner A.
Relative recirculation: a fast, model-free surrogate for the measurement of blood-brain barrier permeability and the prediction of hemorrhagic transformation in acute ischemic stroke. Invest Radiol 2009;44:662-8.
8. Tofts PS, Kermode AG. Measurement of the blood-brain barrier
permeability and leakage space using dynamic MR imaging. 1.
Fundamental concepts. Magnetic resonance in medicine
1991;17:357-67.
9. Hoffmann A, Bredno J, Wendland MF, Derugin N, Hom J, Schuster T,
et al. Validation of in vivo magnetic resonance imaging blood-brain barrier permeability measurements by comparison with gold standard histology. Stroke 2011;42:2054-60.
10. Nonaka Y, Tsuruma K, Shimazawa M, Yoshimura S, Iwama T, Hara H.
Cilostazol protects against hemorrhagic transformation in mice transient focal cerebral ischemia-induced brain damage. Neuroscience Letters 2009;452:156-61.
11. Kim JH, Lee YW, Park KA, Lee WT, Lee JE. Agmatine attenuates brain
edema through reducing the expression of aquaporin-1 after cerebral ischemia. Journal of cerebral blood flow and metabolism 2010;30:943-9.
12. Wang CC, Chio CC, Chang CH, Kuo JR, Chang CP. Beneficial effect of
agmatine on brain apoptosis, astrogliosis, and edema after rat transient cerebral ischemia. BMC Pharmacol 2010;10:11.
24
neuroprotection by agmatine after spinal cord ischemia in rats. Neuroscience Letters 2000;296:97-100.
14. Gilad GM, Salame K, Rabey JM, Gilad VH. Agmatine treatment is
neuroprotective in rodent brain injury models. Life sciences 1996;58:PL 41-PL 6.
15. Feng Y, Piletz JE, Leblanc MH. Agmatine suppresses nitric oxide
production and attenuates hypoxic-ischemic brain injury in neonatal rats. Pediatric research 2002;52:606-11.
16. Kim JH, Yenari MA, Giffard RG, Cho SW, Park KA, Lee JE. Agmatine
reduces infarct area in a mouse model of transient focal cerebral ischemia and protects cultured neurons from ischemia-like injury. Experimental neurology 2004;189:122-30.
17. Kim DJ, Kim DI, Lee SK, Suh SH, Lee YJ, Kim J, et al. Protective
effect of agmatine on a reperfusion model after transient cerebral ischemia: Temporal evolution on perfusion MR imaging and histopathologic findings. AJNR, American journal of neuroradiology 2006;27:780-5.
18. Longa EZ, Weinstein PR, Carlson S, Cummins R. Reversible middle
cerebral artery occlusion without craniectomy in rats. Stroke 1989;20:84-91.
19. Kim JH, Lee YW, Kim JY, Lee WT, Park KA, Lee JE. The effect of
agmatine on expression of MMP2 and MMP9 in Cerebral ischemia. The Korean Journal of Anatomy 2008;41:97-104.
20. Belayev L, Busto R, Zhao W, Ginsberg MD. Quantitative evaluation of
blood-brain barrier permeability following middle cerebral artery occlusion in rats. Brain Res 1996;739:88-96.
21. Strbian D, Durukan A, Pitkonen M, Marinkovic I, Tatlisumak E,
Pedrono E, et al. The blood-brain barrier is continuously open for several weeks following transient focal cerebral ischemia. Neuroscience
25 2008;153:175-81.
22. Heo JH, Han SW, Lee SK. Free radicals as triggers of brain edema
formation after stroke. Free Radic Biol Med 2005;39:51-70.
23. Pillai DR, Dittmar MS, Baldaranov D, Heidemann RM, Henning EC,
Schuierer G, et al. Cerebral ischemia-reperfusion injury in rats--a 3 T MRI study on biphasic blood-brain barrier opening and the dynamics of edema formation. J Cereb Blood Flow Metab 2009;29:1846-55.
24. Kuroiwa T, Ting P, Martinez H, Klatzo I. The biphasic opening of the
blood-brain barrier to proteins following temporary middle cerebral artery occlusion. Acta neuropathologica 1985;68:122-9.
25. Durukan A, Marinkovic I, Strbian D, Pitkonen M, Pedrono E, Soinne L,
et al. Post-ischemic blood-brain barrier leakage in rats: one-week follow-up by MRI. Brain Res 2009;1280:158-65.
26. Tong DC, Adami A, Moseley ME, Marks MP. Prediction of
hemorrhagic transformation following acute stroke: role of diffusion- and perfusion-weighted magnetic resonance imaging. Archives of neurology 2001;58:587-93.
27. Selim M, Fink JN, Kumar S, Caplan LR, Horkan C, Chen Y, et al.
Predictors of hemorrhagic transformation after intravenous recombinant tissue plasminogen activator: prognostic value of the initial apparent diffusion coefficient and diffusion-weighted lesion volume. Stroke 2002;33:2047-52.
28. Yang Q, Tress BM, Barber PA, Desmond PM, Darby DG, Gerraty RP, et
al. Serial study of apparent diffusion coefficient and anisotropy in patients with acute stroke. Stroke 1999;30:2382-90.
26
< ABSTRACT(IN KOREAN)>
일과성 뇌 허혈 백서 모델에서 혈관투과도 영상을 이용한
agmatine의 뇌-혈관 장벽 보호 효과 평가
<지도교수 이승구>
연세대학교 대학원 의학과
안성수
목적: 급성 허혈성 뇌경색이 발생하면 여러 가지 단백 분해
효소들이 분비되면서 뇌-혈관 장벽이 붕괴되며 이는 재관류
후에 더 증가한다고 알려져 있다. 이전 실험 연구에서
agmatine은
뇌-혈관 장벽을 보호하여 그 결과 뇌부종을
감소시킨다고 보고하였다. 따라서 이 연구에서는 일과성 뇌허혈
후 백서 모델에서 혈관투과도 영상을 이용하여 agmatine의
뇌-혈관 장벽 보호 효과를 조기에 평가 하고자 하였다.
재료 및 방법: Sprague-Dawley 백서 30 마리의 중뇌동맥을
90분간 폐색하여 일과성 뇌허혈 모델을 만들고 재관류 시키면서
실험군에 agmatine 100 mg/kg를, 대조군에 동일한 양의 식염수를
복강내로 투여하였다. 자기공명영상은 재관류 4 시간과 30 시간
후에 촬영하였고 12 마리(실험군 6 마리, 대조군 6 마리)는 첫
번째 자기공명영상 촬영 후, 18 마리(실험군 9 마리, 대조군 9
마리)는 두 번째 자기공명영상 촬영 후 조직을 얻었다. 뇌
경색의 부피는 확산자기공명영상에서 측정하였고 정량적 분석을
위해 겉보기 확산계수, 분할 비등방성, 혈관투과도 영상에 관심
영역을 표시하여 값을 구하였다. Factor VIII을 이용하여
면역화학염색을 시행한 후 factor VIII 양성인 세포의 수를
세었다. 두 그룹 간 뇌경색 부피, 뇌경색 부피 증가, 정량적
계수, factor VIII 양성 세포 수를 비교하였다.
27