PUBLIC HEALTH WEEKLY REPORT, PHWR
Vol.10 No.34
2017
CONTENTS
CONTENTS
0914
전국 중환자실 의료관련감염 감시체계(KONIS) 운영 결과0920
임상연구정보서비스(CRIS) 등록 현황0925
주요 감염병 통계 환자감시 : 전수감시, 표본감시 병원체감시 : 인플루엔자 및 호흡기바이러스 급성설사질환, 엔테로바이러스 매개체감시 : 말라리아 매개모기, 일본뇌염 매개모기연구논문 1, Research article 1
전국 중환자실 의료관련감염 감시체계(KONIS)
운영 결과
Healthcare-associated infections in hospital settings, South Korea, 2006-2016
Lee eunju, Woo yeonhee, Lee hyungmin*Division of Healthcare Associated Infection Control, Center for Infectious Disease Control, KCDC
Background: Healthcare-associated infections (HAIs) are emerging as one of the public health problems of concern in South Korea. To monitor and effectively control HAIs at the hospital settings, since 2006, the Korea Centers for Disease Control and Prevention (KCDC) has been operating Korean National Healthcare-associated Infections Surveillance System (KONIS) in collaboration with Korean Society for Healthcare-associated Infection Control and Prevention (KOSHIC). We analyzed characteristics and trend in HAIs from the report on nationwide surveillance system for healthcare-associated infections in intensive care units, 2011-2016.
Methods: Data on urinary tract infection (UTI), blood stream infection (BSI), pneumonia (PNEU) were collected from the ICU (intensive care unit) module of the KONIS between July 2006 and June 2016. The rate of HAI was estimated by the number of infections per 1,000 patient-days or device-days. Epiinfo software was used for the trend analysis of HAIs by comparison between two time periods(2006-2011 vs 2012-2016).
Results: The pooled mean rate of total HAIs decreased from 7.21 during 2006-2011 to 3.40 during 2012-2016, specifically showing 3.82 to 1.07 for UTI, 1.99 to 1.42 for BSI and 1.41 to 0.91 for PNU, respectively.
In device-associated infections, they showed similarly downward patterns: 4.41 to 1.26 for catheter-associated urinary track infections(CAUTIs), 3.11 to 2.40 for central line-associated blood stream infections(CLABSIs) and 2.11 to 1.38 for ventilator-associated pneumonias(VAPs).
Conclusion: It is suggested that strengthened measures for quality improvement of the infection prevention and control in hospitals would contribute to the significant decrease in HAIs.
질병관리본부 감염병관리센터 의료감염관리과 이은주, 우연희, 이형민*
들어가는 말
현대의학의 발달로 인한 침습적 의료기구 사용의 증가, 만성질환자의 증가 등으로 국민의 건강을 위협하는 의료관련감염 문제가 사회적 이슈로 꾸준히 제기되어 왔다. 특히 면역력 저하 환자와 중증환자가 대부분이고, 일반 병동에 비해 의료진의 접촉이 많은 중환자실의 의료관련 감염관리가 중요하게 부각되고 있다. 이에 중환자실 의료관련감염의 현황을 파악하고 이를 예방하기 위한 기초자료로 활용할 수 있는 지속적이고 효율적인 중환자실 감시체계가 필요하다. 지속적이며 효율적인 감시체계 구축을 위해 질병관리본부는 대한의료관련감 염관리학회와 공 동으 로 20 0 6년부터 「전국 중환자실 의료관련감염 감시체계(KONIS)」를 구축·운영하고 있다. 대상 감시기관은 2015년도까지는 300병상 이상의 중환자실을 운영하는 종합병원이었으며 2016년도부터 종합병원 및 200병상 이상 병원으로서 중환자실과 감염관리실을 운영하는 병원으로 확대하였고, 감시대상은 요로감염(urinary tract infection, UTI), 혈류감염(blood stream infection, BSI), 폐렴(pneumonia, PNEU) 3가지이다. 이 글은 2006년부터 2016년 6월까지 「전국 중환자 실 의료관련감염 감시체계」 결과를 바탕으로 의료관련감염의 변화 양상을 분석하였다.몸 말
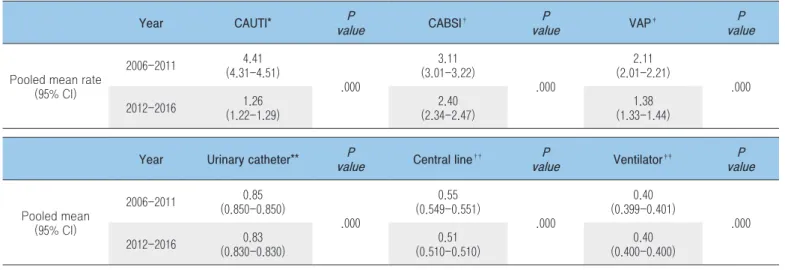
전국 중환자실 의료관련감염 감시체계는 참여 의료기관의 중환자 실에 입원한 만 15세 이상의 환자 를 대상으 로 미국 질병통제예방센터(CDC)의 진단기준을 우리나라 실정에 맞게 보완한 KONIS 매뉴얼을 적용하여 자료를 수집하였으며, 변화 양상을 분석하기 위해 수집된 자료를 연도별 또는 2006년∼2011*년과 2012년∼2016년† 으로 나누어 비교하였고, Epiinfo(2*2) 통계 프로그램을 사용하였다. * 2006년∼2011년 : 2006년(2006.7~2006.12), 2008년(2007.7∼2008.6), 2009년(2008.7∼2009.6), 2010년(2009.7∼2010.6), 2011년(2010.7∼2011.6) † 2012년∼2016년 : 2012년(2011.7~2012.6), 2013년(2012.7∼2013.6), 2014년(2013.7∼2014.6), 2015년(2014.7∼2015.6), 2016년(2015.7∼2016.6) 분석 결과 2006년∼2011년 1,000 재원일수 감염률은 7.21(95% CI, 7.09-7.32)이었고, 그 중 요로감염(UTI) 3.82(95% CI, 3.73-3.90), 혈류감염(BSI) 1.99(95% CI, 1.93-2.05), 폐렴(PNEU) 1.41(95% CI, 1.36-1.46) 이었다. 2012년∼2016년 1,000 재원일수 감염률은 3.40 (95% CI, 3.35-3.46)이었고, 요로감염(UTI) 1.07(95% CI, 1.04-1.10), 혈류감염(BSI) 1.42(95% CI, 1.39-1.46), 폐렴(PNEU) 0.91(95% CI, 0.88-0.94)로 나타났다(Table 1).카테터 관련 감염률을 살펴보면, 2006년∼2011년 1,000 기구일수 감염률은 요로카테터 관련 요로감염(Catheter-associated urinary tract infection, CAUTI) 4.41(95% CI, 4.31-4.51), 중심정맥관 관련 혈류감염(Catheter-associated blood stream infection, CABSI) 3.11(95% CI, 3.01-3.22), 인공호흡기 관련 폐렴(Ventilator-associated
Table 1. Pooled mean rates of healthcare-associated infections
Abbreviations: UTI, urinary tract infection; BSI, bloodstream infection; PNEU, pneumonia; CI, confidence interval. * (No. of UTIs, BSIs, or PNEUs / No. of patient-days) × 1,000
† (No. of UTIs / No. of patient-days) × 1,000 ‡ (No. of BSIs / No. of patient-days) × 1,000 § (No. of PNEUs / No. of patient-days) × 1,000
Period UTI† P
value BSI‡ valueP PNEU§ valueP Total* valueP
Pooled mean rate (95% CI) 2006-2011 (3.73-3.90) 3.82 .000 1.99 (1.93-2.05) .000 1.41 (1.36-1.46) .000 7.21 (7.09-7.32) .000 2012-2016 1.07 (1.04-1.10) 1.42 (1.39-1.46) 0.91 (0.88-0.94) 3.40 (3.35-3.46)
pneumonia, VAP) 2.11(95% CI, 2.01-2.21)이었고, 2012년∼2016년 1,000 기구일수 감염률은 요로카테터 관련 요로감염(Catheter-associated urinary tract infection, CAUTI) 1.26(95% CI, 1.22-1.29), 중심정맥관 관련 혈류감염(Catheter-associated blood stream infection, CABSI) 2.40(95% CI, 2.34-2.47), 인공호흡기 관련 폐렴(Ventilator-associated pneumonia, VAP) 1.38(95% CI, 1.33-1.44)로 분석되었다(Table 2). 카테터 사용비를 살펴보면 2006년∼2011년 요로카테터 사용비 0.85(95% CI, 0.850-0.850), 중심정맥관 사용비 0.55(95% CI, 0.549-0.551), 인공호흡기 사용비 0.40(95% CI, 0.399-0.401)이었고, 2012년∼2016년에서는 요로카테터 사용비 0.83(95% CI, 0.830-0.830), 중심정맥관 사용비 0.51(95% CI, 0.510-0.510), 인공호흡기 사용비 0.40(95% CI, 0.400-0.400)으로 나타났다(Table 2). 의료관련감염 임상증례 환자에서 분리된 병원체의 주요 항생제 내성률을 살펴보면 2006년∼2011년에는 MRSA(Methicillin-resistant Staphylococcus aureus) 90.4%, IRAB(Imipenem-MRSA(Methicillin-resistant Acinetobacter baumannii) 74.8%로 나타났고, 2012년∼2016년은 MRSA(Methicillin-resistant Staphylococcus aureus) 92.8%, IRAB(Imipenem-resistant Acinetobacter baumannii) 87.5%로 최근
5년 동안 Acinetobacter baumannii의 imipenem 내성률이 큰 폭으로
증가하였다(Table 3).
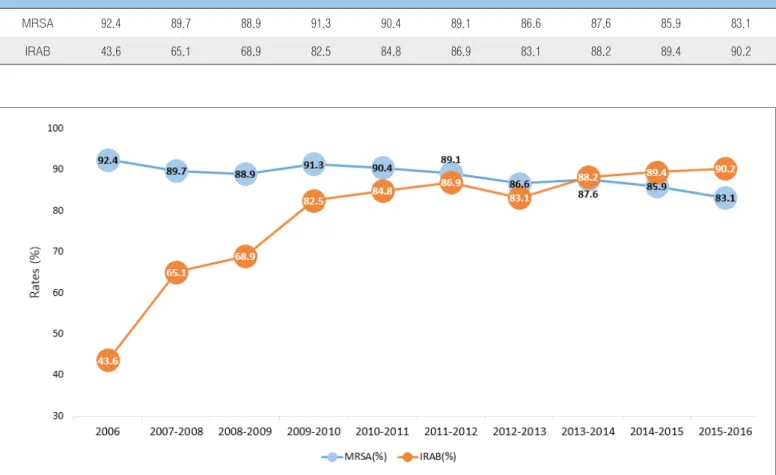
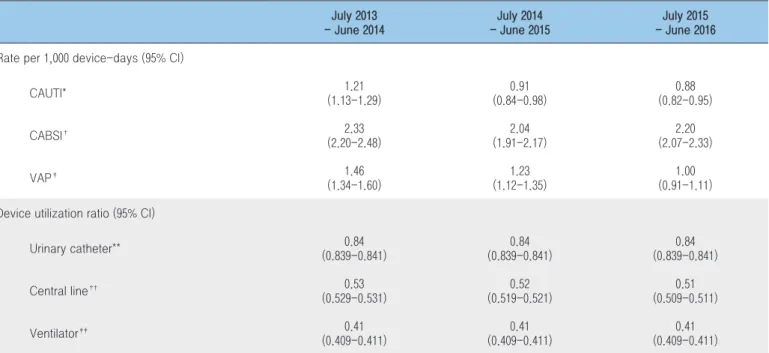
연도별로 주요 항생제 내성률 을 비교한 결과 20 0 6년 MRSA(Methicillin-resistant Staphylococcus aureus)는 92.4%에서 2016년 83.1%로 내성률이 감소하였고, 2006년 IRAB(Imipenem-resistant Acinetobacter baumannii)는 43.6%에서 2016년 90.2%로 증가하였다. MRSA(Methicillin-resistant Staphylococcus aureus)는 매년 비슷한 수준이거나 감소한 반면, IRAB(Imipenem-resistant Acinetobacter baumannii)는 매년 증가 추세로 2014년부터는 MRSA(Methicillin-resistant Staphylococcus aureus)보다 높은 내성률을 보였다(Table 4). 최근 3년간 기구 관련 감염률을 비교해보면 1,000 기구일수 감염률은 요로카테터 관련 요로감염(CAUTI) 2014년 1.21, 2015년 0.91, 2016년 0.88이었고, 중심정맥관 관련 혈류감염(CABSI) 2014년 2.33, 2015년 2.04, 2016년 2.20이었으며, 인공호흡기 관련 폐렴(VAP) 2014년 1.46, 2015년 1.23, 2016년 1.00이었다(Table 5). 중심정맥관 관련 혈류감염(CABSI)을 제외하고 요로카테터 관련 요로감염(CAUTI), 인공호흡기 관련 폐렴(VAP)은 지속적으로 감염률이 감소하였다.
Table 2. Pooled mean rates of device-associated infection and device utilization ratios
Abbreviations: CAUTI,Catheter-Associated urinary tract infection; CABSI,Catheter-Associated blood stream infection; VAP,Ventilator-Associated pneumonia * (No. of urinary catheter-associated UTIs / No. of urinary catheter-days) × 1,000
† (No. of central line-associated BSIs / No. of central line-days) × 1,000 ‡ (No. of ventilator-associated PNEUs / No. of ventilator-days) × 1,000 ** (No. of urinary catheter-days / No. of patient-days)
†† (No. of central line-days / No. of patient-days) ‡‡ (No. of ventilator-days / No. of patient-days)
Year CAUTI* valueP CABSI† P
value VAP‡ valueP
Pooled mean rate (95% CI) 2006-2011 (4.31-4.51) 4.41 .000 3.11 (3.01-3.22) .000 2.11 (2.01-2.21) .000 2012-2016 1.26 (1.22-1.29) 2.40 (2.34-2.47) 1.38 (1.33-1.44)
Year Urinary catheter** P
value Central line††
P value Ventilator‡‡ P value Pooled mean (95% CI) 2006-2011 0.85 (0.850-0.850) .000 0.55 (0.549-0.551) .000 0.40 (0.399-0.401) .000 2012-2016 (0.830-0.830) 0.83 (0.510-0.510)0.51 (0.400-0.400) 0.40
Table 3. Antimicrobial resistance rates(%) of major pathogens isolated from patients with healthcare-associated infections
* Antimicrobial resistance rates : No. of resistant / Total isolates × 100
Organism
Antimicrobial resistance rates
2006-2011 2012-2016 Methicillin-resistant Staphylococcus aureus 90.4 86.7 Vancomycin-resistant Enterococcus faecalis 3.80 3.80 Vancomycin-resistant Enterococcus faecium 40.3 48.3 Cefotaxime-resistant Escherichia coli 39.9 46.6 Cefotaxime-resistant Klebsiella pneumoniae 61.9 59.3 Ciprofloxacin-resistant Escherichia coli 52.9 56.1 Ciprofloxacin-resistant Klebsiella pneumoniae 56.8 51.6 Imipenem-resistant Pseudomonas aeruginosa 52.9 41.0 Imipenem-resistant Acinetobacter baumannii 74.8 87.5
Table 4. Antimicrobial resistance rates(%) of major isolated pathogens
2006 2007-2008 2008-2009 2009-2010 2010-2011 2011-2012 2012-2013 2013-2014 2014-2015 2015-2016 MRSA 92.4 89.7 88.9 91.3 90.4 89.1 86.6 87.6 85.9 83.1
IRAB 43.6 65.1 68.9 82.5 84.8 86.9 83.1 88.2 89.4 90.2
최근 3년간 기구 사용비를 비교하면 요로카테터의 사용비는 2014년 0.84, 2015년 0.84, 2016년 0.84, 중심정맥관의 사용비는 2014년 0.53, 2015년 0.52, 2016년 0.51, 인공호흡기의 사용비는 2014년 0.41, 2015년 0.41, 2016년 0.41이었다(Table 5). 요로카테터의 사용비, 중심정맥관 사용비, 인공호흡기 사용비 모두 큰 변화 양상은 보이지 않았다.
맺는 말
중환자실에서의 1,000 재원일수 감염률은 7.21(2006년∼ 2011년)에서 3.40(2012년∼2016년)으로 감소하였고, 요로감염(UTI)은 3.82(2006년∼2011년)에서 1.07(2012년∼2016년), 혈류감염(BSI)은 1.99(2006년∼2011년)에서 1.42(2012년∼2016년), 폐렴(PNEU)은 1.41(2006년∼2011년)에서 0.91(2012년∼2016년)로 총 감염률, 요 로감 염, 혈류 감 염, 폐렴 모두 감소하 였다. 카 테터 관 련 감염률을 살펴보면 1,000 기구일수 감염률은 요로카테터 관련 요로감염(Catheter-Associated urinary tract infection, CAUTI) 4.41(2006년∼2011년)에서 1.26(2012년∼2016년), 중심정맥관 관련 혈류감염(Catheter-Associated blood stream infection, CABSI)은 3.11(2006년∼2011년)에서 2.40(2012년∼2016년), 인공호흡기 관련 폐렴(Ventilator-Associated pneumonia, VAP)은 2.11(2006년∼2011년)에서 1.38(2012년∼2016년)로 카테터 관련 감염률 역시 모두 감소하였다. 중환자 실에서의 의료관련감염 감소는 국내 의료기관의 의료관련감염 관리의 수준향상, 지속적인 감시를 통해 감염률을 줄이고 자 하 는 노력 등의 결과로 생각된다. 그러나 현재의 감시체계는 일정규모이상의 중환자실을 운영하는 의료기관이 대상으로 향후 중소병원을 포함한 감시체계의 변화가 필요할 것으로 판단되며, 또한 손 위생 실천률 등 과정지표와 연계·적용하여 의료관련감염의 선제적 예방활동을 촉진하는 토대도 마련되어야 할 것이다. 앞으로 감시대상 확대, 지속적인 실무자 교육, 신뢰도 관리Table 5. Comparison of device-associated infection rates and device utilization ratios, 2014-2016
Abbreviations: CAUTI,Catheter-Associated urinary tract infection; CABSI,Catheter-Associated blood stream infection; VAP,Ventilator-Associated pneumonia * (No. of urinary catheter-associated UTIs / No. of urinary catheter-days) × 1,000
† (No. of central line-associated BSIs / No. of central line-days) × 1,000 ‡ (No. of ventilator-associated PNEUs / No. of ventilator-days) × 1,000 ** (No. of urinary catheter-days / No. of patient-days)
†† (No. of central line-days / No. of patient-days) ‡‡ (No. of ventilator-days / No. of patient-days)
July 2013 - June 2014 July 2014 - June 2015 July 2015 - June 2016 Rate per 1,000 device-days (95% CI)
CAUTI* 1.21 (1.13-1.29) 0.91 (0.84-0.98) 0.88 (0.82-0.95) CABSI† 2.33 (2.20-2.48) 2.04 (1.91-2.17) 2.20 (2.07-2.33) VAP‡ 1.46 (1.34-1.60) 1.23 (1.12-1.35) 1.00 (0.91-1.11)
Device utilization ratio (95% CI)
Urinary catheter** (0.839-0.841)0.84 (0.839-0.841)0.84 (0.839-0.841)0.84 Central line†† 0.53 (0.529-0.531) 0.52 (0.519-0.521) 0.51 (0.509-0.511) Ventilator‡‡ 0.41 (0.409-0.411) 0.41 (0.409-0.411) 0.41 (0.409-0.411)
등 질 향상 활동을 꾸준히 유지하여 다양한 정책 수립에 기여하고, 궁극적으로 국내 의료관련감염을 줄이기 위한 노력을 계속 해 나가는 것이 무엇보다 중요하다.
참고문헌
1. 전국 중환자 실 의료관련감 염 감시체계 운영(O p eration of th e Nationwide Surveillance System for Healthcare Associated Infection in Intensive Care Units) 최종결과 보고서. 2006∼2016. 질병관리본부.
임상연구 등록을 통한 정보의 공개는 임상시험 결과의 객관성 확보와 임상시험 참여자에 대한 보호를 강화하기 위한 것으로, 현재 전 세계 주요 국가들이 임상시험 등록 체계를 구축하고 있다. 국제의학학술지편집자협의회(International Committee of Medical Journal Editors, ICMJE)에서는 2005년부터 회원학술지에 임상시험 결과를 발표하고자 할 때는 세계보건기구(WHO)의 국제임상시험등록플랫폼(International Clinical Trials Registry
Platform, ICTRP)과 같이 ICMJE에서 인정하는 임상시험 등록 시스템에 연구정보를 사전에 등록하여야 함을 명시하고 있으며, 2008년 세계의사회(World Medical Association, WMA)에서도 헬싱키 선언의 개정문에 첫 연구대상자가 임상시험에 참여하기 전에 임상시험 등록을 완료하여야 한다는 조항을 추가하였다.
임상연구정보서비스(Clinical Research Information Service, CRIS)는 우리나라에서 수행되고 있는 임상연구 정보의 공유를
Review of clinical studies registered with the Clinical Research Information Service
Kim Mi-Jung, Choi Eun-Kyoung, Park Hyun-Young
Division of Cardiovascular Disease, Center for Biomedical Science, KNIH, KCDC
Clinical research registration is required in many countries to improve the transparency of clinical research and to ensure the safety of subjects. In 2010, the Korea Centers for Disease Control and Prevention (KCDC) established the Clinical Research Information Service (CRIS), a non-profit online registration system for clinical research, joining in the World Health Organization’s International Clinical Trials Registry Platform (ICTRP) as a primary registry. The main purpose of the CRIS was to improve the transparency, accountability, and ethics in clinical research being conducted in Korea by sharing registered information with the public.
A total of 2,264 clinical studies were registered with the CRIS from 2010 through 1st quarter of 2017. Of the 2.264 registered studies, 1,632 (72.1%) were for interventional studies and 632 (27.9%) for observational studies. The most frequent intervention types were drug/biological therapy (48.7%, n=794), medical device (13.1%, n=214), surgery/ procedure (12.8%, n=209) and combined therapy (5.6%, n=91). In recent years, the necessity of registration of clinical trial results has been emphasized to prevent selective reporting of outcomes and reduce publication bias. Therefore the WHO ICTRP participating registries including the CRIS have added the entry items for results reporting, and we expect that the registration of clinical trials and their results contributes in helping people make decisions about health care services.
연구단신 1, Brief report 1
임상연구정보서비스(CRIS) 등록 현황
질병관리본부 생명의과학센터 심혈관질환과 김미정, 최은경, 박현영*
위하여 질병관리본부에서 구축하여 2010년 2월부터 운영하고 있으며, WHO ICTRP에 primary registry로 참여하고 있다(’10. 5월). CRIS에는 총 2,264건(’17.3.31 기준)의 임상연구가 등록되었고 해마다 등록 수가 증가하고 있다(Figure 1). 등록된 연구정보는 국어와 영문 2개 언어로 모두 공개되고 있으며, 매달 WHO ICTRP로 전송되어 국제적으로 공유되고 있다. 연구자의 자 발적 등 록과 더불어 보건복지부의 연구비 지원을 받는 임상 연구 과제 는 등 록이 의무화되어 있으며 C R I S 등 록 을 위해서는 반드 시 임상 연구 심의위원회 또는
기관윤리위원회(Institutional Review Board, IRB)의 승인을 받아야 한다. 또한 첫 연구대상자 모집 전에 임상시험 등록을 하도록 권고하고 있으나, 정보 공유를 위해 진행 중 또는 종료된 연구도 등록을 허용하고 있다. 주요 등록 항목은 연구개요, 임상시험 윤리 심의, 연구자, 연구현황, 연구비 지원기관, 연구책임기관, 연구 요약, 연구 설계, 대상자 선정기준, 결과평가 변수, 연구결과 및 발표, 연구데이터 공유 등 총 12단계로 이루어져 있으며 이는 WHO ICTRP 표준항목을 따르고 있다. CRIS에 등록된 총 2,264건(’17.3.31 기준)의 임상연구를 71 302 615 962 1,323 1,735 2,165 2,264 500 1,000 1,500 2,000 2,500 2010 2011 2012 2013 2014 2015 2016 2017 1Q N o . cl in ic al s tu d ie s
Figure 1. Accumulated number of clinical studies registered with the CRIS in Republic of Korea from 2010 to 1st quarter of 2017
1,632 (72.1%) 632
(27.9%)
Interventional Observational Figure 2. Classification of registered studies with the CRIS according to research type
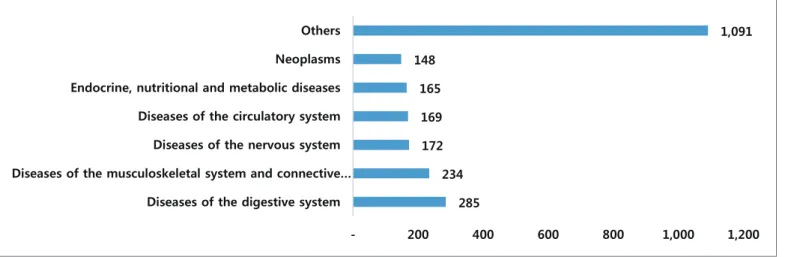
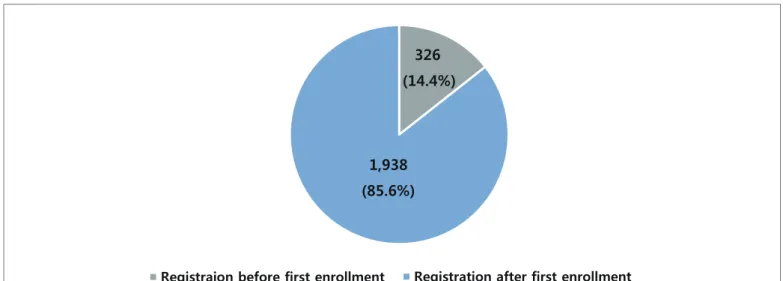
연구 종류별(중재연구 및 관찰연구) 및 중재연구의 중재 종류별로 비교해보면 Figure 2 및 Figure 3과 같다. 등록된 임상연구 중에서 중재연구는 1,632건(72.1%), 관찰연구는 632건(27.9%)으로 중재연구 비율이 높았고, 중재연구 1,632건 중 의약품 794건(48.7%), 의료기기 214건(13.1%), 시술/수술 209건(12.8%), 두 가지 이상의 중재가 혼합되어 있는 경우가 91건(5.6%), 기타 324건(19.9%)이었다. 질환분류별 등록건수를 살펴보면 소화기계통의 질환이 285건(12.6%)으로 가장 많았고 근골격계통 및 결합조직의 질환 234건(10.3%), 신경계통의 질환 172건(7.6%), 순환기계통의 질환 169건(7.5%), 내분비, 영양 및 대사질환 165건(7.3%), 신생물 148건(6.5%) 순 이었다(Figure 4). 첫 연구대상자 모집 전 등 록을 완료한 연구 는 326건 (14.4%)으로 연구대상자 모집 전에 등록을 완료하는 경우가 현저히 낮게 나타났다(Figure 5). 임상시험 등록의 목적 중 하나인 연구의 객관성 및 신뢰성을 높이기 위해서는 첫 연구대상자 모집 전 임상시험 등록의 중요성에 대한 연구자들의 인식 확산이 필요하다. 최근 의학저널 및 전 세계 보건의료 관련 주요 연구기관 등에서 임상시험 정보뿐만 아니라 연구결과 등록의 필요성이 강조되고 있으며 결과 공유를 독려하기 위한 성명서 발표 및 방안 등이 제시되고 있다. 794 209 214 91 324 0 100 200 300 400 500 600 700 800 900 Drug Procedure/Surgery Medical Device Combined Others
Figure 3. Classification of registered interventional studies with the CRIS according to intervention type
285 234 172 169 165 148 1,091 - 200 400 600 800 1,000 1,200
Diseases of the digestive system Diseases of the musculoskeletal system and connective…
Diseases of the nervous system Diseases of the circulatory system Endocrine, nutritional and metabolic diseases Neoplasms Others
2013년 세계의사회는 연구결과 공개가 연구자의 의무임을 헬싱키 선언문에 추가하였으며, WHO에서는 연구종료 12개월 이내에 연구결과를 논문을 통해 발표하거나 임상시험등록시스템에 결과변수를 등록 및 공개하여야 한다는 성명서를 발표하였다(’15년). 또한 성명서를 통해 임상연구 데이터 공유의 필요성을 언급하고 관련 정책의 지지를 명시하였다. 이에 WHO ICTRP에 참여하고 있는 각 임상검사등록시스템에서는 연구결과 등록을 위한 항목을 추가하기로 협의하였다. 이에 질병관리본부에서도 전 세계 주요 연구비 지원기관의 관련 지침 및 WHO ICTRP 임상검사등록 시스템간의 논의 결과 등을 반영하여 연구결과 및 익명화된 연구대상자의 데이터 공유 계획 등 록을 위한 입력 항목 을 추가하였다(’16.12월). 연구결과 등록은 연구종료 12개월 이내에 하도록 권고하고 있으며, 연구결과 개요를 입력하되 연구대상자에 대한 정보, 연구결과 변수에 대한 정보, 이상반응에 대한 정보 등을 포함하도록 하였다(Table 1). 익명화된 연구대상자의 데이터 공유 계획에 대한 정보는 계획 수립 여부, 공유 예상 시기, 공유방법에 대하여 입력하도록 하였다(Table 1). CR IS를 통하여 지속적으 로 임상시험 정보 및 결과 를 공개함으로써 국내 임상연구의 투명한 수행과 연구결과의 신뢰성 제고에 기여할 수 있을 것으로 기대하고 있다. 또한 국내에서 수행되는 임상시험의 동향을 제공함으로써 임상연구의 불필요한 중복을 방지하고 연구자원의 효율적인 배분을 유도하는 등 관련 연구자, 정책 결정자 및 유관 연구기관 등의 의사결정과정에도 도움이 될 것이다. 따라서 질병관리본부에서는 임상시험 정보 및 결과 등록을 촉진하기 위한 지속적인 홍보 및 필요한 제도 마련을 위해 노력할 것이다. 326 (14.4%) 1,938 (85.6%)
Registraion before first enrollment Registration after first enrollment
Figure 5. Classification of registered studies with the CRIS according to registration timing
Table 1. CRIS entry items for results reporting and individual patient data sharing statement Entry Items
Results
(Within 12 Months of Study Completion)
- Information of Participants
: Number of Target, Number of Study Type, Number of Drop out, Number of Gender and Age - Outcome Measure: Primary Outcome, Secondary Outcome - Adverse Event: Serious Adverse Event, Other Adverse Event
Sharing statement
- Time of Sharing(Planned): Year, Month - Way of Sharing
: Provided on Request, Not Available, Public Repository, Institutional or Personal Repository, Be provided later
1.1 환자감시 : 전수감시 감염병 주간 발생 현황
(33th week)
Table 1. Reported cases of national infectious diseases in Republic of Korea, week ending August 19, 2017 (33th week)*
Unit: No. of cases†
Classification of disease‡ Current week Cum.2017
5-year weekly average
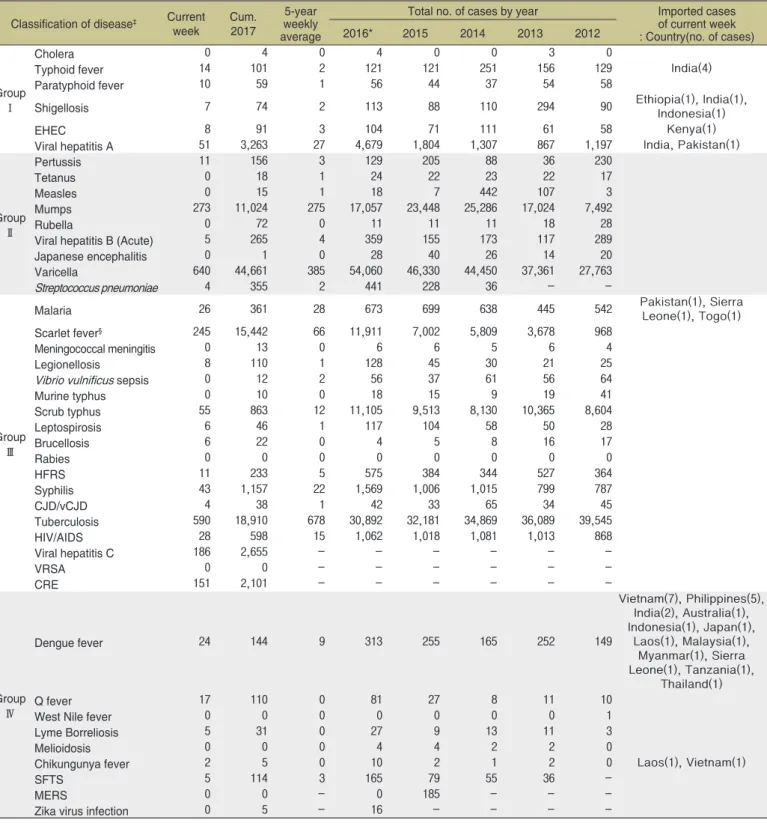
Total no. of cases by year Imported cases of current week : Country(no. of cases) 2016* 2015 2014 2013 2012 Group Ⅰ Cholera 0 4 0 4 0 0 3 0
Typhoid fever 14 101 2 121 121 251 156 129 India(4)
Paratyphoid fever 10 59 1 56 44 37 54 58
Shigellosis 7 74 2 113 88 110 294 90 Ethiopia(1), India(1), Indonesia(1)
EHEC 8 91 3 104 71 111 61 58 Kenya(1)
Viral hepatitis A 51 3,263 27 4,679 1,804 1,307 867 1,197 India, Pakistan(1)
Group Ⅱ Pertussis 11 156 3 129 205 88 36 230 Tetanus 0 18 1 24 22 23 22 17 Measles 0 15 1 18 7 442 107 3 Mumps 273 11,024 275 17,057 23,448 25,286 17,024 7,492 Rubella 0 72 0 11 11 11 18 28
Viral hepatitis B (Acute) 5 265 4 359 155 173 117 289
Japanese encephalitis 0 1 0 28 40 26 14 20
Varicella 640 44,661 385 54,060 46,330 44,450 37,361 27,763
Streptococcus pneumoniae 4 355 2 441 228 36 -
-Group Ⅲ
Malaria 26 361 28 673 699 638 445 542 Pakistan(1), Sierra Leone(1), Togo(1)
Scarlet fever§ 245 15,442 66 11,911 7,002 5,809 3,678 968
Meningococcal meningitis 0 13 0 6 6 5 6 4
Legionellosis 8 110 1 128 45 30 21 25
Vibrio vulnificus sepsis 0 12 2 56 37 61 56 64
Murine typhus 0 10 0 18 15 9 19 41 Scrub typhus 55 863 12 11,105 9,513 8,130 10,365 8,604 Leptospirosis 6 46 1 117 104 58 50 28 Brucellosis 6 22 0 4 5 8 16 17 Rabies 0 0 0 0 0 0 0 0 HFRS 11 233 5 575 384 344 527 364 Syphilis 43 1,157 22 1,569 1,006 1,015 799 787 CJD/vCJD 4 38 1 42 33 65 34 45 Tuberculosis 590 18,910 678 30,892 32,181 34,869 36,089 39,545 HIV/AIDS 28 598 15 1,062 1,018 1,081 1,013 868 Viral hepatitis C 186 2,655 - - - -VRSA 0 0 - - - -CRE 151 2,101 - - - -Group Ⅳ Dengue fever 24 144 9 313 255 165 252 149 Vietnam(7), Philippines(5), India(2), Australia(1), Indonesia(1), Japan(1), Laos(1), Malaysia(1), Myanmar(1), Sierra Leone(1), Tanzania(1), Thailand(1) Q fever 17 110 0 81 27 8 11 10
West Nile fever 0 0 0 0 0 0 0 1
Lyme Borreliosis 5 31 0 27 9 13 11 3
Melioidosis 0 0 0 4 4 2 2 0
Chikungunya fever 2 5 0 10 2 1 2 0 Laos(1), Vietnam(1)
SFTS 5 114 3 165 79 55 36
-MERS 0 0 - 0 185 - -
-Zika virus infection 0 5 - 16 - - -
-Abbreviation: EHEC= Enterohemorrhagic Escherichia coli, HFRS= Hemorrhagic fever with renal syndrome, CJD/vCJD= Creutzfeldt-Jacob Disease / variant Creutzfeldt-Jacob Disease, VRSA= Vancomycin-resistant Staphylococcus aureus, CRE= Carbapenem-resistant Enterobacteriaceae, SFTS= Severe fever with thrombocytopenia syndrome, MERS-CoV= Middle East Respiratory Syndrome Coronavirus.
Cum: Cumulative counts from 1st week to current week in a year.
* The reported data for year 2017 are provisional but the data from 2012 to 2016 are finalized data.
† According to surveillance data, the reported cases may include all of the cases such as confirmed, suspected, and asymptomatic carrier in the group.
‡ The reported surveillance data excluded Hansen’s disease and no incidence data such as Diphtheria, Poliomyelitis, Haemophilus influenzae type b, Epidemic typhus, Anthrax, Plague, Yellow fever, Viral hemorrhagic fever, Smallpox, Severe Acute Respiratory Syndrome, Animal influenza infection in humans, Novel Influenza,
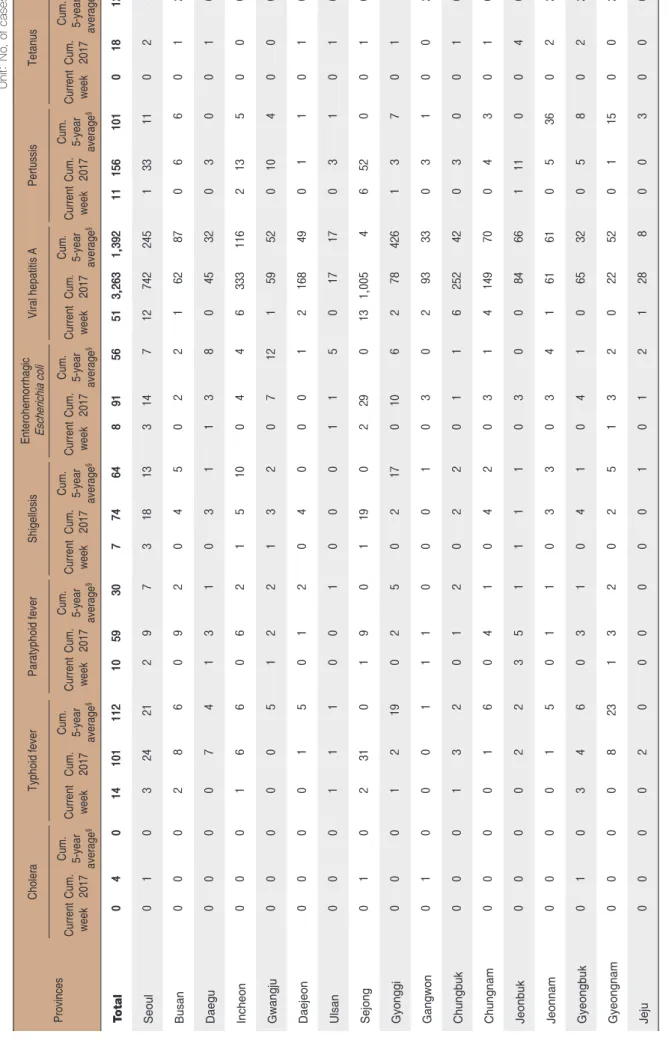
Table 2. Reported cases of national infectious diseases in Repu
blic of Korea, week ending August 19, 2017 (33th week)*
U n it: N o . o f c a se Provinces Cholera Typhoid fever Paratyphoid fever Shigellosis
Enterohemorrhagic Escherichia coli
Viral hepatitis A
Pertussis
Tetanus
Current week Cum. 2017 Cum. 5-year average
§
Current week Cum. 2017 Cum. 5-year average
§
Current week Cum. 2017 Cum. 5-year average
§
Current week Cum. 2017 Cum. 5-year average
§
Current week Cum. 2017 Cum. 5-year average
§
Current week Cum. 2017 Cum. 5-year average
§
Current week Cum. 2017 Cum. 5-year average
§
Current week Cum. 2017 Cum. 5-year average
T otal 0 4 0 14 101 112 10 59 30 7 74 64 8 91 56 51 3,263 1,392 11 156 101 0 18 12 Seoul 0 1 0 3 24 21 2 9 7 3 18 13 3 14 7 12 742 245 1 33 11 0 2 Busan 0 0 0 2 8 6 0 9 2 0 4 5 0 2 2 1 62 87 0 6 6 0 1 Daegu 0 0 0 0 7 4 1 3 1 0 3 1 1 3 8 0 45 32 0 3 0 0 1 Incheon 0 0 0 1 6 6 0 6 2 1 5 10 0 4 4 6 333 116 2 13 5 0 0 Gwangju 0 0 0 0 0 5 1 2 2 1 3 2 0 7 12 1 59 52 0 10 4 0 0 Daejeon 0 0 0 0 1 5 0 1 2 0 4 0 0 0 1 2 168 49 0 1 1 0 1 Ulsan 0 0 0 1 1 1 0 0 1 0 0 0 1 1 5 0 17 17 0 3 1 0 1 Sejong 0 1 0 2 31 0 1 9 0 1 19 0 2 29 0 13 1,005 4 6 52 0 0 1 Gyonggi 0 0 0 1 2 19 0 2 5 0 2 17 0 10 6 2 78 426 1 3 7 0 1 Gangwon 0 1 0 0 0 1 1 1 0 0 0 1 0 3 0 2 93 33 0 3 1 0 0 Chungbuk 0 0 0 1 3 2 0 1 2 0 2 2 0 1 1 6 252 42 0 3 0 0 1 Chungnam 0 0 0 0 1 6 0 4 1 0 4 2 0 3 1 4 149 70 0 4 3 0 1 Jeonbuk 0 0 0 0 2 2 3 5 1 1 1 1 0 3 0 0 84 66 1 11 0 0 4 Jeonnam 0 0 0 0 1 5 0 1 1 0 3 3 0 3 4 1 61 61 0 5 36 0 2 Gyeongbuk 0 1 0 3 4 6 0 3 1 0 4 1 0 4 1 0 65 32 0 5 8 0 2 Gyeongnam 0 0 0 0 8 23 1 3 2 0 2 5 1 3 2 0 22 52 0 1 15 0 0 Jeju 0 0 0 0 2 0 0 0 0 0 0 1 0 1 2 1 28 8 0 0 3 0 0
Cum: Cumulative counts from 1st week to current week in a year * The reported data for year 2017 are provisional but the data
from 2012 to 2016 are finalized data.
† According to surveillance data, the reported cases may includ
e all of the cases such as confirmed, suspected, and asymptomat
ic carrier in the group.
§ Cum. 5-year average is mean value calculated by cumulative c
Table 2. Reported cases of national infectious diseases in Repu
blic of Korea, week ending August 19, 2017 (33th week)*
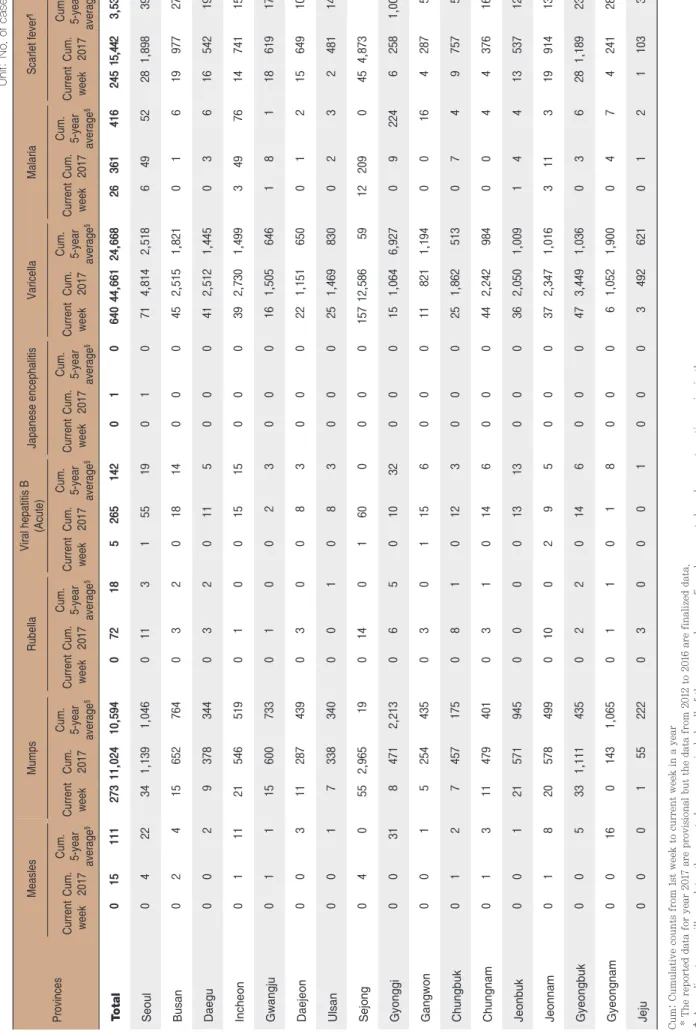
U n it: N Provinces Measles Mumps Rubella Viral hepatitis B (Acute) Japanese encephalitis Varicella Malaria Scarlet fever Current week Cum. 2017 Cum. 5-year average
§
Current week Cum. 2017 Cum. 5-year average
§
Current week Cum. 2017 Cum. 5-year average
§
Current week Cum. 2017 Cum. 5-year average
§
Current week Cum. 2017 Cum. 5-year average
§
Current week Cum. 2017 Cum. 5-year average
§
Current week Cum. 2017 Cum. 5-year average
§ Current week Cum. 2017 T otal 0 15 111 273 11,024 10,594 0 72 18 5 265 142 0 1 0 640 44,661 24,668 26 361 416 245 15,442 Seoul 0 4 22 34 1,139 1,046 0 11 3 1 55 19 0 1 0 71 4,814 2,518 6 49 52 28 1,898 Busan 0 2 4 15 652 764 0 3 2 0 18 14 0 0 0 45 2,515 1,821 0 1 6 19 Daegu 0 0 2 9 378 344 0 3 2 0 11 5 0 0 0 41 2,512 1,445 0 3 6 16 Incheon 0 1 11 21 546 519 0 1 0 0 15 15 0 0 0 39 2,730 1,499 3 49 76 14 Gwangju 0 1 1 15 600 733 0 1 0 0 2 3 0 0 0 16 1,505 646 1 8 1 18 Daejeon 0 0 3 11 287 439 0 3 0 0 8 3 0 0 0 22 1,151 650 0 1 2 15 Ulsan 0 0 1 7 338 340 0 0 1 0 8 3 0 0 0 25 1,469 830 0 2 3 2 Sejong 0 4 0 55 2,965 19 0 14 0 1 60 0 0 0 0 157 12,586 59 12 209 0 45 4,873 Gyonggi 0 0 31 8 471 2,213 0 6 5 0 10 32 0 0 0 15 1,064 6,927 0 9 224 6 Gangwon 0 0 1 5 254 435 0 3 0 1 15 6 0 0 0 11 821 1,194 0 0 16 4 Chungbuk 0 1 2 7 457 175 0 8 1 0 12 3 0 0 0 25 1,862 513 0 7 4 9 Chungnam 0 1 3 11 479 401 0 3 1 0 14 6 0 0 0 44 2,242 984 0 0 4 4 Jeonbuk 0 0 1 21 571 945 0 0 0 0 13 13 0 0 0 36 2,050 1,009 1 4 4 13 Jeonnam 0 1 8 20 578 499 0 10 0 2 9 5 0 0 0 37 2,347 1,016 3 11 3 19 Gyeongbuk 0 0 5 33 1,111 435 0 2 2 0 14 6 0 0 0 47 3,449 1,036 0 3 6 28 1,189 Gyeongnam 0 0 16 0 143 1,065 0 1 1 0 1 8 0 0 0 6 1,052 1,900 0 4 7 4 Jeju 0 0 0 1 55 222 0 3 0 0 0 1 0 0 0 3 492 621 0 1 2 1
from 2012 to 2016 are finalized data. e all of the cases such as confirmed, suspected, and asymptomat
ic carrier in the group.
Table 2. Reported cases of national infectious diseases in Repu
blic of Korea, week ending August 19, 2017 (33th week)*
U n it: N o . o f c a se s Provinces Meningococcal meningitis Legionellosis Vibrio vulnificus sepsis Murine typhus Scrub typhus Leptospirosis Brucellosis
Hemorrhagic fever with renal syndrome
Current week Cum. 2017 Cum. 5-year average
§
Current week Cum. 2017 Cum. 5-year average
§
Current week Cum. 2017 Cum. 5-year average
§
Current week Cum. 2017 Cum. 5-year average
§
Current week Cum. 2017 Cum. 5-year average
§
Current week Cum. 2017 Cum. 5-year average
§
Current week Cum. 2017 Cum. 5-year average
§
Current week Cum. 2017 Cum. 5-year average
T otal 0 13 3 8 110 28 0 12 10 0 10 7 55 863 356 6 46 13 6 22 7 11 233 133 Seoul 0 3 1 2 31 8 0 1 1 0 2 2 2 33 21 0 0 1 0 1 1 0 8 Busan 0 1 1 0 5 3 0 0 1 0 0 1 2 30 19 0 2 1 0 0 0 0 5 Daegu 0 1 0 2 6 1 0 0 0 0 0 0 2 10 6 2 3 0 1 2 1 0 1 Incheon 0 0 0 0 9 2 0 2 1 0 0 1 0 6 12 0 0 0 0 1 0 0 2 Gwangju 0 0 0 0 0 0 0 0 0 0 4 0 0 17 8 0 2 0 0 0 0 0 4 Daejeon 0 0 0 0 0 0 0 0 0 0 0 0 4 31 12 1 2 0 0 0 0 1 5 Ulsan 0 1 0 0 3 1 0 0 0 0 0 0 4 18 9 0 1 0 0 1 0 0 0 Sejong 0 3 0 3 26 0 0 2 0 0 0 0 3 56 1 1 7 0 3 6 0 2 63 Gyonggi 0 1 1 0 3 5 0 0 1 0 0 2 0 9 54 0 1 4 0 1 0 0 6 45 Gangwon 0 0 0 0 3 3 0 0 0 0 1 0 3 16 17 0 1 1 0 4 0 1 16 12 Chungbuk 0 0 0 0 5 1 0 1 0 0 1 0 7 81 4 0 6 0 1 1 1 1 25 Chungnam 0 0 0 0 4 1 0 0 1 0 0 1 4 81 24 1 9 1 1 2 1 1 19 11 Jeonbuk 0 0 0 0 2 0 0 2 1 0 2 0 13 212 31 1 7 0 0 1 1 4 47 Jeonnam 0 1 0 0 5 1 0 1 3 0 0 0 4 49 63 0 2 2 0 1 0 0 21 11 Gyeongbuk 0 1 0 1 4 1 0 2 0 0 0 0 7 205 26 0 3 1 0 1 1 1 10 11 Gyeongnam 0 1 0 0 3 1 0 1 1 0 0 0 0 6 44 0 0 2 0 0 0 0 1 Jeju 0 0 0 0 1 0 0 0 0 0 0 0 0 3 5 0 0 0 0 0 1 0 0
Cum: Cumulative counts from 1st week to current week in a year * The reported data for year 2017 are provisional but the data
from 2012 to 2016 are finalized data.
† According to surveillance data, the reported cases may includ
e all of the cases such as confirmed, suspected, and asymptomat
ic carrier in the group.
§ Calculated by averaging the cumulative counts from 1st week
Table 2. Reported cases of national infectious diseases in Repu
blic of Korea, week ending August 19, 2017 (33th week)*
U n it: N Provinces Syphilis CJD/vCJD Dengue fever Q fever Lyme Borreliosis SFTS
Zika virus infection
Tuberculosis
Current week Cum. 2017 Cum. 5-year average
§
Current week Cum. 2017 Cum. 5-year average
§
Current week Cum. 2017 Cum. 5-year average
§
Current week Cum. 2017 Cum. 5-year average
§
Current week Cum. 2017 Cum. 5-year average
§
Current week Cum. 2017 Cum. 3-year average
§
Current week Cum. 2017 Cum. 3-year average
§ Current week Cum. 2017 T otal 43 1,157 629 4 38 30 24 144 129 17 110 15 5 31 5 5 114 26 0 5 -590 18,910 Seoul 12 299 105 0 6 7 7 50 40 2 9 2 2 11 2 0 2 1 0 1 -121 3,466 Busan 4 69 35 0 2 2 1 5 8 1 2 0 0 1 0 0 0 0 0 0 -42 1,264 Daegu 1 42 31 1 5 2 0 5 6 2 6 1 0 1 0 0 1 1 0 1 -24 Incheon 3 123 55 1 1 1 3 8 6 0 2 0 2 3 0 0 2 1 0 0 -39 1,006 Gwangju 6 39 19 0 2 1 1 3 1 0 0 0 0 0 0 0 0 0 0 0 -13 Daejeon 1 44 15 1 1 1 1 3 5 0 2 0 0 0 0 0 1 1 0 0 -11 Ulsan 0 8 11 0 1 0 0 0 1 0 0 0 0 1 0 1 2 0 0 0 -5 Sejong 10 307 2 0 8 0 3 41 0 2 17 0 0 4 0 1 19 0 0 2 -1 Gyonggi 0 22 168 0 1 6 0 0 34 1 1 2 0 0 1 1 15 3 0 0 -131 4,084 Gangwon 0 13 21 0 2 1 1 2 2 4 29 0 0 0 1 0 2 2 0 0 -11 Chungbuk 1 26 16 0 2 1 2 7 2 1 10 3 1 5 0 0 16 1 0 0 -21 Chungnam 0 18 23 0 1 2 1 2 3 2 9 3 0 2 0 0 3 2 0 0 -32 Jeonbuk 0 38 17 0 1 1 0 3 4 0 7 1 0 0 0 1 11 1 0 1 -21 Jeonnam 2 31 18 0 3 1 2 7 3 1 6 1 0 2 0 0 16 2 0 0 -25 1,010 Gyeongbuk 1 41 28 1 2 2 2 5 5 0 8 1 0 1 1 0 8 5 0 0 -41 1,321 Gyeongnam 2 33 46 0 0 2 0 2 7 0 0 1 0 0 0 1 16 3 0 0 -42 1,236 Jeju 0 4 19 0 0 0 0 1 2 1 2 0 0 0 0 0 0 3 0 0 -10
from 2012 to 2016 are finalized data. e all of the cases such as confirmed, suspected, and asymptomat
ic carrier in the group.
e counts from 1st week to current week for 5(3) preceding years
1.2 환자감시 : 표본감시 감염병 주간 발생 현황
(33th week)
1. Influenza, Republic of Korea, week ending August 19, 2017 (33th week)
● 2017년도 제33주 인플루엔자의사환자분율은 외래환자 1,000명당 3.8명으로 지난주(4.4명)대비 감소
※ 2016-2017절기 유행기준은 8.9명(/1,000)
※ 인플루엔자 유행주의보 해제: 2017년 6월 2일(발령: 2016년 12월 8일)
2. Hand, Foot and Mouth Disease(HFMD), Republic of Korea, week ending August 19, 2017 (33th week)
● 2017년도 제33주 수족구병 의사환자 분율은 외래환자 1,000명당 16.4명으로 지난주(15.1명) 대비 증가
※ 수족구병은 2009년 6월 법정감염병으로 지정되어 표본감시체계로 운영
Figure 1. Weekly proportion of influenza-like illness per 1,000 outpatients, 2013-2014 to 2016-2017 flu seasons
0 20 10 40 30 60 70 80 90 50 100 36 38 40 42 44 46 48 50 52 2 4 6 8 10 12 14 16 18 20 22 24 26 28 30 32 34 ILI per 1,000 week 2014-2015 2015-2016 2013-2014 2016-2017
Figure 2. Status of HFMD sentinel surveillance, 2013-2017
0 10.0 5.0 20.0 15.0 30.0 35.0 40.0 45.0 50.0 25.0 55.0 1 3 5 7 9 11 13 15 17 19 21 23 25 27 29 31 33 35 37 39 41 43 45 47 49 51 No. of outpatients / 1,000 week 2017 2016 2015 2014 2013
Figure 3. Weekly proportion of epidemic keratoconjunctivitis per 1,000 outpatients 0 10 20 30 40 50 60 1 3 5 7 9 11 13 15 17 19 21 23 25 27 29 31 33 35 37 39 41 43 45 47 49 51 53 No. of outpatients / 1,000 week 2014 2015 2016
Figure 4. Weekly proportion of acute hemorrhagic conjunctivitis per 1,000 outpatients
0 1 2 3 4 5 1 3 5 7 9 11 13 15 17 19 21 23 25 27 29 31 33 35 37 39 41 43 45 47 49 51 53 No. of outpatients / 1,000 week 2014 2015 2016 2017 2017
▣ Waterborne and foodborne disease outbreaks, Republic of Korea, week ending August 19, 2017 (33th week)
● 2017년도 제33주에 집단발생이 10건이 발생하였으며 누적발생건수는 341건(환례수 3,985명)이 발생함.
1.3 수인성 및 식품매개 감염병 집단발생 주간 현황
(33th week)
▶ 자세히 보기 : 질병관리본부 → 정책/사업 → 감염병감시 → 표본감시주간소식지
Unit: No. of cases/sentinels
Cum: Cumulative counts from 1st week to current week in a year
† According to surveillance data, the reported cases may include all of the cases such as confirmed, suspected, and asymptomatic carrier in the group. § Cum. 5-year average is mean value calculated by cumulative counts from 1st week to current week for 5 preceding years.
※ 문의: (043)719-7118, 7132
Sexually Transmitted Diseases
Gonorrhea Chlamydia Genital herpes Condyloma acuminata Current week Cum.2017 Cum. 5-year average§ Current week Cum.2017 Cum. 5-year average§ Current week Cum.2017 Cum. 5-year average§ Current week Cum.2017 Cum. 5-year average§ Total 1.3 6.7 8.1 2.4 22.8 16.9 2.1 25.0 19.0 1.5 16.0 11.3
Figure 5. Number of waterborne and foodborne disease outbreaks reported by week, 2016-2017
0 5 15 20 25 30 10 1 3 5 7 9 11 13 15 17 19 21 23 25 27 29 31 33 35 37 39 41 43 45 47 49 51 53 week
2017 2016 Average no. of cases in last 5 year(2011-2015)
35
4. Sexually Transmitted Diseases, Republic of Korea, week ending August 19, 2017 (33th week)
●2017년도 제33주 보고기관(586개) 당 클라미디아 2.4명, 성기단순포진 2.1명, 첨규콘틸롬 1.5명, 임질 1.3명 발생함.
● 제33주에 의뢰된 호흡기검체 118건 중 인플루엔자 바이러스 양성 건 없음.
2. Respiratory viruses, Republic of Korea, week ending August 19, 2017 (33th week)
● 2017년도 제33주 호흡기검체에 대한 유전자 검사결과 43.2%의 호흡기바이러스가 검출되었음.
(최근 4주 평균 150개의 호흡기검체에 대한 유전자 검사결과를 나타내고 있음)
※ 주별통계는 잠정통계이므로 변동가능
2016-2017
(week) Weeklytotal
Detection rate (%)
HAdV HPIV HRSV IFV HCoV HRV HBoV HMPV
30 36.8 2.1 6.8 0.5 1.1 0.5 24.7 0.5 0.5 31 43.1 1.4 12.5 0.0 0.7 2.1 23.6 2.1 0.7 32 45.2 5.2 12.3 0.0 0.6 0.6 25.8 0.6 0.0 33 43.2 4.2 5.9 0.8 0.0 0.8 31.4 0.0 0.0 Cum.※ 55.5 3.5 7.7 1.9 9.7 4.6 17.3 2.9 8.0 2016 Cum.∀ 59.0 6.3 6.0 4.6 15.9 5.5 15.0 1.6 4.1
- HAdV : human Adenovirus, HPIV : human Parainfluenza virus, HRSV : human Respiratory syncytial virus, IFV : Influenza virus, HCoV : human Coronavirus, HRV : human Rhinovirus, HBoV : human Bocavirus, HMPV : human Metapneumovirus
※ Cum. : the rate of detected cases between Jan. 1. 2017 – August. 19. 2017, (Average No. of detected cases is 150 in last 4 weeks) ∀ 2016 Cum. : the rate of detected cases between Dec. 27. 2015 - Dec. 31. 2016.
▶ 자세히 보기 : 질병관리본부 → 알림 → 주간 질병감시정보
Figure 6. Number of specimens positive for influenza by subtype, 2016-2017 season
0 40 20 80 60 120 140 160 180 100 200 0 20.0 10.0 40.0 30.0 60.0 70.0 80.0 90.0 50.0 100.0 36 38 40 42 44 46 48 50 52 2 4 6 8 10 12 14 16 18 20 22 24 26 28 30 32 34 No. of positives Percent positives (%) week percent positive A/H3N2 A(not subtyped) A/H1N1pdm09 B
2.2 병원체감시 : 급성설사질환 실험실 표본 주간 감시 현황
(32th week)
◆ Acute gastroenteritis-causing viruses
Week No. of sample
No. of detection (Detection rate, %)
Group A Rotavirus Norovirus Enteric Adenovirus Astrovirus Total
2017 29 85 1 (1.2) 5 (5.9) 3 (3.5) 2 (2.4) 11 (12.9)
30 79 2 (2.5) 2 (2.5) 0 (0.0) 3 (3.8) 7 (8.9)
31 89 1 (1.1) 2 (2.2) 2 (2.2) 2 (2.2) 7 (7.9)
32 52 3 (5.8) 1 (1.9) 3 (5.8) 0 (0.0) 7 (13.5)
Cum. 2,293 316 (13.8) 374 (16.3) 57 (2.5) 74 (3.2) 821 (35.8)
* The samples were collected from children < 5 years of sporadic acute gastroenteritis in Korea.
◆ Acute gastroenteritis-causing bacteria
Week SampleNo. of
No. of isolation (Isolation rate, %) Salmonella
spp.
Pathogenic
E.coli Shigella spp. V.parahaemolyticus V. choleraeCampylobacter spp. C.perfringens S. aureus B. cereus Total
2017 29 237 8 (3.38) 14 (5.91) 0 (0) 0 (0) 0 (0) 13 (5.49) 0 (0) 9 (3.80) 4 (1.69) 48 (20.25) 30 238 20 (8.40) 17 (7.14) 0 (0) 0 (0) 0 (0) 8 (3.36) 1 (0.42) 3 (1.26) 7 (2.94) 56 (23.53) 31 207 13 (6.3) 25 (12.1) 0 (0) 0 (0) 0 (0) 8 (3.9) 0 (0) 3 (1.4) 4 (1.9) 53 (25.6) 32 223 25 (11.2) 25 (11.2) 0 (0) 0 (0) 0 (0) 4 (1.8) 1 (0.5) 5 (2.2) 5 (2.2) 65 (29.1) Cum. 5,747 189 (3.3) 204 (3.5) 3 (0.1) 2 (0.03) 0 (0) 79 (1.4) 68 (1.2) 104 (1.8) 115 (2.0) 767 (13.3)
* Bacterial Pathogens ; Salmonella spp., E. coli (EHEC, ETEC, EPEC, EIEC), Shigella spp., Vibrio parahaemolyticus, Vibrio cholerae, Campylobacter spp., Clostridium perfringens, Staphylococcus aureus, Bacillus cereus, Listeria monocytogenes, Yersinia enterocolitica.
* hospital participating in Laboratory surveillance in 2016 (70 hospitals)
▶ 자세히 보기 : 질병관리본부 → 알림 → 주간 질병감시정보
▣ Detection rate of acute gastroenteritis causing virus and bacteria, Republic of Korea, week ending
August 12, 2017 (32th week)
August 12, 2017 (32th week)
● 2017년도 제 32주 실험실 표본 감시결과 엔테로바이러스 검출건수는 22건이며, 2017년도 누적 발생건수는 298건임.
◆ Aseptic meningitis
◆ HFMD and Herpangina
Figure 8. Detection rate of enterovirus in HFMD and herpangina patients from 2016 to 2017
◆ HFMD with Complications
Figure 9. Detection rate of enterovirus in HFMD with complications patients from 2016 to 2017
0 5 10 20 15 25 1 5 9 13 17 21 25 29 33 37 41 45 49 53 0 4 3 2 1 5 6 7 8 9 10 1 5 9 13 17 21 25 29 33 37 41 45 49 53
2016 Enterovirus detection rate (%) 2017 Enterovirus detection rate (%) 2016 Enterovirus detection rate (%) 2017 Enterovirus detection rate (%)
Figure 7. Detection rate of enterovirus in aseptic meningitis patients from 2016 to 2017
0 20 40 60 80 1 5 9 13 17 21 25 29 33 37 41 45 49 53
2016 Enterovirus detection rate (%) 2017 Enterovirus detection rate (%)
Detection rate (%)
Detection rate (%)
3.1 매개체감시 : 말라리아 매개모기 주간 감시현황
(32th week)
3.2 매개체감시 : 일본뇌염 매개모기 주간 감시현황
(32th week )
▣ Vector surveillance : Malaria vector mosquitoes, Republic of Korea, week ending August 12, 2017 (32th week)
●2017년도 제32주 말라리아 매개모기 수는 평균 6개체로 평년 29개체 대비 23개체(79.3%) 감소(전년 16개체 대비 10개체(62.5%) 감소) ●2017년도 제32주 전체모기 수는 평균 15개체로 평년 62개체 대비 47개체(75.8%) 감소(전년 43개체 대비 28개체(65.1%) 감소)
▣ Vector surveillance : Japanese encephalitis vector mosquitoes, Republic of Korea, week ending August 12, 2017 (32th week)
●2017년 32주 일본뇌염 매개모기 주간 발생현황
- 32주 전체모기 수 : 평균 546개체로 평년 1,074개체 대비 528개체(49.2%) 감소(전년 1,107개체 대비 561개체(50.7%) 감소)
- 32주 일본뇌염 매개모기(작은빨간집모기, C.t*) 수 : 평균 65개체로 평년 143개체 대비 78개체(54.6%) 감소(전년 25개체 대비 40개체(160%) 증가) Figure 10. Weekly incidences of malaria vector mosquitoes in 2017
Figure 11. Weekly incidences of Japanese encephalitis vector mosquitoes in 2017
14 15 16 17 18 19 20 21 22 23 24 25 26 27 28 29 30 31 32 33 34 35 36 37 38 39 40 41 42 43 44 Year 11-15 Total 2 2 3 9 13 40 156 157 256 451 601 903 1336 1675 1773 1090 11021064 1074 9371201920 816 697 446 253 185 102 32 27 11 Year 11-15 C.t* 0 0 0 0 0 0 0 0 1 1 2 5 8 34 98 61 69 191 143 159 256 137 158 159 146 63 40 15 4 2 1 2016 Total 1 2 3 6 27 76 170 104 194 244 507 575 863 978 1137 871 506 515 1107 993 983 646 458 1279 743 230 268 241 39 44 23 2016 C.t* 0 0 0 0 0 0 0 0 0 1 0 1 3 7 14 9 29 32 25 109 107 100 98 313 212 85 72 35 4 5 1 2017 Total 2 4 3 4 12 22 22 72 213 518 487 1052 1096 1211 856 705 552 452 546 2017 C.t* 0 1 1 1 0 0 0 0 1 1 1 4 8 60 28 64 75 84 65 0 0 10 200 400 600 800 1,000 1,200 1,400 1,600 1,800 20 30 40 50 60 70 2,000 No. of mosquitoes No. of mosquitoes Week Week 14 15 16 17 18 19 20 21 22 23 24 25 26 27 28 29 30 31 32 33 34 35 36 37 38 39 40 41 42 43 44 2012-2016 Total Mosquitoes(Average) 0 0 1 1 1 2 5 7 10 11 11 11 19 25 30 36 40 59 62 61 53 42 37 30 20 15 7 4 4 3 2 2012-2016 Malaria Vector Mosquitoes(Average) 0 0 0 0 0 0 0 0 0 1 2 3 8 10 12 15 16 27 29 33 31 23 22 18 10 6 3 1 0 0 0 2016 Total Mosquitoes – 0 1 1 1 2 6 12 11 14 13 10 14 20 19 21 18 29 43 46 27 30 28 23 6 6 4 6 3 3 3 2016 Malaria Vector Mosquitoes – 0 0 0 0 0 0 0 0 1 1 1 4 7 8 8 6 12 16 17 12 14 18 7 2 1 1 0 0 0 0 2017 Total Mosquitoes 0 1 1 1 1 3 4 8 8 7 8 13 14 14 19 16 17 15 15
나타내며, 「Cum. 2017」은 2017년 1주부터 해당 주까지의 누계 건수, 그리고 「5-year weekly average」는 지난 5년(2011-2015년) 해당 주의 신고건수와 이전 2주, 이후 2주의 신고건수(총 25주) 평균으로 계산된다. 그러므로 「Current week」과 「5-year weekly average」의 신고 건수를 비교하면 해당 주 단위 시점과 예년의 신고 수준을 비교해 볼 수 있다. 「Total no. of cases by year」는 지난 5년간 해당 감염병 현황을 나타내는 확정 통계이며 연도별 현황을 비교해 볼 수 있다.
예) 2017년 12주의 「5-year weekly average(5년간 주 평균)」는 2011년부터 2015년의 10주부터 14주까지의 신고 건수를 총 25주로 나눈 값으로 구해진다.
* 5-year weekly average(5년 주 평균)=(X1 + X2 + … + X25)/25
10주 11주 12주 13주 14주 2015년 해당 주 2014년 X1 X2 X3 X4 X5 2013년 X6 X7 X8 X9 X10 2012년 X11 X12 X13 X14 X15 2011년 X16 X17 X18 X19 X20 2010년 X21 X22 X23 X24 X25
<Table 2>는 17개 시·도 별로 구분한 법정감염병 보고 현황을 보여 주고 있으며, 각 감염병별로 「Cum, 5-year average」와 「Cum, 2017」을 비교해 보면 최근까지의 누적 신고건수에 대한 이전 5년 동안 해당 주까지의 평균 신고건수와 비교가 가능하다. 「Cum, 5-year average」는 지난 5년(2011-2015년) 동안의 동기간 신고 누계 평균으로 계산된다.
「주간 건강과 질병, PHWR」은 질병관리본부에서 시행되는 조사사업을 통해 생성된 감시 및 연구 자료를 기반으로 근거중심의 건강 및 질병관련 정보를 제공하고자 최선을 다할 것이며, 제공되는 정보는 질병관리본부의 특정 의사와는 무관함을 알립니다. 본 간행물에서 제공되는 감염병 통계는 「감염병의 예방 및 관리에 관한 법률」 에 의거, 국가 감염병감시체계를 통해 신고된 자료를 기반으로 집계된 것으로 집계된 당해년도 자료는 의사환자 단계에서 신고된 것이며 확진 결과시 혹은 다른 병으로 확인 될 경우 수정 될 수 있는 잠정 통계임을 알립니다. 「주간 건강과 질병, PHWR」은 질병관리본부 홈페이지를 통해 주간 단위로 게시되고 있으며, 정기적 구독을 원하시는 분은 [email protected]로 신청 가능합니다. 이메일을 통해 보내지는 본 간행물의 정기적 구독 요청시 구독자의 성명, 연락처, 직업 및 이메일 주소가 요구됨을 알려 드립니다. 「주간 건강과 질병」 발간 관련 문의: [email protected]/ 043-249-3028/3003 발간등록번호 11-1351159-000002-03 창 간 : 2008년 4월 4일 발 행 : 2017년 8월 24일 발 행 인 :정은경 편 집 인 : 박도준 편집위원 : 최영실, 김기순, 최병선, 조신형, 조성범, 김봉조, 구수경, 김용우, 이동한, 조은희, 이은규, 신영림, 김청식, 권효진, 김호용 편 집 :질병관리본부 유전체센터 의과학지식관리과 충북 청주시 흥덕구 오송읍 오송생명2로 187 오송보건의료행정타운 (우)28159