저작자표시-비영리-변경금지 2.0 대한민국 이용자는 아래의 조건을 따르는 경우에 한하여 자유롭게 l 이 저작물을 복제, 배포, 전송, 전시, 공연 및 방송할 수 있습니다. 다음과 같은 조건을 따라야 합니다: l 귀하는, 이 저작물의 재이용이나 배포의 경우, 이 저작물에 적용된 이용허락조건 을 명확하게 나타내어야 합니다. l 저작권자로부터 별도의 허가를 받으면 이러한 조건들은 적용되지 않습니다. 저작권법에 따른 이용자의 권리는 위의 내용에 의하여 영향을 받지 않습니다. 이것은 이용허락규약(Legal Code)을 이해하기 쉽게 요약한 것입니다. Disclaimer 저작자표시. 귀하는 원저작자를 표시하여야 합니다. 비영리. 귀하는 이 저작물을 영리 목적으로 이용할 수 없습니다. 변경금지. 귀하는 이 저작물을 개작, 변형 또는 가공할 수 없습니다.
Regulation of Oligodendrogenesis in a
Rat Contusive Spinal Cord Injury
Model
by
Hyuk Min Kim
Major in Neuroscience
Department of Medical Science
The Graduate School, Ajou University
Regulation of Oligodendrogenesis in a
Rat Contusive Spinal Cord Injury
Medel
by
Hyuk Min Kim
A Dissertation Submitted to The Graduate School of Ajou
University in Partial Fulfillment of the Requirements for
the Degree of
Ph. D. in Neuroscience
Supervised by
Byung Gon Kim, MD, PhD
Major in Neuroscience
Department of Medical Science
The Graduate School, Ajou University
This certifies that the dissertation
of Hyuk Min Kim is approved.
SUPERVISORY COMMITTEE
. .
Haeyoung Suh-Kim
. .
Byung Gon Kim
. .
Yong Beom Lee
. .
Myung Ae Lee
. .
Chang Hwan Park
The Graduate School, Ajou University
June, 25th, 2010
ACKNOWLEDGEMENTS
기계치였던 나는 새로운 전자제품을 사면 들어있는 사용설명서와 밤새 씨름을 하고 난 후에야 새로 산 전자제품을 사용할 수 있었습니다. 한 때 이런 생각을 했었지요. 사람마다 각자의 사용설명서가 있어서 새로운 사람을 만나게 되면 서로의 사용설명서를 교환하는 건 어떨까? 그렇다면 사람 사이에 생기는 갈등은 없을 텐데… 이런 생각의 끝에 사람 중추신경계의 사용설명서를 만들고 싶다는 생각으로 신경과학 공부를 시작했습니다. 아직은 알아야 할 것도 많고 알 수 없는 것도 많지만 차근차근 밑그림이 그려지고 있습니다. 처음 아주대학교 신경과학전공에 들어와서 다듬어 지지 않고 의욕만 앞서던 저를 학문적으로 다듬어 주시고 어우러져 사는 것에 대해서 조언해 주신 지도교수님이신 김 병곤 교수님께 다시 한번 감사의 인사를 전합니다. 또한 신경과학의 놀라운 세계에 대해서 눈뜨게 하고 많은 가르침을 주신 아주대학교 신경과학전공의 많은 교수님들 감사드립니다. 힘들 때 위로가 되어주고 실험에 대해서 함께 토론하며 우정과 각자의 상아탑을 나누었던 친구 동훈아! 니가 있어서 행복했다. 지금은 멀리 광활한 Alabama 에서 열심히 생활하고 있을 친구 근우야! 몸만 광활해지지 말고… 함께했던 추억이 너무 많은 석순, 두순이형, 정훈이형, 경진, 범수, 광수, 향란, 종현이가 함께 있어서 행복했습니다. 실험실 후배들 민정, 준영, 혜영이게 좋은 선배였는지 모르겠지만 좋은 선배이고 싶었다는 점 잊지 말아 주기 바란다. 항상 믿어주시고 지쳐봐 주신 부모님과 형, 형수님, 감사하다는 말로는 다 할 수 없을 만큼 사랑합니다. 이제 첫 번째 문을 열었으니 다시 한번 크게 심호흡하고 열심히 노력해서 사용설명서를 그려보겠습니다.i
- ABSTRACT –
Regulation of Oligodendrogenesis in a Rat Spinal Cord Injury
Model
Loss of oligodendrocytes (OLs) and ensuing demyelination significantly hamper functional recovery following traumatic spinal cord injury (SCI). Although proliferating glial progenitor cells (GPCs) are present in the lesioned spinal cord, spontaneous remyelination is extremely limited. The failure of remyelination after SCI may be due to inadequate signaling to generate sufficient OLs from GPCs. In this thesis research, I tested a hypothesis that manipulation of post-injury microenvironment or intrinsic transcriptional machinery could enhance the extent of oligodendrogenesis in the lesioned spinal cord. Specifically, ex vivo delivery of vascular endothelial growth factor (VEGF) was employed to increase oligodendrogenesis in rat spinal cord contusion model. I also delivered Olig genes to the proliferating GPCs to examine if activation of transcription factors which are required for proper development oligodendrocytes can promote oligodendrogenesis in injured adult spinal cord.
VEGF exerts various trophic effects for neural cells including neural stem and/or progenitors in addition to stimulating angiogenesis. The first part of my thesis study delivered VEGF gene carried by immortalized human neural stem cells one week after contusion injury and examined whether the ex vivo VEGF delivery promoted the proliferation and differentiation of GPCs. The ex vivo approach resulted in a marked
ii
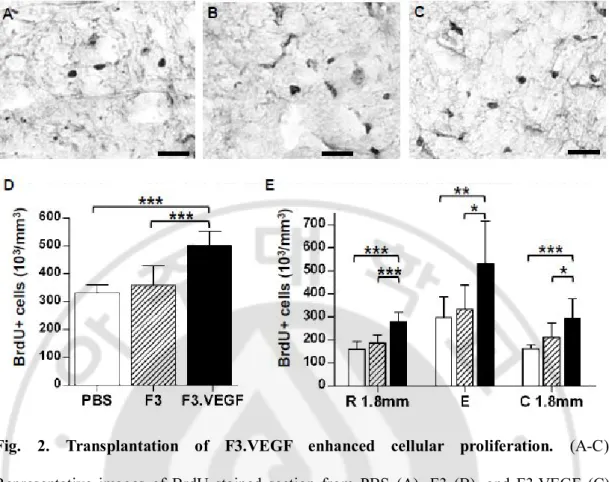
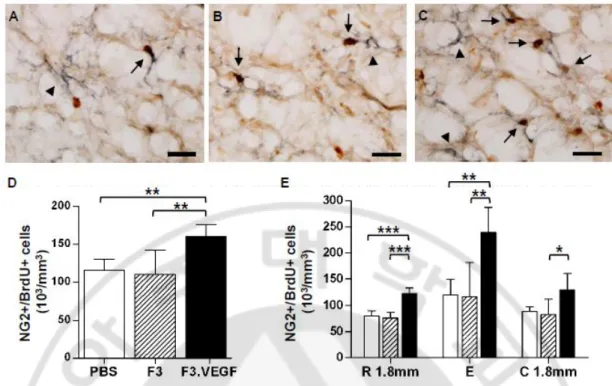
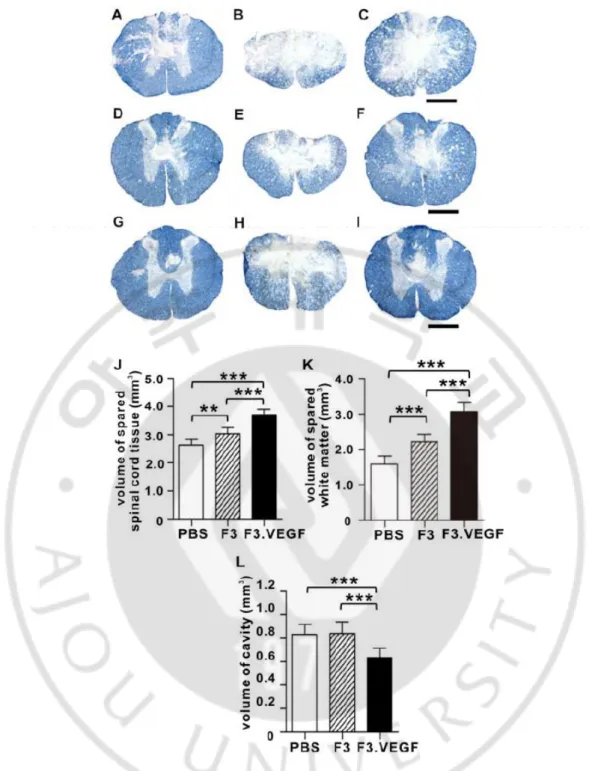
elevation of VEGF in the injured spinal cord tissue and a concomitant increase in phosphorylation of VEGF receptor flk-1. Stereological counting of BrdU+ cells revealed that the ex vivo VEGF delivery significantly enhanced cellular proliferation at 2 weeks after SCI. The number of proliferating NG2+ glial progenitor cells (NG2+/BrdU+) was also increased. Furthermore, the VEGF delivery increased the number of early proliferating cells that differentiated into mature oligodendrocytes, but not astrocytes, at 6 weeks after SCI. F3.VEGF treatment also increased the density of blood vessels in the injured spinal cord and enhanced tissue sparing. These anatomical results were accompanied by improved BBB locomotor scores, suggesting that VEGF can be used as an effective therapeutic reagent to improve functional outcomes after SCI.
The second part of my thesis research was to test a hypothesis that introduction of
Olig genes into proliferating GPCs could increase the OL generation after SCI. To deliver Olig genes selectively to proliferating cells, recombinant retroviruses encoding Olig1 or Olig2 with enhanced green fluorescent proteins (eGFPs) were directly injected into the
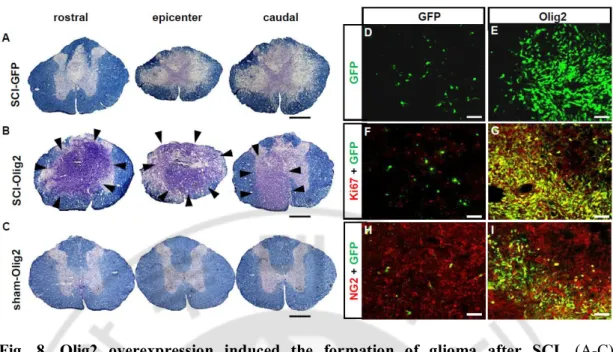
injured rat spinal cord immediately after contusive injury. Surprisingly, introduction of Olig2 led to a marked hyperplasia of GFP+ cells at 1 week after SCI. Fluorescence activated cell sorting and subsequent culture of GFP+ cells revealed Olig2-induced tumorous transformation of GPCs. In contrast, Olig1 did not alter the number of GFP+ proliferating cells. Simultaneous introduction of Olig1 and 2 (Olig1/2) led to a more than two-fold increase in the number of GFP+ cells without tumor formation. Olig1/2 significantly increased the proportion of NG2+ GPCs and CC1+ mature oligodendrocytes compared to GFP only or Olig1-GFP retrovirus injection groups, and this was accompanied by an increase in the expression of myelin proteins. Introduction of Olig1/2 enhanced the
iii
expression of transcription factors involved in diverse stages of oligodendrocyte development, especially Sox10 that drives terminal OL differentiation. Finally, retroviral introduction of Olig1/2 significantly improved a quality of hindlimbs locomotion and increased the total number of oligodendrocytes at 6 weeks after SCI. Simultaneous activation of both Olig1 and Olig2 genes may be highly beneficial for SCI by both enhancing oligodendrocytic differentiation (and/or specification) and increasing the proliferation of glial progenitor cells.
In the last part, I explored the mechanism by which Olig genes regulates glioma formation which was unexpectedly observed during the second part of thesis research. Introduction of Olig2 gene into proliferating GPCs induced dramatic and transplantation of GPCs transduced with Olig2 into the brains of nude mice resulted in brain tumor, supporting a notion that overactivation of Olig2 gene carries a risk of tumor formation. Combined introduction of Olig1 with Olig2 (Olig1/2) prevented Olig2-induced hyperplasia of GPCs. I found that p21, a tumor suppressor and inhibitor of stem cell proliferation, was directly repressed by Olig2. However, p21 protein level was not decreased by Olig1/2. The Olig genes regulated p21 expression by altering transcriptional activity on the p21 promoter site.
In the present thesis research, I demonstrated that manipulation of microenvironment or activating intrinsic transcriptional machinery can promote endogenous oligodendrogenesis following SCI. The results indicated that providing VEGF to the lesioned spinal cord can increase the GPC proliferation and the number of newly born oligodendrocytes. Furthermore, activation of both Olig1 and Olig2 transcription factors in proliferating GPCs may enhance the GPC proliferation and their differentiation into mature OLs. I also found that activation of Olig2 alone may lead to a formation of glioma by a
p21-iv
dependent mechanism. These studies suggest that endogenous oligodendrogenesis can be stimulated in the lesioned spinal cord and may be utilized as a therapeutic intervention to improve functional outcome after SCI.
Keywords: spinal cord injury (SCI), remyelination, vascular endothelial growth factor (VEGF), immortalized human NSC line (F3 cells), Transplantation, glial progenitor cells (GPCs), BrdU, Oligodendrocyte, Retrovirus, Olig1, Olig2, oligodendrogenesis, NG2, APC-CC1.
v
TABLE OF CONTENTS
ABSTRACT ··· i TABLE OF CONTENTS ··· v LIST OF FIGURES ··· ix LIST OF ABBREVIATION ··· xi I. INTRODUCTION ··· 1II. MATERIALS AND METHODS ··· 7
Part A. Ex vivo VEGF delivery following contusion spinal cord injury ··· 7
1. Preparation of VEGF overexpressing human NSCs ··· 7
2. Animals and surgical procedures ··· 7
3. Bromodeoxyuridine (BrdU) injection ··· 8
4. Western blot analysis and ELISA ··· 8
5. Tissue processing and immunohistochemistry ··· 9
6. Stereological cell counts ··· 11
7. Quantification of spinal cord tissue volume and microvessel density ··· 12
8. Analysis of locomotor behavior ··· 13
9. Statistical analysis ··· 13
Part B. Regulation of GPCs by Olig genes following contusion spinal cord injury ··· 13
1. Production of recombinant retroviruses ··· 14
2. Animals and surgical procedures ··· 14
3. Western blot analysis ··· 15
vi
5. Isolation of GFP+ cells by Fluorescence Activated Cell Sorting (FACS)
and cell culture ··· 16
6. Soft agar colony forming assay ··· 17
7. Primary glial progenitor cell (GPC) culture and retroviral infection ··· 18
8. Phenotype of spinal cord tissue ··· 19
9. Stereological cell counts ··· 19
10. To compare the coexpression of various marker in GFP+ cells ··· 20
11. Basso, Beattie, and Bresnahan (BBB) open field task ··· 20
12. CatWalk gait assessment ··· 21
13. Statistical analysis ··· 21
Part C. Mechanisms in the regulation of the glioma formation by Olig genes ··· 22
1. Production of recombinant retroviruses ··· 22
2. Primary glial progenitor cell (GPC) culture and retroviral infection ··· 22
3. Isolation of GFP+ cells by Fluorescence Activated Cell Sorting (FACS) and cell culture ··· 23
4. Soft agar colony forming assay ··· 24
5. Western blot analysis ··· 25
6. Plasmid construction ··· 25
7. Luciferase assays and 293 cell transfections ··· 26
8. Nude mice xenograft experiments ··· 26
9. Tissue processing and Cresyl Violet stain ··· 27
10. Statistical analysis ··· 27
vii
Part A. Ex vivo VEGF delivery following contusion spinal cord injury ··· 29
1.
Ex vivo VEGF delivery to the injured spinal cord using immortalized
human NSCs
··· 292.
Proliferation of glial progenitor cells by F3.VEGF grafts
··· 323. Long-term fate of early proliferating glial progenitor cells ··· 36
4. F3.VEGF grafts enhance angiogenesis, tissue sparing, and functional recovery ··· 38
Part B. Regulation of GPCs by Olig genes following contusion spinal cord injury ··· 46
1.
Introduction of Olig2-expressing retrovirus after contusive SCI induced
tumor formation
··· 462.
Effects of Olig genes on proliferation of GPCs
··· 523.
Influence of Olig gene overexpression on OL differentiation
··· 554.
Alteration of transcription factor expression by Olig genes
··· 615.
Olig1/2 overexpression improve functional outcome
··· 67Part C. Mechanisms in the regulation of the glioma formation by Olig genes ··· 72
1. Olig genes regulate timorous transformation of GPC in vitro and in vivo ··· 72
2. Olig genes regulate expression of tumor suppressor p21··· 76
IV. DISCUSSION ··· 80
Part A. Ex vivo VEGF delivery following contusion spinal cord injury ··· 80
Part B. Regulation of GPCs by Olig genes following contusion spinal cord injury ··· 84
Part C. Mechanisms in the regulation of the glioma formation by Olig genes ··· 88
viii
REFERENCES ··· 93 국문요약 ··· 112
ix
LIST OF FIGURES
Fig. 1. Ex vivo delivery of VEGF carried by human neural stem cells (NSCs) to the
injured spinal cord. ··· 30
Fig. 2. Transplantation of F3.VEGF enhanced cellular proliferation. ··· 34
Fig. 3. Proliferation of NG2+ glial progenitor cells. ··· 35
Fig. 4. Long term fate of early proliferating glial progenitor cells. ··· 37
Fig. 5. promotion of angiogenesis by transplantation of F3.VEGF. ··· 39
Fig. 6. Sparing of spinal cord tissue at 6 weeksafter injury. ··· 42
Fig. 7. Locomotor recovery assessed by Basso, Beattie, and Bresnahan (BBB) test. ··· 45
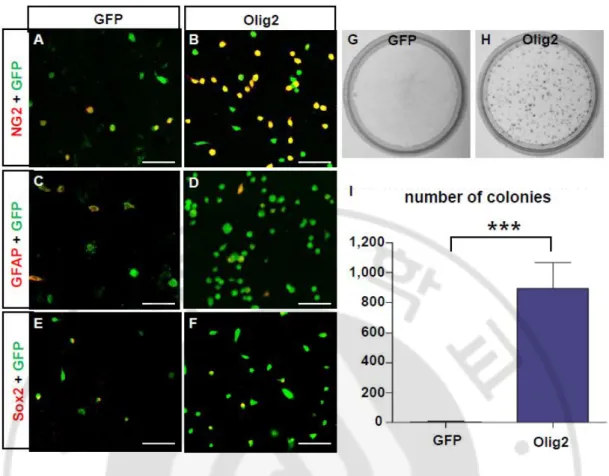
Fig.8. Olig2 overexpression induced the formation of glioma after SCI. ··· 48
Fig. 9. GFP+ cells in Olig2 group is oligdendrocyte lineage cell. ··· 49
Fig. 10. Olig2 overexpression is lead to glioma formation in vitro. ··· 51
Fig. 11. Introduction of olig genes enhanced cellular proliferation. ··· 53
Fig. 12. Differentiation of oligodendrocyte lineage cells by Olig genes. ··· 56
Fig. 13. Olig1/2 enhanced differentiation for oligodendrocyte lineage cells. ··· 59
Fig. 14. Olig1/2 increased expression of oligodendrocyte lineage specific transcription factors in cultured GPCs. ··· 63
Fig. 15. Expression of oligodendrocyte lineage transcription factors by olig1/2 after SCI. ··· 65 Fig. 16. Expression of oligodendrocyte late differentiation transcription factor, Sox10.
x
··· 66
Fig. 17. Olig1/2 improves locomotor recovery. ··· 69
Fig. 18. Olig1/2 increased mature oligodendrocyte. ··· 71
Fig. 19. The clonogenic efficiency of Olig genes-infected GPCs. ··· 74
Fig. 20. Nude mice bearing established GPCs xenograft with infected Olig2 retroviruses ··· 75
Fig. 21. Olig1 and Olig2 regulated the levels of p21. ··· 78
xi
LIST OF ABBREVIATION
BBB, Basso, Beattie, and Bresnahan BDNF, Brain-derived neurotrophic factor bFGF, basic fibroblast growth factor bHLH, basic Helix-Loop-Helix BrdU, Bromodeoxyuridine BSA, Bovine serum albumin cfu, colony forming unit CNS, Central nervous system CNTF, Ciliary neurotrophic factor DAB, diaminobenzidine
DAPI, 4’,6-diamidino-2-phenylindole
DMEM, Dulbecco’s Modified Eagle Medium eGFPs, enhanced green fluorescent proteins ELISA, Enzyme-linked immunosorbent assay FACS, Fluorescence Activated Cell Sorting FBS, Fetal Bovine Serum
GM, Grey Matter
GPCs, glial progenitor cells
HBSS, Hank’s Buffered Salt Solution hMito, human mitochondria
xii
IRES, internal ribosome entry site MBP, myelin basic protein NGF, Nerve growth factor NSCs, neural stem cells
OL, Oligodendrocyte lineage cells OPCs, oligodendrocyte progenitor cells PDGF, platelet derived growth factor
PDGFRα, platelet derived growth factor receptor α PLP, proteolipid protein
PVDF, Polyvinylidene fluoride SCI, spinal cord injury
SDS-PAGE, sodium dodecyl sulfate-polyacrylamide gel electrophoresis TBS, Tris bufferd saline
T3, triiodothyronine
VEGF, vascular endothelial growth factor vWF, von Willebrand factor
1
I. INTRODUCTION
After a traumatic injury to the spinal cord, tissue damage and cavity formation occurs at the epicenter and spreads rostrally and caudally over time. This evolving lesion is accompanied by prevalent oligodendrocyte (OL) apoptosis and loss of myelin around surviving axons (Crowe et al., 1997; Totoiu and Keirstead, 2005; Li et al., 2007). Demyelination of otherwise intact axons can lead to a conduction failure and may contribute to the functional deficits observed after spinal cord injury (SCI) (Shi and Blight, 1996; Cao et al., 2005; Keirstead et al., 2005). Thus, preventing progression of the demyelination and promoting the remyelination is considered to be one of the desired therapeutic goals to improve functional recovery after SCI (Horner and Gage, 2000; Dobkin and Havton, 2004; Franklin and Ffrench-Constant, 2008). Remyelination is the process by which new myelin sheath are restored to demylinated axons, enabling them to regain the ability to carry action potentials by salutatory conduction and to recover lost function (Smith et al., 1979; Jeffery and Blakemore, 1997). Even after severe contusion SCI, demyelinated axons persist in the subpial rim of white matter in both humans (Bunge et al., 1993; Guest et al., 2005) and experimental animals (Blight, 1993; Cao et al., 2005; Totoiu and Keirstead, 2005). In addition, glial progenitor cells (GPCs) which possess a potential to become oligodendrocytes exist in the adult spinal cord and proliferate in response to SCI (Horner et al., 2000; McTigue et al., 2001; Zai and Wrathall, 2005; Horky et al., 2006). Although some remyelination by endogenous OLs and invading peripheral Schwann cells occurs (Dusart et al., 1992; McTigue et al., 2001; Tripathi and McTigue, 2007). However, spontaneous remyelination is
2
limited and incomplete. The failure of spontaneous remyelination may be due to inadequate signaling to generate sufficient number of mature OLs from proliferating GPCs (Talbott et al., 2005; Cheng et al., 2007).
OLs are nondividing cells that develop from proliferating, migratory progenitor cells. The number of OLs in lesion region of injured spinal cord, in principle, will depend upon: (1) the quantity of oligodendrocyte progenitor cells (OPCs) that migrate into the lesion region; (2) the replicative potential of the resident OPCs prior to entering into the differentiation pathway; (3) the quantity of cell loss occurring during cellular development. Many studies over the past two decades have examined the processes affecting OLs survival, migration, proliferation and differentiation. It is now appreciated that these cellular decisions are determined by a combination of both cell-extrinsic and –intrinsic factors mediated through the interaction of an ever increasing number of effectors (Raff et al., 1998). Survival, migration, proliferation, and differentiation of oligodendrocytes are regulated by numerous cell-extrinsic molecules. These include growth factors (PDGF, bFGF, BDNF, CNTF, NGF), cytokines (IGF-1, NT-3), hormones (thyroid hormone, glucocorticoid, progesterone), and neurotransmitters (glutamate) that are secreted by neighboring cells and that act in concert to shape normal brain development (Dreyfus, 1998). A variety of extracellular factors may be added to cultures to influence survival, growth, and development of OPCs in vitro. In addition to the extracellular factors, oligodendrocyte development is affected also by intrinsic cellular factors. The transition of an OPC to a mature oligodendrocyte depends on complex factors involving the coordinated expression of particular genes and transcription factors, many of which are oligodendrocyte / myelin specific (Durand and Raff, 2000; Lee et al., 2009). Therefore, it could be conceived that both extracellular and intrinsic factors which
3
are important for OL development may have a role in determining the number of OLs in the lesioned spinal cord.
Multiple cell types have been grafted into the demyelinatited spinal cord and remyelinate the demyelinated axons to varying degrees (Cao et al., 2002; Kocsis et al., 2004; Reier, 2004). Neural stem cells (NSCs) and GPCs have the potential to differentiate into OLs
in vitro and in vivo. However, multipotent NSCs mainly differentiate into astrocytes after
transplantation into the injured spinal cord (Chow et al., 2000; Cao et al., 2001). OPCs may be optimal cell grafts because of their potential for more extensive remyelination and their lack of differentiation into astrocytes after transplantation. OPC transplantation is an effective strategy for OL replacement and remyelination after traumatic SCI (Cao et al., 2005; Keirstead et al., 2005). However, cell transplantation studies have demonstrated that exogenous GPCs, which retain strong oligodendrogenic activities in vitro, differentiate only very poorly when grafted into the injured spinal cord (Han et al., 2004; Hill et al., 2004). Thus, the environment of the injured spinal cord appears to be highly restrictive for differentiation of GPCs. If this environmental restriction can be relieved by certain manipulations, endogenous GPCs may be able to supply new oligodendrocyte.
Endogenous stem or progenitor cells that can differentiate into neurons and glial cells are also present in adult spinal cord (Weiss et al., 1996). The progenitors in glial lineage are stimulated to proliferate in response to SCI (McTigue et al., 2001; Zai and Wrathall, 2005; Yang et al., 2006; Tripathi and McTigue, 2007). Proliferating glial progenitors are persistently found until several weeks after injury (McTigue et al., 2001), and they are believed to differentiate into mature glial cells, eventually replacing the lost oligodendrocytes and astrocytes (Yang et al., 2006). These findings suggest a promising
4
possibility that mobilization of endogenous glial progenitors can provide a therapeutic opportunity to repair the white matter damaged by traumatic SCI. The adult CNS contains a significant number of OPCs (Wolswijk and Noble, 1989; Chang et al., 2000; Horner et al., 2000). Although the turnover of these cells is relatively low under normal conditions, their proliferation increases significantly after SCI (Ishii et al., 2001; McTigue et al., 2001), but spontaneous remyelination is limited and incomplete after SCI.
The present thesis tested a hypothesis that manipulation of post-injury microenvironment or intrinsic transcriptional machinery could promote the endogenous oligodendrogenesis and ultimately improve functional outcome after SCI. In the first part, vascular endothelial growth factor (VEGF) was chosen as an extracellular factor to promote oligodendrogenesis.
VEGF was originally characterized as a potent stimulator of angiogenesis. Later, multifaceted trophic effects of VEGF have been uncovered in nervous tissue (Rosenstein and Krum, 2004). VEGF provides direct protective effects on neurons (Jin et al., 2000; Matsuzaki et al., 2001) and enhances neurite outgrowth (Khaibullina et al., 2004). It also supports survival and proliferation of various glial cells (Sondell et al., 1999; Mani et al., 2005). The neuroprotective effects of VEGF as well as the angiogenic activity led to improved functional outcomes in animal models of traumatic spinal cord injury and other neurological disorders (Sun et al., 2003; Widenfalk et al., 2003; Storkebaum et al., 2005). Recently, the versatile actions of VEGF has been expanded to stimulating proliferation of endogenous neural stem or progenitor cells, and VEGF was shown to increase endogenous neurogenesis after stroke (Jin et al., 2002; Sun et al., 2003). Potential effects of VEGF on the glial progenitor cells in the spinal cord after injury have not been investigated yet. In the first
5
part of the thesis research, VEGF gene was incorporated into immortalized human neural stem cells and the VEGF overexpressing human neural stem cells were transplanted into the injured spinal cord to achieve a stable and robust expression. Proliferation and differentiation of GPCs and OLs were examined to test if the ex vivo VEGF delivery promoted endogenous oligodendrogenesis.
In the second part of thesis, I examined whether introduction of Olig genes, critical regulators of OL development, can affect endogenous oligodendrogenesis after contusive SCI in rats.
Transcriptional regulation plays an important role in the differentiation of oligodendrocyte lineage cells from initial GPCs to fully mature myelinating oligodendrocytes (Dugas et al., 2006; Nicolay et al., 2007). A pair of closely related basic helix-loop-helix (bHLH) transcription factors Olig1 and Olig2 were identified and shown to be essential for generating oligodendrocyte lineage cells during development (Lu et al., 2000; Zhou et al., 2000; Zhou and Anderson, 2002). Following studies have further shown that both Olig1 and Olig2 in collaboration with other transcription factors play important roles in diverse stages of OL differentiation and maturation (Fu et al., 2002; Cheng et al., 2007; Li et al., 2007; Liu et al., 2007). Given these crucial roles of Olig transcription factors, regulating Olig gene expression in post-injury GPCs could be justified as a rational therapeutic approach to promote the oligodendrogenesis and remyelination after SCI.
Potential functions of Olig1 and Olig2 transcription factor in injured CNS have not been fully studied. Olig1 was required in the remyelination process after demyelinated lesions in mature CNS (Arnett et al., 2004). More recent studies showed the implication of Olig2 transcription factor in the maintain and differentiation of neural and/or glial
6
progenitors after injury (Buffo et al., 2005; Lee et al., 2005; Chen et al., 2008). Although more works need to be done, it seems quite apparent that Olig1 and Olig2 have distinct biological properties that could be separable from those of each other after injury as well as during development (Arnett et al., 2004; Buffo et al., 2005; Jakovcevski and Zecevic, 2005; Xin et al., 2005). In this part of thesis research, therefore, Olig1 and Olig2 genes were separately introduced into proliferating glial progenitor cells, and the results showed that these two genes exerts differential influence on the behavior of GPCs and OLs. Olig1 and olig2 genes were introduced also in combination to find any cooperative effects of these genes.
During the course of experiments in which Olig2 gene was introduced into proliferating GPCs following SCI, glioma formation was unexpectedly observed in the spinal cord. Any kind of strategies to activate Olig transcriptional activity to enhance endogenous oligodendrogenesis may lead to unwanted tumor formation. Several lines of evidence suggest that activity of Olig2 might provide a mechanistic link between growth of malignant glioma. Exposure to glioma-relevant mitogens such as EGF or PDGF (Jackson et al., 2006) stimulates proliferation of Olig2+ rapidly dividing “type C” transit-amplifying cells and glioma-like growths. The other studies have shown that all malignant gliomas, irrespective of grade, express Olig2 in at least some fraction of the malignant cell population (Marie et al., 2001; Ligon et al., 2004). Olig2-regulated lineage-restricted pathway critical for proliferation of normal and tumorigenic CNS stem cells (Ligon et al., 2007).
In the third part of thesis, therefore I studied the detailed mechanism of tumor regulation by Olig genes.
7
II. MATERIALS AND METHODS
Part A. Ex vivo VEGF delivery following contusion spinal cord injury
1. Preparation of VEGF overexpressing human NSCs
Telecephalon tissue from a 15 weeks gestational human fetal brain was utilized to generate primary cell culture from which immortalized cell lines of human NSCs (F3 line) were generated using a retroviral vector encoding v-myc oncogene. The permission to use the fetal tissues was granted by the Clinical Research Screening Committee involving human Subjects of the University of British Columbia, and the fetal tissues were obtained from the Anatomical Pathology Department of Vancouver General Hospital. PG13 mouse packaging cell line was transfected with plasmid pLPCX-VEGF vector containing the full length human VEGF cDNA, using Lipofectamine 2000 (Invitrogen, Carlsbed, CA), and stable PG13 cell line was selected using 10 ug/ml puromycin for 3 days. Replication incompetent retroviral vector which was collected from PG13.VEGF cells was used for transfection of F3 human NSCs. Puromycin-resistant VEGF clones were screened and isolated, and one of the clones (F3.VEGF line) was expanded and used for the transplantation (Lee et al., 2007).
2. Animals and surgical procedures
Adult Sprague-Dawley female rats, weighing 200-250 mg, were used in this study. Animal handling and surgical protocols followed the regulations set the Ajou University Institutional Animal Care and Use Committee. After anesthetization with chloral hydrate
8
(400 mg/kg, i.p.), animals received a dorsal laminectomy at the ninth thoracic vertebral level (T9) to expose the spinal cord, and then were subjected to mechanical impact with 180 kdyn force using the Infinite Horizon impactor (Precision System and Instrumentation, Lexington, KY). Seven days after injury, rats were randomly classified into three groups, and each group received injections of PBS, F3, and F3.VEGF cells, respectively. A total of 2x10⁵ cells, divided in two dosages, were transplanted into injured spinal cord. Each injections was made at 2 mm rostral and 2 mm caudal from the lesion epicenter, respectively, at a depth of 1.2 mm. At each site, 2 ul of cell suspension containing 105 NSCs or vehicle was injected through a glass micropipette with a tip diameter of less than 60 um at a rate of 0.4 ul/min. All animals received daily interperitoneal cyclosporine (Sandimmun; Novartis, Bern, Switzerland) at a dosage of 10 mg/kg beginning from one day prior to transplantation to three weeks after transplantation. After that, cyclosporine was administered through dirinking water (50 ug/ml) until sacrifice.
3. Bromodeoxyuridine (BrdU) injection
Cellular proliferation was examined using BrdU (Sigma, St.Louis, MO). To study the extent of cellular proliferation within 7 days after transplantation, animals were interperitoneally injected with BrdU (50 mg/kg) for three consecutive days (4th, 5th, and 6th day), and then sacrificed the day after the last injection. To examine phenotypic fate of early proliferating cells, animals were injected with BrdU and were allowed to survive until the 35th day after transplantation, and then were sacrificed for histological analysis.
9
Spinal cord tissue spanning ± 5 mm from the epicenter were dissected and homogenized in ice-cold lysis buffer containing the followings: 20 mM Tris-HCl (pH 7.5), 1 mM EDTA, 5 mM MgCl2, 1mM dithiothreitol, 0.1 mM phenylmethylsulfonyl fluoride, and protease inhibitor cocktail (Pierce, Rockford, IL). The tissue homogenate was centrifuged of 4℃ and 14,000 rpm for 20 min, and protein concentration of the supernatant was measured using Bradford assay. Equal amounts of proteins were resolved by SDS-PAGE and transferred to a PVDF membrane (Millipore, Bedford, MA). The membrane was blocked in Tris buffered saline (TBS) containing 5.0% BSA and probed with the rabbit anti-flk-1 (1:2000; Thermo Scientific, Fremont, CA) and rabbit anti-phospho-flk-1 (1:2000; Millipore, Billerica, MA). After washing, the membranes were incubated for 1 hr at room temperature with secondary antibodies (1:2000; Amersham Biosciences, Arlington Heights, IL). Finally, the blots were developed with enhanced chemiluminescence detection reagents (Amersham Biosciences, Arlington Heights, IL). The blots were reprobed with antibodies against mouse anti-β actin (1:5000; Abcam, Cambridge, UK). Concentration of VEGF protein in injured spinal cord tissue was measured using ELISA (R&D systems, Minneapolis, MN) following an instruction manual provided by the manufacturer.
5. Tissue processing and immunohistochemistry
Animals were deeply anesthetized with chloral hydrate and perfused intracardially with PBS, followed by 4.0% paraformaldehyde in 0.1 M phosphate buffer, pH 7.4. Spinal cords were removed and post-fixed in 4.0% paraformaldehyde for 2 hrs, followed by immersion into a graded series of sucrose solution.Cryosections of spinal cord were made transversely (section thickness 20 um) in a 1:10 series, and mounted onto SuperFrost Plus
10
slides (Fisher Scientific, Pittsburgh, PA). For BrdU immunohistochemistry, transverse spinal cord sections were treated with 10% hydrogen peroxide to quench endogenous peroxidase activity, followed by incubation in 1 N HCl at 37 ℃ for 30 min. After thorough rinsing and blocking, tissue sections were incubated with rat polyclonal anti-BrdU (1:500; Serotec, Oxford, UK) at 37uC for 1 hour in a humid chamber. Tissue sections were rinsed and incubated with biotinylated horse anti-rat IgG secondary antibody, and the antigen-antibody reaction was visualized by Vectastain Elite ABC kit (Vector Laboratories, Burlingame, CA) with diaminobenzidine (DAB) substrate (Sigma-Aldrich, St. Louis, MO). For double-labeling with anti-BrdU and various cellular markers, transverse spinal cord sections were processed for BrdU staining as above and then extensively rinsed in PBS-T. Sections were blocked with the Avidin/Biotin blocking Kit (Vector Laboratories, Burlingame, CA) and incubated overnight with the second primary antibodies. After incubation with appropriate biotinylated secondary antibodies, sections were further processed using Vectastain Elite ABC kit with Vector SG peroxidase substrate kit (Vector Laboratories, Burlingame, CA). Development of antigen-antibody reactions with DAB substrate resulted in brown colored precipitates, whereas SG substrate yields bluish color, thus making it possible to identify two different cellular markers in the same section. For immunofluorescence staining, sections were incubated overnight with primary antibodies at 4 ℃ or for 2 hrs at room temperature, followed by appropriate secondary antibodies tagged with Alexa Fluor 488 or Alexa Fluor 594 (Molecular Probes, Eugene, OR) for 45 min at room temperature. I used polyclonal NG2 antibody (1:2000; Millipore, Bedford, MA) as a marker for oligodendrocyte progenitors, monoclonal CC1 antibody (1:100; Calbiochem, La Jolla, CA) which recognizes adenomatous polyposis coli protein in cell bodies of mature oligodendrocyte without
11
labeling of oligodendrocytic processes (Bhat et al., 1996; Rabchevsky et al., 2007), and polyclonal GFAP antibody (1:500; Dako, Carpinteria, CA) for mature astrocytes. Primary antibodies were anti-BrdU, anti-GFAP, anti-CC1, monoclonal anti-human specific mitochondria (1:500; Chemicon, Temecula, CA), anti-NeuN (1:500; Chemicon, Temecula, CA), anti-MAP2 (1:500; Chemicon, Temecula, CA), and polyclonal anti-von Willebrand Factor (vWF) (1:250, Chemicon, Temecula, CA) which recognizes endothelial cells that produce vWF proteins.
6. Stereological cell counts
The number of cells of interest was quantified using the unbiased stereological estimation, based on the optical fractionators method (West et al., 1991). The Computer-Assisted Stereological Toolbox system, version 2.1.4 (Olympus, Ballerup, Denmark) equipped with an Olympus BX51 microscope, a motorized microscope stage (Prior Scientific, Rockland, MA) run by an IBM-compatible computer, and a microcastor (ND 281B, Heidenhain, Traunreut, Germany) connected to the stage and feeding the computer with the distance information in the z-axis was used. Using the injury epicenter as a point of reference, every third section extending rostral and caudal to the epicenter (sections spaced 200 um apart) was sampled so that measurements spanned a total of 6 mm (11 sections per animal, including the epicenter). The injured spinal cord was delineated at a 1.256 objective and generated counting grid of 300x300 um. An unbiased counting frame of known area superimposed on the image was placed randomly on the first counting area and systemically moved through all counting areas until the entire delineated area was sampled. Actual counting was performed using a 100x oil objective. The total number of cells was divided by
12
spared tissue volume measured as described below to obtain the number of cells per 1 mm3 of spared tissue. Since the volume of spared spinal cord tissue was different between the groups, all the comparisons of the cell numbers between different groups were based on the density (i.e. the number of cells per 1 mm3 of spared spinal cord tissue) rather than absolute number. The number of cells at different regions from the epicenter was counted at the corresponding sections, and then was divided by the subvolume of the corresponding regions.
7. Quantification of spinal cord tissue volume and microvessel density
To quantify the amount of white matter spared after SCI, sections surrounding the injury epicenter were stained with myelin specific eriochrome-cyanine RC (Rabchevsky et al., 2000). Digitized photographs of the stained sections were taken using Olympus DP71 microscopy camera (Olympus, Ballerup, Denmark). The volume of spared spinal cord tissue was analyzed by the method of Cavalieri’s principle (Gundersen and Andreassen, 1998). The total cross-sectional areas of the spinal cord and the areas of cavity were stereologically measured using the Castor system. The areas of spared tissue were calculated by subtracting the cavity areas from the total cross sectional areas. The individual subvolumes of spared spinal cord tissue were obtained by multiplying the cross-sectional areas of spared tissue by the distance between sections, and the subvolumes were added to obtain the total volume of spared spinal cord tissue. Endothelial cell marker vWF stained sections were scanned at low power to determine the areas of highest vascular density. Within this region, 3 rectangular fields of interest were randomly selected at 20x objective lens. The areas occupied by vWF positive microvessels were measured using the publically available image J software (http://rsb.info.nih.gov/ij/index.html), and were divided by the total areas of the
13
corresponding fields to obtain the density of microvessels in the injured spinal cord tissue.
8. Analysis of locomotor behavior
The recovery of gross overground locomotion was evaluated within 24 hrs after an initial injury, within 24 hrs after transplantation or vehicle injection and once a week thereafter using the Basso, Beattie, and Bresnahan (BBB) open field locomotor test (Basso et al., 1995). After transplantation, animals were assigned a randomized code to ensure blind evaluation of locomotor performance (PBS n=8, F3 n=8, F3.VEGF n=8). BBB score was determined 7 times; within 24 hrs after an initial injury, within 24 hrs after transplantation or vehicle injection, and then once a week until 6 weeks after injury. Its scale ranges from 0 to 21, with 0 given to animals with no observable hind-limb movement and 21 given to animals with completely normal open field locomotor function.
9. Statistical analysis
All statistical analyses were performed using the PRISM 4.0 statistical software package (Graphpad, Inc., San Diego, CA). Differences among experimental groups were evaluated by a one-way ANOVA followed by a Tukey’s post hoc analysis. Repeated measures two-way ANOVA was used to compare matched data at multiple time points. Significance for all statistical analysis was set at p<0.05. Error bars in all graphs depict SD of measured variables.
14
1. Production of recombinant retroviruses
Recombinant retroviruses pIRES-eGFP, which are designed to express enhanced green fluorescent protein (eGFP) as a marker for infected cells, were described previously. pOlig1-IRES-eGFP, pOlig2-IRES-eGFP, and pOlig1/2-IRES-eGFP were constructed by inserting the full-length cDNA for mouse olig1 and olig2 (Takebayashi et al., 2000) into the pIRES-eGPF vector. For the production of retroviruses, the plasmids were introduced into the retrovirus packaging cell line 293gpg by transient transfection with Lipofectamine 2000 (Invitrogen, Carlsbad, CA). After 72 hours, supernatant fractions were harvested and maintained at -72℃ until use. Viral titers were adjusted to 1X10⁹ cfu/ml.
2. Animals and surgical procedures
Adult Sprague–Dawley female rats, weighing 200-250 mg, were used in this study. Animal handling and surgical protocols followed the regulations set by the Ajou University Institutional Animal Care and Use Committee. After anesthetization with chloral hydrate (400 mg/kg, i.p.), animals received a dorsal laminectomy at the ninth thoracic vertebral level (T9) to expose the spinal cord, and then were subjected to mechanical impact with 180 kdyn force using the Infinite Horizon impactor (Precision Systems and Instrumentation, Lexington, KY). For virus infection in vivo at 30 mins after injury, 6 ul PBS containing high-titer retroviruses (1x10⁹ cfu/ml) and 4ug/ml polybrene (Sigma-Aldrich, St. Louis, MO) was injected two different location at 3 mm rostral and 3 mm caudal from the lesion epicenter at a depth of 1.2 mm (3 ul each) for the contused spinal cord using Hamilton syringes (Hamilton, Reno, NV) (through a glass micropipette with a tip diameter of less than 60 um at
15
a rate of 0.5 ul/min).
3. Western blot analysis
Spinal cord tissues spanning ± 5 mm from the epicenter were dissected and homogenized in ice-cold lysis buffer containing the followings : 20 mM Tris-HCl (pH 7.5), 1 mM EDTA, 5 mM MgCl2, 1 mM dithiothreitol, 0.1 mM phenylmethylsulfonyl fluoride, and protease inhibitor cocktail (Pierce, Rockford, IL). The tissue homogenate was centrifuged at 4℃ and 14,000 rpm for 20 min, and protein concentration of the supernatant was measured using Bradford assay. Equal amounts of proteins were resolved by SDS-PAGE and transferred to a PVDF membrane (Millipore, Bedford, MA). The membrane was blocked in Tris buffered saline (TBS) containing 2.0% BSA and probed with the anti-Olig1 (1:2000; Millipore Corporation, Billerica, MA), Olig2 (1:2000; IBL, Takasaki, Gunma), anti-Nkx2.2 (1:3000; Developmental Studies Hybridoma Bank, Iowa City, Iowa), anti-Sox9 (1:2000; Abcam, Cambridge, UK), anti-Sox10 (1:1000; Millipore, Bedford, MA), anti-ID2 (1:1000; Abcam, Cambridge, UK), MBP (1:1000; Covance, Emeryville, CA), and anti-PLP (1:1000; Millipore, Bedford, MA). After washing, the membranes were incubated for 1 hr at room temperature with secondary antibodies (1:2000; Amersham Biosciences, Arlington Heights, IL). Finally, the blots were developed with enhanced chemiluminescence detection reagents (Amersham Biosciences, Arlington Heights, IL). The blots were reprobed with antibodies against anti-β actin (1:5000; Abcam, Cambridge, UK).
4. Tissue processing and immunohistochemistry
polig1/2-16
IRES-eGFP) were deeply anesthetized with chloral hydrate and perfused intracardially with PBS, followed by 4% paraformaldehyde in 0.1 M phosphate buffer, pH 7.4. Spinal cords were removed and post-fixed in 4% paraformaldehyde for 2 hrs, followed by immersion into a graded series of sucrose solution. Cryosections of spinalcord were made transversely (section thickness 20 um) in a 1:10 series, and mounted onto SuperFrost Plus slides (Fisher Scientific, Pittsburgh, PA). For immunofluorescence staining, sections were incubated overnight with primary antibodies at 4°C or for 2 hrs at room temperature, followed by appropriate secondary antibodies tagged with Alexa Fluor 488 or Alexa Fluor 594 (Molecular Probes, Eugene, OR) for 45 min at room temperature. I used polyclonal NG2 antibody (1:500; Millipore, Bedford, MA) as a marker for oligodendrocyte progenitors, monoclonal APC-CC1 antibody (1:250; Calbiochem, La Jolla, CA) for mature oligodendrocytes, and polyclonal GFAP antibody (1:500; Dako, Carpinteria, CA) for mature astrocytes. Primary antibodies were anti-NG2, anti-APC-CC1, anti-GFAP, monoclonal chicken anti-GFP (1:500; Serotec, Oxford, UK), anti-MBP (1:1000; Covance, Emeryville, CA), anti-Ki67 (1:500; Novacastra, Newcastle, UK), anti-Nkx2.2 (1:1000; Developmental Studies Hybridoma Bank, Iowa City, Iowa), anti-Neurofilament (1:1000; Covance, Emeryville, CA), anti-Sox9 (1:1000; Abcam, Cambridge, UK), anti-Sox10 (1:1000; Millipore, Bedford, MA), NeuN (1:500; Millipore, Bedford, MA), Tuj-1 (1:500; Millipore, Bedford, MA), Iba1 (1:500; Wako, Osaka, Japan), and CD133 (1:1000; Cell Signaling Technology, Danvers, MA).
5. Isolation of GFP+ cells by Fluorescence Activated Cell Sorting (FACS) and cell culture
17
Seven days after SCI, animals (pIRES-eGFP, polig1-IRES-eGFP, polig2-IRES-eGFP, and polig1/2-IRES-eGFP) were anesthetized with chloral hydrate and perfused intracardially with PBS. Spinal cord tissues spanning ± 5 mm from the epicenter were dissected and transferred to ice-cold HBSS (Invitrogen, Carlsbad, CA) containing 26 mM HEPES, 0.3% glucose, and 0.75% sucrose. The tissue was dissociated in HBSS containing 0.25% trypsin and 100 U/ml DNase I (Sigma-Aldrich, St. Louis, MO) at 37℃ for 30 min. The tissue was transferred to HBSS containing 1.5% trypsin inhibitor (Sigma-Aldrich, St. Louis, MO) and triturated with a fire-polished Pasteur pipette. The tissue homogenate was centrifuged at 4℃ and 10,000 rpm for 20 min, discard supernatant and resuspend in HBSS. Cell suspensions were flitted by wet nylon mesh (sterilized by UV-light). Cell sorting and analysis were performed on a FACSVantage SE System (BD Bioscience, San Jose, CA). Excitation was provided by a 4 W argon ion laser (Spectra Physics) tuned to generate 400 mW at 488 nm. Emissions from fluorochromes were passed through a 490 nm long-pass filter, green signal. All experiments were performed with 70 um nozzle tips. After FACS, cells were rinsed twice with PBS and FACS-sorted cells were plated onto 10 ug/ml Poly-D-Lysine coated 9 mm coverslips at a density of 1 x 10³ cells/coverslip. Cells were cultured in DMEM containing 10% FBS at 37℃ / 5% CO2.
6. Soft agar colony forming assay
In vitro tumorigenicity was tested by growth in a soft agar colony assay. FACS-sorted cells were plated into 35 mm dishes using a two-layer soft agar system. The dishes were covered with 2.5 ml Iscove’s Modified Dulbecco’s Medium (IMDM; Gibco BRL, Auckland, NZ) containing 0.6% agar and 10% FBS. The middle layer contained 2 x 10³ cells
18
in IMDM with 0.33% agar and 10% FBS, while the top layer consisted of 2.5 ml IMDM containing 0.6% agar and 10% FBS. After 14 days of incubation, the colonies were counted and measured. All experiments were done at least three times using triplicate dishes per experimental point.
7. Primary glial progenitor cell (GPC) culture and retroviral infection
Glial progenitor cells (GPCs) were cultured from the cerebral cortices of postnatal 2-3 day Sprague-Dawley pubs. Briefly, the cortices were minced and enzymatically dissociated in PBS containing 33 U/ml Papin and 200 U/ml DNase at 37℃ for 30 min. The tissue was transferred to PBS containing 1.5% trypsin inhibitor (Sigma-Aldrich, St. Louis, MO) and triturated with a fire-polished Pasteur pipette. The cell suspensions were passed through a 45 µm pore size nylon mesh (BD Bioscience, Flanklin, NJ) and centrifuged at 1,000 rpm for 13 min. To isolate GPCs from the cell suspension, immunopanning (Gard and Pfeiffer, 1989; Cahoy et al., 2008) was used with a slight modification. Two Petri dishes were precoated with 5ml CRL-1520 hybridoma (anti-A2B5 mouse IgM; ATCC) culture supernatant overnight at 4ºC. The dishes were rinsed three times with PBS and incubated with PBS containing 0.2% BSA at 37 ºC for 30 min to block nonspecific cell attachment. Each dish was filled with cell suspensions and incubated at room temperature for 50 min. Unbound cells were washed off by rinsing with PBS five times. Adherent cells were isolated by treatment with 0.25% trypsin in Earl’s balance salt solution. The isolated GPCs were cultured on Poly-D-Lysine coated dishes in DMEM containing 10 ng/ml recombinant basic fibroblast growth factor (bFGF) (Sigma-Aldrich, St. Louis, MO) and 10 ng/ml human platelet derived growth factor (PDGF) (Sigma-Aldrich, St. Louis, MO). At 3 days in culture,
19
GPCs were exposed to 1 x 10⁶ cfu/ml retroviruses (GFP, Olig1-GFP, and Olig1/2-GFP) for 4 hr in the presence of 1 µg/ml polybrene, and cultured overnight in DMEM containing 10 ng/ml bFGF and 10 ng/ml PDGF. On the following day, GPCs were allowed to differentiate in DMEM containing 3 ng/ml T3 (Sigma-Aldrich, St. Louis, MO) and 10 ng/ml CNTF (Sigma-Aldrich, St. Louis, MO) without bFGF and PDGF. The cultured GPCs were harvested for western blot after 3 days.
8. Phenotype of spinal cord tissue
To quantify the amount of white matter spared after SCI, sections surrounding the injury epicenter were stained with myelin specific eriochrome-cyanine RC and Cresyl Violet. Digitized photographs of the stained sections were taken using Zeiss AxioCam HRc microscopy camera (Zeiss, Oberkochen, Germany ).
9. Stereological cell counts
The number of cells of interest was quantified using the unbiased stereological estimation, based on the optical fractionator method. The MicroBrightField (Mbf) Stereo Investigator version 8.0 (Mbf Bioscience, Williston, VT) equipped with an Olympus BX51 microscope, a motorized microscope stage (Mbf Bioscience, Williston, VT) run by an IBM-compatible computer, and a microcastor (Mbf Bioscience, Williston, VT) connected to the stage and feeding the computer with the distance information in the z-axis was used. Using the injury epicenter as a point of reference, every third section extending rostral and caudal to the epicenter (sections spaced 200 um apart) was sampled so that measurements spanned a total of 6 mm (11 sections per animal, including the epicenter). The injured spinal cord was
20
delineated at a 4x objective and generated counting grid of 300 x 300 um (Kim et al., 2009). An unbiased counting frame of known area superimposed on the image was placed randomly on the first counting area and systemically moved through all counting areas until the entire delineated area was sampled. Actual counting was performed using a 40x objective lenz.
10. To compare the coexpression of various marker in GFP+ cells
20 um thick serial transverse sections were prepared from 6 mm spinal cord stumps (3 mm each for rostral ans caudal to the lesion epicenter). To examine the coexpression of various markers in GFP+ cells, nine representative sections from the above serial transverse sections were double stained for GFP and relevant markers. The entire area of the all sections was examined manually under confocal microscope. To further validate the double staining of multiple markers in single cells, 1-2 representative sections from each animal was further examined by confocal Z-sectioning at an inverval 1.0 um under Zeiss microscope LSM-501(Zeiss, Oberkochen, Germany).
11. Basso, Beattie, and Bresnahan (BBB) open field task
The recovery of gross overground locomotion was evaluated within 24 hrs and 4 day after an initial injury and once a week there after using the Basso, Beattie, and Bresnahan (BBB) open field locomotor test (Basso et al., 1995). After each retroviruses injection, animals were assigned a randomized code to ensure blind evaluation of locomotor performance (GFP n=9, olig1/2 n=8). BBB score was determined 8 times; within 24 hrs and 4 day after an initial injury and then once a week until 6 weeks after injury. Its scale ranges from 0 to 21, with 0 given to animals with no observable hind-limb movement and 21 riven
21
to animals with completely normal open field locomotor function.
12. CatWalk gait assessment
Catwalk was used to assess locomotor gait dynamics. This method of gait analysis allows for easy quantification of a large number of gait parameters during walkway crossings (Hamers et al., 2001). Animals were allowed to walk down a glass walk 8 cm wide with a glass floor (129.8 x 21.5 x 0.6 cm) located in a darkened room. The glass floor is illuminated along the long edge by an encased fluorescent tube. The light that enters the glass floor is internally reflected when bordered by air, thereby acting as an optical fiber. As animals crossed the walkway, light was reflected off the animal’s paws producing a series of footprint images. These footprint images were recorded by a video camera that is located underneath the walkway. Rats were tested on CatWalk before SCI and at the 4 weeks after SCI. Data analysis consisted of assigning a label (left-fore, left-hind or right-fore, right-hind) to the animal’s paw prints as it crossed the walkway using CatWalk 7.1 software. Individuals that analyzed the data were blinded to the identity of the groups. To obtain meaningful and accurate locomotor data, the following criteria concerning walkway crossings were used: (1) the animal needed to walk across the walkway uninterrupted and at a consistent pace, (2) a minimum of five crossings per animal were required and the resulting data were averaged for statistical analysis.
13. Statistical analysis
All statistical analyses were performed using the PRISM 5.0 statistical software package (Graphpad, Inc., San Diego, CA). Differences among experimental groups were
22
evaluated by a one-way ANOVA followed by a Tukey’s pos-thoc analysis. Repeated measures two-way ANOVA was used to compare matched data at multiple time points. Significance for all statistical analysis was set at p < 0.05. Error bars in all graphs depict SD of measured variables.
Part C. Mechanisms in the regulation of the glioma formation by OLIG genes
1. Production of recombinant retroviruses
Recombinant retroviruses pIRES-eGFP, which are designed to express enhanced green fluorescent protein (eGFP) as a marker for infected cells, were described previously. pOlig1-IRES-eGFP, pOlig2-IRES-eGFP, and pOlig1/2-IRES-eGFP were constructed by inserting the full-length cDNA for mouse olig1 and olig2 (Takebayashi et al., 2000) into the pIRES-eGPF vector. For the production of retroviruses, the plasmids were introduced into the retrovirus packaging cell line 293gpg by transient transfection with Lipofectamine 2000 (Invitrogen, Carlsbad, CA). After 72 hours, supernatant fractions were harvested and maintained at -72℃ until use. Viral titers were adjusted to 1X10⁹ cfu/ml.
2. Primary glial progenitor cell (GPC) culture and retroviral infection
Glial progenitor cells (GPCs) were cultured from the cerebral cortices of postnatal 2-3 day Sprague-Dawley pubs. Briefly, the cortices were minced and enzymatically dissociated in PBS containing 33 U/ml Papin and 200 U/ml DNase at 37℃ for 30 min. The tissue was transferred to PBS containing 1.5% trypsin inhibitor (Sigma-Aldrich, St. Louis,
23
MO) and triturated with a fire-polished Pasteur pipette. The cell suspensions were passed through a 45 µm pore size nylon mesh (BD Bioscience, Flanklin, NJ) and centrifuged at 1,000 rpm for 13 min. To isolate GPCs from the cell suspension, immunopanning (Gard and Pfeiffer, 1989; Cahoy et al., 2008) was used with a slight modification. Two Petri dishes were precoated with 5ml CRL-1520 hybridoma (anti-A2B5 mouse IgM; ATCC) culture supernatant overnight at 4ºC. The dishes were rinsed three times with PBS and incubated with PBS containing 0.2% BSA at 37 ºC for 30 min to block nonspecific cell attachment. Each dish was filled with cell suspensions and incubated at room temperature for 50 min. Unbound cells were washed off by rinsing with PBS five times. Adherent cells were isolated by treatment with 0.25% trypsin in Earl’s balance salt solution. The isolated GPCs were cultured on Poly-D-Lysine coated dishes in DMEM containing 10 ng/ml recombinant basic fibroblast growth factor (bFGF) (Sigma-Aldrich, St. Louis, MO) and 10 ng/ml human platelet derived growth factor (PDGF) (Sigma-Aldrich, St. Louis, MO). At 3 days in culture, GPCs were exposed to 1 x 10⁶ cfu/ml retroviruses (GFP, Olig1-GFP, and Olig1/2-GFP) for 4 hr in the presence of 1 µg/ml polybrene, and cultured overnight in DMEM containing 10 ng/ml bFGF and 10 ng/ml PDGF. On the following day, GPCs were allowed to differentiate in DMEM containing 3 ng/ml T3 (Sigma-Aldrich, St. Louis, MO) and 10 ng/ml CNTF (Sigma-Aldrich, St. Louis, MO) without bFGF and PDGF. The cultured GPCs were harvested for western blot after 3 days.
3. Isolation of GFP+ cells by Fluorescence Activated Cell Sorting (FACS) and cell culture
24
polig1/2-IRES-eGFP) were anesthetized with chloral hydrate and perfused intracardially with PBS. Spinal cord tissues spanning ± 5 mm from the epicenter were dissected and transferred to ice-cold HBSS (Invitrogen, Carlsbad, CA) containing 26 mM HEPES, 0.3% glucose, and 0.75% sucrose. The tissue was dissociated in HBSS containing 0.25% trypsin and 100 U/ml DNase I (Sigma-Aldrich, St. Louis, MO) at 37℃ for 30 min. The tissue was transferred to HBSS containing 1.5% trypsin inhibitor (Sigma-Aldrich, St. Louis, MO) and triturated with a fire-polished Pasteur pipette. The tissue homogenate was centrifuged at 4℃ and 10,000 rpm for 20 min, discard supernatant and resuspend in HBSS. Cell suspensions were flitted by wet nylon mesh (sterilized by UV-light). Cell sorting and analysis were performed on a FACSVantage SE System (BD Bioscience, San Jose, CA). Excitation was provided by a 4 W argon ion laser (Spectra Physics) tuned to generate 400 mW at 488 nm. Emissions from fluorochromes were passed through a 490 nm long-pass filter, green signal. All experiments were performed with 70 um nozzle tips. After FACS, cells were rinsed twice with PBS and FACS-sorted cells were plated onto 10 ug/ml Poly-D-Lysine coated 9 mm coverslips at a density of 1 x 10³ cells/coverslip. Cells were cultured in DMEM containing 10% FBS at 37℃ / 5% CO2.
4. Soft agar colony forming assay
In vitro tumorigenicity was tested by growth in a soft agar colony assay. Cultured GPC cells were plated into 35 mm dishes using a two-layer soft agar system. The dishes were covered with 2.5 ml Iscove’s Modified Dulbecco’s Medium (IMDM; Gibco BRL, Auckland, NZ) containing 0.6% agar and 10% FBS. The middle layer contained 2 x 10³ cells in IMDM with 0.33% agar and 10% FBS, while the top layer consisted of 2.5 ml IMDM
25
containing 0.6% agar and 10% FBS. After 14 days of incubation, the colonies were counted and measured. All experiments were done at least three times using triplicate dishes per experimental point.
5. Western blot analysis
The Retroviruses injected GPCs were dissociated and homogenized in ice-cold lysis buffer containing the followings : 20 mM Tris-HCl (pH 7.5), 1 mM EDTA, 5 mM MgCl2, 1 mM dithiothreitol, 0.1 mM phenylmethylsulfonyl fluoride, and protease inhibitor cocktail (Pierce, Rockford, IL). The tissue homogenate was centrifuged at 4℃ and 14,000 rpm for 20 min, and protein concentration of the supernatant was measured using Bradford assay. Equal amounts of proteins were resolved by SDS-PAGE and transferred to a PVDF membrane (Millipore, Bedford, MA). The membrane was blocked in Tris buffered saline (TBS) containing 2.0% BSA and probed with the anti-Olig1 (1:2000; Millipore Corporation, Billerica, MA), anti-Olig2 (1:2000; IBL, Takasaki, Gunma), anti-p21 (1:2000; BD phamingen, Flanklin, NJ), and anti-p53 (1:3000; Calbiochem, La Jolla, CA). After washing, the membranes were incubated for 1 hr at room temperature with secondary antibodies (1:2000; Amersham Biosciences, Arlington Heights, IL). Finally, the blots were developed with enhanced chemiluminescence detection reagents (Amersham Biosciences, Arlington Heights, IL). The blots were reprobed with antibodies against anti-β actin (1:5000; Abcam, Cambridge, UK).
6. Plasmid construction
26
from the upstream containing olig2 binding sites in the human p21 promoter. Reporter plasmid pGL3-p21p-Luc was constructed from pGL3 (Promega, Madison, WI) and pJFCAT1 (Addgene, Cambridge, MA).
7. Luciferase assays and 293 cell transfections
HEK-293 cells were cultured in DMEM + 10% FBS and grown to 90-95% confluence, then transfected with Lipofectamine 2000 (Invitrogen, Carlsbad, CA) following manufacturer’s instructions. For luciferase assays, 0.1 μg pGL3-p21promoter- firefly luciferase plasmid, 1 ug pcDNA3.1-olig1 (or olig2 or olig1/2) (Takebayashi et al., 2000) and 0.15 μg pRL-TK Renilla luciferase control plasmid (Promega, Madison, WI) mimic reagent were combined in transfections. Cells were then cultured 24 hrs at 37°C, 5% CO2. Luciferase activity was assayed using Dual-Luciferase Reporter Assay System (Promega, Madison, WI). In all experiments, firefly (test) luciferase activity was normalized relative to the level of Renilla (transfection control) luciferase activity in the same well. Within a single experiment, all individual firefly/Renilla ratios were then normalized to the average of the control mimic - test firefly - control Renilla transfection well ratios.
8. Nude mice xenograft experiments
Rat glial progenitor cells (GPCs) were maintained in DMEM containing 10 ng/ml bFGF (Sigma-Aldrich, St. Louis, MO) and 10 ng/ml PDGF (Sigma-Aldrich, St. Louis, MO). GPCs were exposed to 1 x 10⁶ cfu/ml retroviruses (GFP and Olig2-GFP) for 4 hr in the presence of 1 ug/ml polybrene, and cultured 3 day in DMEM containing 10 ng/ml bFGF and 10 ng/ml PDGF. Confluent GPCs cultures were harvested by brief trypsinization (0.05%
27
trypsin and 0.02% EDTA in Hank’s balanced salt solution), washed three times with a PBS and resuspended at a final concentration of 1 x 10⁸ cells/ml in PBS. Single-cell suspensions were confirmed by phase-contrast microscopy. Pathogen-free female BALB/cSlc-nu athymic nude mice (4 weeks old; Central Lab. Animal Inc., Seoul, Korea) were anesthetized by choral hydrate (400 mg/kg, i.p.) and Three ul of PBS containing retroviral infected GPCs were intracranially transplanted at the rate of o.5 ul/min using a 26 gauge Hamilton mcro-syringe. The target was the right caudate putaman at [antero/posterior (AP) +0.02mm, medial/lateral (ML) -0.2mm, dorsal/ventral (DV) 0.35mm].
9. Tissue processing and Cresyl Violet stain
Animals (pIRES-eGFP and polig2-IRES-eGFP) were deeply anesthetized with chloral hydrate and perfused intracardially with PBS, followed by 4% paraformaldehyde in 0.1 M phosphate buffer, pH 7.4. Brains were removed and post-fixed in 4% paraformaldehyde for 2 hrs, followed by immersion into a graded series of sucrose solution. Cryosections of brain were made transversely (section thickness 20 um) in a 1:10 series, and mounted onto SuperFrost Plus slides (Fisher Scientific, Pittsburgh, PA). The sections were rinsed once for 30 sec in dH2O, hence, the sections stained with 0.25% Cresyl Violet (Sigma-Aldrich, St. Louis, MO) for 1 min and dipped rinse three time in fresh dH2O. The sectios were destained with 300 ml 95% ethanol and 0.5 ml glacial acetic acid. Finally, the sections were dehydrated with 95% ethanol, 100% ethanol, and xylene. The sections were coverd with cover-glasses using mounting solution (Vector Laboratories, Burlingame, CA).
28
All statistical analyses were performed using the PRISM 5.0 statistical software package (Graphpad, Inc., San Diego, CA). Differences among experimental groups were evaluated by a one-way ANOVA followed by a Tukey’s pos-thoc analysis. Significance for all statistical analysis was set at p < 0.05. Error bars in all graphs depict SD of measured variables.
29
III. RESULTS
Part A. Ex vivo VEGF delivery following contusion spinal cord injury
1. Ex vivo VEGF delivery to the injured spinal cord using immortalized human
NSCs
One of the immortalized human NSC line (F3) was retrovirally transduced with human VEGF cDNA to generate VEGF overexpressing NSC line (F3.VEGF). At 1 week after SCI, parental F3 NSCs or VEGF overexpressing NSCs (F3.VEGF) were transplanted at 2mm rostral and caudal to the epicenter. Grafted NSCs were detected by immunoreactivity against human specific mitochondria at 1 week after transplantation (Fig. 1A-C). The number of surviving F3.VEGF cells was higher than that of F3 cells. The percentage of surviving cells was versus total transplanted cells was 15.9±4.3 and 28.7±7.6% for F3 and F3.VEGF groups, respectively (n=5 for each group). The majority of surviving cells were observed at the lesion epicenter, suggesting that grafted cells migrated towards the injury sites. Fewer cells were found to be scattered in distant areas rostral and caudal to the lesion. Most of the grafted NSCs did not incorporate proliferation marker BrdU (Fig. 1D), indicating that they no longer proliferate after being transplanted into the injured spinal cord. Grafted cells were still detected at 5 week post-transplatation, but the number of surviving cells (both F3 anf F3.VEGF cells) was markedly reduced by that time point; 9.1±3.3 (F3) and 11.6±4.8% (F3.VEGF) of transplanted cells were detected (N=5 for each group).
30
Fig. 1. Ex vivo delivery of VEGF carried by human neural stem cells (NSCs) to the injured spinal cord. (A-C) Detection of transplanted NScs by human specific mitochondria (hMito) staining at 1 week after transplantation (2 weeks after injury). Surviving F3 (B) and F3.VEGF (C) cells were observed around the lesion cavities. Control PBS group did not show any immunoreactivity to hMito (A). (D) Most of the transplanted NSCs did not incorporate BrdU. An arrow indicates a transplanted NSC colocalized with BrdU. Asterisks indicate lesion cavities at the epicenter. Scale bars; 100 um. (E) Levels of VEGF production in spinal cord tissue were measured by ELISA at 2 and 6 weeks after injury (1 and 5 weeks
31
after transplantation). White, hatched, and black bars represent PBS (n=5), F3 (n=5), and F3.VEGF (n=5) groups, respectively. * p<0.05, *** p<0.001 by one-way ANOVA followed by Tukey’s post hoc analysis. (F) Western blot analysis of VEGF receptor flk-1 and phosphorylated flk-1 (p-flk-1).