Proteomic analysis of molecular
factors associated with obstructive
megaureter
Ji Hee Jun
Department of Medical Science
Proteomic analysis of molecular
factors associated with obstructive
megaureter
Directed by Professor Sang Won Han
The Master’s Thesis
submitted to the Department of Medical Science,
the Graduate School of Yonsei University
in partial fulfillment of the requirements for the
degree of Master of Medical Science
Ji Hee Jun
This certifies that the Master’s
Thesis of Ji Hee Jun is approved
---
Thesis Supervisor: Sang Won Han
---
Thesis Committee Member #1: Hoguen Kim
---
Thesis Committee Member #2: Chang Hee Hong
The Graduate School
Yonsei University
ACKNOWLEDGEMENTS
I would like to express my gratitude to all those who gave me the possibility to complete this thesis.
First of all, I am sincerely thankful to my advisor professor Sang Won Han, whose encouragement, guidance and support helped me in all the time of research for and writing or this thesis.
I also would like to thank Professor Hoguen Kim and Chang Hee Hong who gave excellent suggestions and encouragements during the meticulous and tireless examination of this thesis.
And I am obliged to Prof. Jang Hwan Kim, Dr. Young Jae Im, Dr. Hyun Jin Jung and Dr. Yong Seung Lee for all their help, support, interest and valuable hints. My lab mates, Hyo Jin Kang and Min Jung Moon also gave me the great help and support to complete this thesis.
Especially, I would like to give my special thanks to my family whose patient love enabled me to complete this work.
TABLE OF CONTENTS
ABSTRACT···1
I. INTRODUCTION ···3
II. MATERIALS AND METHODS ···6
1. Cell isolation, culture and storage···6
2. Two-dimensional gel electrophoresis···6
3. Image analysis and quantification···7
4. Nanoflow LC-ESI-MS-MS analysis···7
5. Western blotting···9
6. Transfection···9
7. Reverse transcription-polymerase chain reaction (RT-PCR)··10
8. Flow Cytometry···10
9. Immunocytochemistry and immunohistochemical study···10
10. Data analysis···11
III. RESULTS ···12
1.
The expression of smooth muscle and collagen in megaureter and control ureter···12
2.
Identification of megaureter and control SMCs···13
3. Two-dimensional gel electrophoresis & analysis of Nanoflow
LC-ESI-MS-MS ···14
4. Comparison of TPM1, smooth muscle protein expression
between MU and control ureter ···17
5.
TPM1 transfection in control SMCs···18
6.
Apoptosis in Megaureter, transfected and Control SMCs···19
7. Immnocytochemistry of the TPM1 in Control and MU···20
IV. DISCUSSION···22
V. CONCLUSION···25
REFERENCES···26
LIST OF FIGURES
Figure 1. Masson’s trichrome staining of control ureter and MU
···12
Figure 2. Representative staining results of primary cultured SMCs of
control ureter and MU···13
Figure 3. 2-DE analysis of primary cultured SMCs of MU and control
ureter ···15
Figure 4. The differentially expressed TPM1 and smooth muscle
protein ···17
Figure 5. Changes in TPM1 mRNA level in transfected SMCs
···18
Figure 6. The percent of apoptotic cells as determined by flow
cytometry···19
Figure 7. Representative photographs of immunocytochemical analysis
of TPM1 protein expression···21
LIST OF TABLES
Table 1. Differentially expressed protein spots between megaureter and
control SMCs···16
1
ABSTRACT
Proteomic analysis of molecular factors associated with
Obstructive Megaureter
Ji Hee Jun
Department of Medical Science
The Graduate School, Yonsei University
(Directed by Professor Sang Won Han)
Congenital megaureter is a term used in many cases of urinary tract dilatation detected before and after birth. Prior studies have investigated histological changes such as the concomitant decrease in smooth muscle cells and increase in extracellular connective tissue. However, the underlying pathophysiology of obstructive and refluxing megaureter is poorly understood. Megaureter and normal ureter tissues were used to examine differentially expressed proteins to gain a better understanding of the pathogenesis of megaureter. Smooth muscle cells (SMCs) of obstructive megaureters were obtained from 5 patients who underwent open ureteroneocystostomy surgery and 5 control patients with low grade VUR. The obtained SMCs were cultured in M199 medium supplemented with 10% fetal bovine serum (FBS) and 1% antibiotics. To identify differently expressed proteins, protein spots separated by 2D gel electrophoresis were matched and then analyzed using PDQuest software and nanoflow LC-ESI-MS-MS. TPM1, a protein associated with the contraction and migration of SMCs, was selected among the analyzed proteins such as annexin A2, smooth muscle protein and nephronectin etc. to
investigate its relationship with megaureter. When α-tropomyosin (TPM1)
was artificially over-expressed in normal ureter SMCs, a significant change in morphology was observed. In addition, the rate of apoptosis was increased in
2
transfected SMCs compared with controls.
Ureter smooth muscle is known to play an important role in peristalsis and pacemaker activity. Abnormal over-expression of TPM1 in ureter SMCs may induce defects in contractility and increase apoptosis. Empty spaces caused by apoptosis may then be preferentially filled with connective tissue rather than SMCs which have a low migration rate. As a result, contractility is decreased; leading to the development a dilated ureter.
From the results of this study, over-expression of TPM1 gives new insights on potential molecular mechanisms associated with the development of megaureter and is expected to be a potentially exploitable protein as putative prognostic biomarkers of fibrosis in ureters and other tissues.
--- Key words: megaureter, smooth muscle cell, fibrosis, proteomics, TPM1
3
Proteomic analysis of molecular factors associated with
obstructive megaureter
Ji Hee Jun
Department of Medical Science
The Graduate School, Yonsei University
(Directed by Professor Sang Won Han)
I. INTRODUCTION
The term megaureter simply refers to a “dilated or larger” ureter and implies no description of function of the ureter in terms of obstruction or reflux. In children, a ureteral diameter over 7 mm is considered a
megaureter1. Megaureters are classified as primary or secondary and also
subdivided into obstructed, refluxing, obstructed and refluxing, or neither
obstructing nor refluxing2. In primary megaureter (PM) the cause is
idiopathic, while secondary megaureter may be caused from urethral
obstruction, bladder outlet obstruction (BOO), or neurogenic bladder3. It is
important to distinguish between cases of primary or secondary causes of the pathology, as in the case of secondary causes, the treatment is
preferentially focused on the initiating pathology and not on the ureter4. On
the other hand, in primary megaureter most recover spontaneously or remain stable; however, surgery is required in cases of progressive reduction in
renal function or increasing dilatation etc.5. This study focused only on cases
of primary obstructing megaureter (POM). POM is usually detected as an abnormal narrowing at the vesicourethral junction (VUJ) which interrupts
4
the normal rate of urine transport so that functional obstruction arises. Several reasons for abnormal movement have been proposed including
increased collagen ratio6, abnormal development of circular muscle fiber,
and loss of muscle layer7. However, the pathology of megaureter is still
controversial.
Motility, at either the cell or tissue level, is an essential characteristic of life. Muscle contraction, the best characterized type of biological motility,
depends on the sliding of thick and thin filaments8. The rate and speed of
cell migration and contractility are influenced by stress fibers9. Given that
contractile stress fibers are associated with the formation of focal adhesions, molecules that determine the contractile properties of actin stress fibers may
also determine the structure of associated focal adhesions10. Tropomyosins
(TPMs) are α-helical coiled coil dimers that form continuous polymers along the major groove of actin filaments. The TPM family of actin-binding proteins is essential for the integrity of actin filament. This family consists of several isoforms which can be divided into three categories: striated
muscle TPMs, smooth muscle TPMs, and cytoplasmic TPMs11. In striated
muscle, TPMs take part in muscle contraction by regulating the interaction
between actin and myosin. TPM1 plays an important role in Ca2+-dependent
contractions and can occupy three different positions on actin (“blocked” or calcium-free, “closed” or calcium-induced, and “open” or myosin-induced)
depending on the presence of calcium, myosin, and troponin12. However, in
smooth muscles and many non-muscle motile systems, troponin is absent. Instead, calmodulin interacts with a myosin light chain kinase to trigger a
phosphorylation cascade leading to the activation of actomyosin ATPase13.
In addition to motility, apoptosis is also important for maintaining the regular function and activities of cells, and failure of this process can lead to a number of pathologies. Interactions between cells and extracellular matrix
5
ability to regulate the molecular composition of microfilaments, which in turn regulates the dynamic and functional properties of the resulting actin
filament population as well as morphology15.
In this study, since biological processes are directly regulated by proteins, proteomic analysis was used to analyze differential gene expression at the protein level by comparing the 2-DE patterns of proteomes in control and
megaureter smooth muscle cells16. The cellular and molecular mechanisms
of contractile dysfunction in megaureter are not well known. Proteins identified by proteomic analysis may provide clues to elucidate the molecular mechanisms of ureter dysfunction, and this information could potentially aid in the development of novel strategies for the treatment of megaureter.
6 II. MATERIALS AND METHODS 1. Cell isolation, culture and storage
Megaureter smooth muscle cells (MSMCs) were obtained from 5 children with obstructive megaureter (age range: 8m to 1y 8m, mean age: 1y 1m) who underwent open ureteroneocystostomy surgery and 5 controls (age range: 1y to 3y 2m, mean age: 1y 7m) with low grade VUR which were not observed ureter dilatation. The megaureter tissues obtained from dilated region in ureter. Each sample was immediately put in cold phosphate-buffered saline (PBS, WelGENE biopharmaceuticals, Deagu, Korea) and transported to the laboratory. After washing each specimen two times with PBS, the tissue was chopped into pieces and an equal amount of 0.1% collagenase IV (Worthington, Lakewood, NJ, USA) was added to remove collagen. After 1h
incubation in a 37°C/CO2incubator, the samples were neutralized with M199
medium (Sigma-Aldrich, St Louis, MO, USA). The dissolved tissue was centrifuged and the pellet was resuspended with M199 medium and then passed through a cell strainer. After a second centrifugation, the pellet was resuspended with medium again. Isolated SMCs were cultured in medium supplemented with 10% fetal bovine serum (Gibco-Invitrogen, Carlsbad, CA, USA) and 1% penicillin-streptomycin (Gibco-Invitrogen, Carlsbad, CA, USA). Culture medium was changed twice a week and cells were passaged at 90–95% confluence.
2. Two-dimensional electrophoresis (2DE)
Cells were lysed in 500µl of lysis buffer consisting of 8M Urea (Bio-Rad, Hercules CA, USA), 2M Thiourea, 2% CHAPS, 1% DL-dithiothreitol(DTT), 0.2% Pharmalyte(pH3–10) (Sigma-Aldrich, St. Louis, MO, USA), and 4% protease inhibitors in distilled water. Protein concentrations were determined by the Bradford assay. Precipitated proteins were dissolved in lysis buffer and separated by IPG-IEF using a Protean IEF Cell (Bio-Rad, Munich, Germany).
7
The first-dimension isoelectric focusing (IEF) was followed by a series of steps: 12h (rehydration), 15min/250 V, 500VHrs/500V, 1000VHrs/1000V,
10000VHrs/4000V, and 40000VHrs/10000V. After first-dimensional
separation, the IPG gel was equilibrated in equilibration buffer I (50mM Tris-HCl (pH8.8), 6M urea, 30% (v/v) glycerol, 2% (v/v) SDS, 1% DTT) for 30min and then in equilibration buffer II (50mM Tris-HCl (pH 8.8), 6M urea, 30% (v/v) glycerol, 2% (v/v) SDS, 2.5% iodoacetamide) for 30 min. The second-dimension SDS-PAGE was carried out using 10% polyacrylamide gels. Proteins were visualized by Commassie blue staining, which allows for direct correlation of the intensity of the protein spot with the quantity of protein present. The stained gels were stored at 4°C.
3. Image analysis and quantification
The gels were scanned using a GS-800 Calibrated Densitometer (Bio-Rad, Hercules, CA, USA) and matched to analyze differentially expressed spots using PDQuest software version 8.0.1 (Bio-Rad, Hercules, CA, USA). The gel images were normalized using the PDQuest software in order to even out differences in staining intensities between gels. Each matched protein spot was assigned a unique sample spot protein (SSP) number in the PDQuest software. Student’s t-test was performed with a 95% significance level to determine which proteins were differentially expressed between neurogenic and control bladders. A minimum of a 10.0-fold change was considered for up-regulated proteins and 0.1-fold for down-regulated proteins.
4. Nanoflow LC-ESI-MS-MS analysis
The excised gel pieces were resuspended in a solution of 10 mM
dithiothreitol and 0.1 M NH4HCO3 at 56°C. After 30 min of incubation, the
8
mM for 30 min in the dark. For the in-gel digestion with trypsin, the gel
pieces were rehydrated in digestion buffer containing 0.05 M NH4HCO3 and
10 ng/μl of modified porcine trypsin (Promega, Madison, WI, USA) at 4°C for 45 min. The excess supernatant was removed and the gel pieces were
covered with 0.05 M NH4HCO3 buffer. The digestion was performed
overnight at 37°C. The digested mixture was finally desalted using an Oasis HLB cartridge (Waters, Milford, MA, USA), dried, and resuspended in 2%
CH3CN in water for nanoflow LC-MS-MS analysis.
Nanoflow LC-ESI-MS-MS experiments were carried out using a CapLC equipped with a Q-TOF Ultima mass spectrometer (Waters, Milford, MA, USA) with a homemade pulled tip capillary column (75-μm i.d., 360-μm o.d., 15cm) and an end frit at the tip. For each sample, 5.0 μl of digested peptide mixture was injected via an autosampler connected to the trapping column. After loading, a binary RP gradient elution (mobile-phase composition of (A)
2% CH3CN in water and (B) 98% CH3CN in water, both containing 0.1%
HCOOH) was pumped through the column and the effluent was fed into the mass spectrometer via the ESI method. The eluent was added to a gradient that began with 5% B (from 2% B at default) for 5 min and was increased to 12% B for 25 min and then to 22% B for 60 min. It was then gradually ramped up to 80% B over 3 min and was maintained at this level for 10 min, after which it was gradually decreased to 5% B over 2 min and maintained at this level for at least 25 min for column reconditioning. The flow rate during the gradient separation remained at 200 nl/min, and the eluted peptides were directly eletrosprayed into the mass spectrometer with a spray voltage of 2.4 kV in the positive ion mode. Peptide ions were detected in the data-dependent analysis mode with an MS precursor scan (300–1700 amu) followed by three data-dependent MS-MS scans. For data analysis, the collected raw MS/MS spectra were analyzed with the Mascot search program using NCBI databases. The accepted mass tolerance used was 100 ppm for both molar masses of the
9
precursor peptide and peptide fragment ions. For analysis of the search data, only peptides yielding Mascot ion scores greater than 49 indicated extensive homology and were accepted.
5. Western blotting
Proteins of interest were selected from the Q-TOF MS data. Western blotting was performed with mouse anti-human Tropomyosin 1 (Santa Cruz, CA, USA), mouse anti-human α-smooth muscle actin (α-SMA, Abcam, Cambridge, UK) and mouse anti-human Tm311 (Santa Cruz, CA, USA). The quantified samples of protein were mixed with 5X sample buffer, heated at 100°C for 8 min, and then separated on 10% SDS-polyacrylamide gels. After electrophoresis, the proteins were transferred onto PVDF membranes (Amersham Life Science, Arlington Height, IL, and USA) with Novex Tris-Glycine Transfer Buffer (Invitrogen Co., Carlsbad, CA, USA). The membranes were blocked for 1 h at room temperature with 5% skim milk in TBS/Tween-20. The membranes were incubated at 4°C overnight with specific antibodies and then incubated with horseradish peroxidase– conjugated anti-mouse IgG or anti-rabbit IgG for 1 h at room temperature. After washing, the membranes were developed using the West-Q Chemiluminescent Substrate Kit, Plus (GenDEPOT Inc., Barker, TX, USA). The intensity of the proteins was analyzed by Multi Gauge software, version 3.0 (Fuji Photo Film, Tokyo, Japan), and the relative density was expressed as a ratio of the control value.
6. Transfection
TPM1 plasmid DNA (OriGene Technologies Inc., Rockville, MD, USA) and Lipofectamine LTX (Invitrogen Co., Carlsbad, CA, USA) were used for
transfection. One day before transfection, 1 × 10⁵ SMC cells were plated in
10
Transfection was performed in accordance with the manufacturer’s instructions.
7. Reverse transcription-polymerase chain reaction (RT-PCR)
Total RNA was isolated with TRIzol reagent and then treated with DNase I. cDNA synthesis and gene amplification was performed as described by the protocol for the PCR kit. The mixture was incubated at 95°C for 15 min before the first cycle and extended at 72°C for 10 min after all cycles were completed. A total of 30 cycles of amplification were performed. Primers for TPM1 were designed and purchased from Bioneer Corporation (Daejeon, Korea). TPM1 primers sequences were as follows: forward:
5’-CTCGCAGAAGGAAGACAGA-3’ and reverse:
5’-ATTGGCACTTTGAATGGAAC-3’. The GAPDH control primer pair was obtained from BioSource International (Carlsbad, CA, USA). PCR products were separated by size on a 1% agarose gel in Tris–borate EDTA buffer. Band intensities were quantitated using a densitometric scanner, and the relative density was expressed as a ratio of the control value.
8. Flow Cytometry
SMCs (1 × 10⁵cells) were seeded in 6-well plates and incubated in
serum-free Opti-MEM for 24h before transfection. After transfection, apoptosis of SMCs was detected using the AnnexinV-FITC/PI apoptosis detection kit (BD Biosciences Pharmingen, San Diego, CA, USA) according to the manufacturer’s protocol. Experiments were repeated at least three times.
9. Immunocytochemistry and immunohistochemical study
For culture slides, 1× 10⁵ cells were seeded per plate(BD Biosciences,
Bedford, MA, USA)and then incubated until the cells were 50% confluent. To investigate the morphology of SMCs, cells were fixed in 4% formaldehyde,
11
permeabilized with 0.2% Triton X-100, and then stained with α-SMA antibody (1:200, Abcam, Cambridge, UK). All stained samples were captured using an Olympus fluorescence inverted microscope (100×magnification). Evaluation of ureter histology was performed by Masson’s trichrome stain. The distribution of collagen and smooth muscle were assessed by staining with the Sigma-Aldrich HT15 kit according to the manufacturer’s protocol. All stained samples were captured using an Olympus fluorescence inverted microscope (200× magnification).
10. Data analysis
Statistical analyses were performed using the InStat statistics program (GraphPad software, San Diego, CA, USA) to compare the data obtained from two different patient populations by Student’s t-test and correlation coefficient. P-value <0.05 were considered statistically significant.
12 III. RESULTS
1. The expression of smooth muscle and collagen in megaureter and control ureter
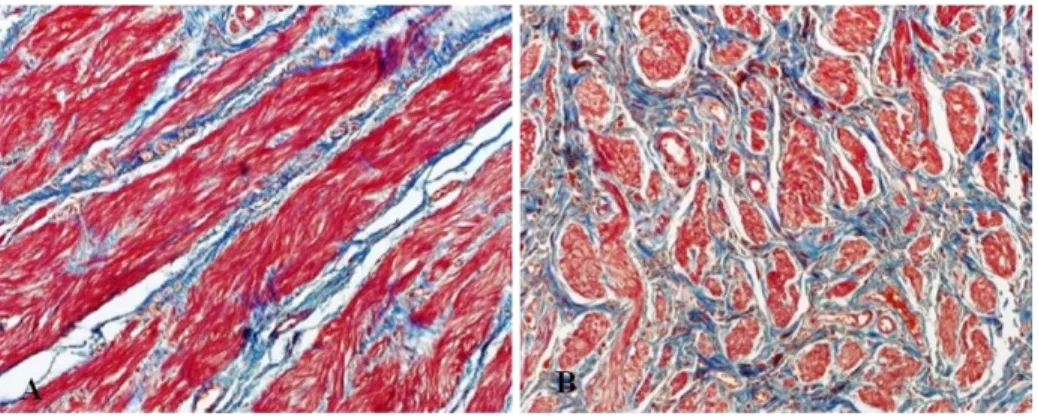
Masson’s trichrome staining was performed to investigate the smooth muscle-to-collagen ratio. While the expression of collagen was significantly increased, smooth muscle was visibly decreased in megaureter compared with control ureter tissue (Figure 1- A, B).
Figure 1. Masson’s trichrome staining of megaureter and control ureters.
(A), (B) Collagen is stained in blue and muscle in red. Microphotographs
were taken at 200× magnification.
13
2. Identification of megaureter and control SMCs
Primary cultured SMCs were stained with α-smooth muscle actin to
compare the morphology between megaureter and control cells. In the control group, SMCs showed spindle-like and tapering shapes (Figure 2-A, B). However, megaureter SMCs appeared as a complicated pattern of filaments stretched out on all sides (Figure 2- C, D).
Figure 2. Representative staining results for primary cultured SMCs of control ureter and MU. Cells were stained with α-smooth muscle
actin(green) and DAPI(blue). Microphotographs were taken at 200×
magnification. (A), (B) Control SMCs show striated filaments. (C), (D) Megaureter SMCs show protruding star shapes.
14
3. Two-dimensional gel electrophoresis & analysis of Nanoflow LC-ESI-MS-MS
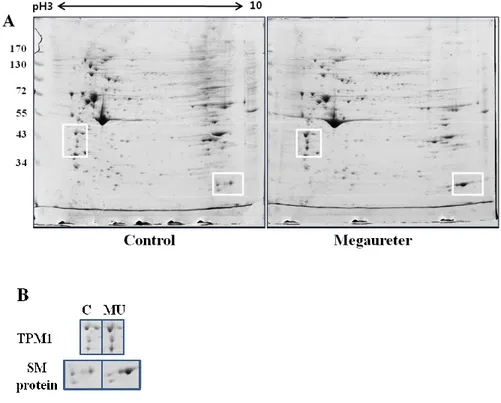
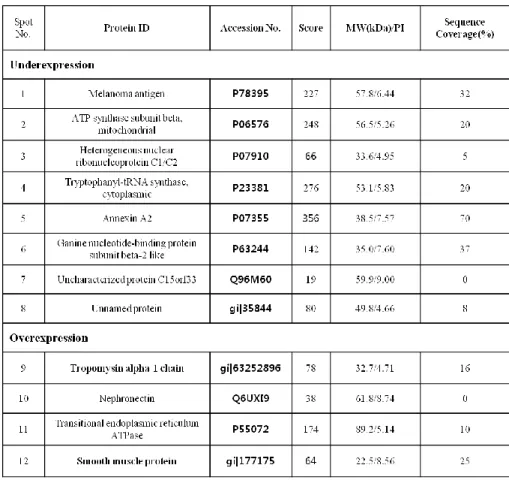
Image analysis and quantification of 2D gel electrophoresis were performed with PDQuest software, version 8.0.1. In the analysis of protein spots, over 100 protein spots were detected between megaureter and control ureters (Figure 3-A). Twelve protein spots were detected as statistically different between megaureter and control ureter tissues. Four spots were relatively over-expressed and eight spots were relatively under-expressed in megaureter. Differentially expressed protein spots were identified through nanoflow LC-ESI-MS-MS and database searching (Table 1). Proteins such as Tryptophanyl-tRNA synthetase, Annexin A2, and ATP synthase subunit beta showed lower expression in megaureter compared with control ureters. Conversely, Tropomyosin alpha-1 chain (TPM1) and smooth muscle protein etc. were relatively more expressed in megaureter (Table 1). Some protein spots were unknown or unnamed proteins and could not be identified because of their low abundance. TPM1 was selected among the proteins for investigation of protein function in the ureter. According to the Mascot search results, the matched sequences of TPM1were R.SKQLEDELVSLQK.K (Ions score 57) and R.SKQLEDELVSLQK.K (Ions score 72).
15
Figure 3. 2-DE analysis of primary cultured SMCs of MU and control ureter. Quantified proteins from SMCs were isoelectrically focused with an
immobilized linear pH gradient and separated by 10% SDS-PAGE. Proteins were visualized by Commassie blue staining. (A) Proteins in white boxes showed statistically significant differences by PDQuest analysis. (B) TPM1 and SM protein spots were expressed more strongly in megaureter SMCs compared with the control group. (C; control ureter, MU; megaureter, SM; smooth muscle, and SMC; smooth muscle cell)
16
Table 1. Differentially expressed protein spots between megaureter and control SMCs
17
4. Comparison of TPM1, smooth muscle protein expression between MU and control ureter.
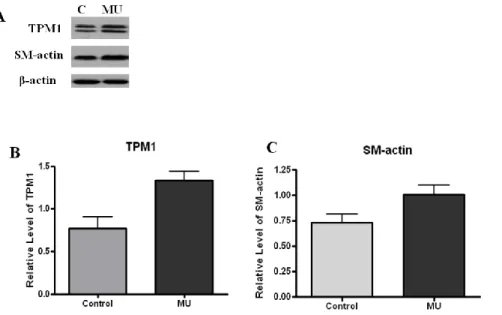
The expression of TPM1 and smooth muscle protein was significantly increased in 2D gels. To confirm the protein expression level, Western blotting was performed with antibodies against TPM1 and smooth muscle actin. TPM1 and SM actin both showed higher expression in megaureter compared with the control group (Figure 4 A-C). These results also corresponded to our LC-ESI-MS-MS data (Figure 3-B).
Figure 4. The differentially expressed TPM1 and smooth muscle protein
Western blot analysis was performed to confirm TPM1 and SM actin expression at the protein level. (A) Protein extracts from megaureter and control SMCs were probed with antibodies against TPM1 and SM actin. (B) Western blot gels were scanned with a densitometer to determine the areas under the bands. Loadings were adjusted to contain sufficient amounts for absorption to fall within the linear region of the curve. TPM1 and SM actin were over-expressed in megaureter SMCs compared with the control group.
18 5. TPM1 transfection in control SMCs
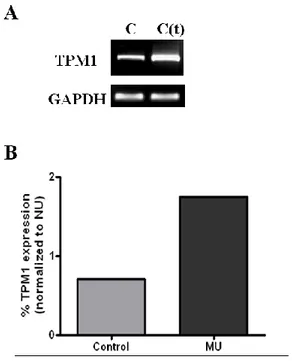
RT-PCR analysis was performed to confirm the increased mRNA expression of TPM1 in transfected SMCs. Quantization of PCR bands in stained agarose gels by scanning densitometry indicated that the relative expression of TPM1 in the transfected group was significantly higher compared with the control group (Figure 5-A). Figure 5-B shows the graphic analysis of the averaged data.
Figure 5. Changes in TPM1 mRNA level in transfected SMCs. RT-PCR
was performed to determine TPM1 mRNA expression levels. (A) TPM1 mRNA expression was increased in transfected SMCs compared with the control group. (B) Expression of TPM1 protein was decrypted by densitometric scanning of gels. (C; control ureter, C(t); transfected control ureter)
19
6. Apoptosis in Megaureter, transfected and Control SMCs
Cell apoptosis was detected using flow cytometry. FACS was immediately accomplished after transfection. The rate of early and late apoptosis is 44.39% in TPM1 increased group, and the lower rate of apoptosis was represented, 27.4%, 10.7% in Megaureter and control group respectively. After 48hr, SMCs in transfected group died almost 70%; on the other hand, relatively many SMCs survived in control group (Figure 6-A, B).
Figure 6. The percent of apoptotic cells as determined by flow cytometry Representative FACS data and bar graph summarizing the FACS
results are shown. (A) The apoptosis rate was increased in TPM1 increased group megaureter rather than control group. (B) Each bar represents the rate of apoptotic cell in individual group.
20
7. Immnocytochemistry of the TPM1 in Control and MU
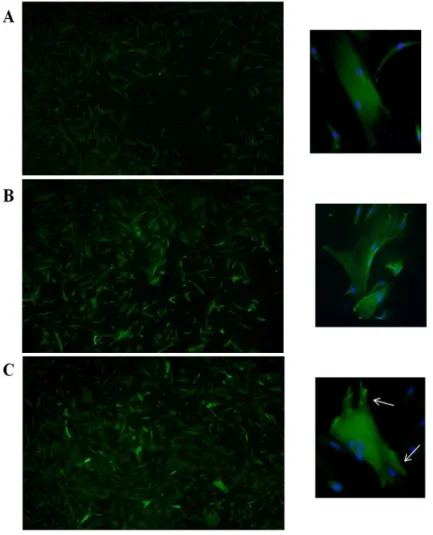
To compare the expression of TPM1 and changes in morphology between megaureter and control SMCs, SMCs were labeled with TPM1 antibodies followed by staining with Alexa-green secondary antibody. Negative controls were made with cells treated similarly, except that treatment with specific antibodies was eliminated. Control SMCs showed relatively weak expression of TPM1 and filaments with regular striations (Figure 7-A). As shown in Figures B and C, the shape of SMCs and expression levels of TPM1 were differentin megaureter SMCs compared with the control group. In megaureter SMCs, many brightly-stained cells showed transformed shapes (Figure 7- B).Transfected SMCs showed the greatest increase in TPM1 expression levels. In particular, the focal adhesions were notably projected (Figure 7- C).
21
Figure 7. Representative photographs of immunocytochemical analysis of TPM1 protein expression. Expression levels of TPM1 in megaureter and
transfected SMCs were greater compared with the control group. TPM1 was expressed (A) in normal SMCs, (B) in megaureter SMCs, and (C) in transfected SMCs. Enlargements were placed on the right side of each figure and white arrows indicate focal adhesions. Microphotographs were taken at 100× magnification.
22 IV. DISCUSSION
The main function of ureter is to transport urine from kidneys to the bladder. Peristaltic movement of the ureter is regulated through coherent nervous and muscular activity. Distension and ureteral diameter are key to maintain intraluminal pressure. Intraluminal pressure decreases due to increases in ureteral diameter. Tanagho et al. found that the obstructing effect in ureter was due to a circular rather than longitudinal orientation of muscle fibers, and the
degree of obstruction was related to the number of circular fibers17. Excess
collagen deposition is presumed to play an important role in the enlargement
of the ureter18. Increased collagen alters cell-to-cell junctions, and as a result
myoelectrical propagation and peristalsis are also changed19. In a recent study,
Lee et al. reported on the amount and subtypes of collagen in megaureter and control; however, no statistically significant difference in the ratio of collagen
to muscle was observed6. However, in a report by Kajbafzadeh et al.
decreased muscular and increased collagen components, as well as an increased smooth muscle cell apoptosis index, were discovered at the site of
ureteropelvic junction obstruction20. Therefore, proteomic analysis was used
in this study to analyze differential gene expression at the protein level by comparing the 2-DE patterns of proteomes in control and megaureter smooth muscle cells. Proteome analysis is advantageous in that it can simultaneously separate and display thousands of proteins at a time; moreover, meaningful data on selected proteins can be analyzed through mass spectrometric protein
identification21. In this study, TPM1 and smooth muscle protein was
over-expressed in megaureter compared to control ureter. (Figure 3, Table 1) Western blot analysis was carried out to reconfirm the protein expression, and as a result, TPM1 and smooth muscle protein expression was statistically increased. (*P<0.05) (Figure 4) TPM1, a selected protein from the proteomic analysis, is well known as an actin-binding protein which regulates cell motility and contractility. Thin filament-associated proteins play important
23
roles in actin-myosin interaction and smooth muscle contraction22.
Accordingly, TPM1 makes the actin filament cooperative, which is associated
with a two to three fold increase in Vmax of the actin activated ATPase activity
of smooth muscle myosin. Observing transgenic rats, which had mutations at the TPM1 gene, Dirk et al. explained that changes in TPM1 may interrupt the regulation of myocardial contraction and relaxation, and finally induce
familial hypertrophic cardiomyopathy23. Also Mannikarottu et al. found that
filament-associated proteins, including TPM1, enhanced detrusor smooth muscle (DSM) hypertrophy induced by partial bladder outlet obstruction
(PBOO)24. Thin filament associated proteins including calponin, tropomyosin
and caldesmon were also increased in a diabetic rabbit model as well25. The
contractile properties of actin stress fibers may also determine the structure of
associated focal adhesion26. Creed et al. reported that TPM1 induces increases
in filopodia and also generate a functionally distinct filament population27. To
investigate the influence of TPM1 in SMCs, transfection was performed using the LTX method. After transfection, control SMCs exhibited distinct morphological features. The edges of the SMCs, focal adhesion, were especially more developed in the TPM1 increased group. (Figure 7 enlargement) Furthermore, the expression rate of TPM1 was significantly reinforced in MU and transfected SMCs. (Figure 5) TPM1 has been also studied in an attempt to explain cancer cell metastasis in a variety of cancer cell lines. High-grade tumor cells of the breast, prostate and bladder etc. exhibited a decreased rate of tropomyosin expression compared to normal
tissues28-30. It is well known that the loss of actin stress fibers is related to cell
transformation and metastasis. TPM1 stabilizes focal adhesion and inhibits cell migration; therefore, TPM1 is considered a cancer cell suppressor. Raval et al. revealed that the over-expression of HMW-tropomyosin in transformed or tumor cells suppressed anchorage-independent cell growth and even lead to
24
regulated by various factors including integration signaling, focal adhesion
and cell-cell interaction32. Loss of tropomyosin1 in breast tumors has been
shown to confer resistance to anoikis and induce rearrangement of
microfilaments, which facilitate survival of neoplastic cells33. In the present
study, the rate of cell apoptosis was markedly increased in the transfected group and megaureter when compared to the control group. The percentage of apoptosis was almost 50% in transfected SMCs, whereas, it was 27.4% and 10.7% in the megaureter and control group respectively. (Figure 6) Apoptosis of smooth muscle cell promotes the tissue remodeling and repair via
activation of cell migration, proliferation and collagen synthesis34. In a prior
study, Payabvash et al. discovered that the muscular contents were reduced in obstructed vesicoureteral junctions, suggesting that the substitution of connective tissue may lead to functional obstruction in primary obstructive
megaureter7.
In present study, we compared the expression rate of proteins in megaureter and control ureter SMCs by proteomic analysis. Although this study was limited in its capacity to explain the pathway of gene regulation, TPM1, which was found to be a statistically over-expressed protein in megaureter SMCs, was shown to be a significant factor to the development of obstructive megaureter.
25 V. CONCLUSION
In this context, it was interesting to note that TPM1 was over-expressed in megaureter SMCs when compared to control ureter SMCs. As previously shown, increased TPM1 alters the development of microfilaments and focal adhesion. These alterations may interrupt cell-cell and cell-matrix signal pathways, thereby inducing anoikis of SMCs. Thereafter, because of decreased migration rate in SMCs, the empty spaces left by dead cells are filled with connective tissue rather than myocytes, consequentially leading to the development of obstructive megaureter.
26 REFERENCES
1. Hodges SJ, Werle D, McLorie G, Atala A. Megaureter. TheScientificWorldJournal 2010;10:603-12.
2. Report of working party to establish an international nomenclature for the large ureter. Birth defects original article series 1977;13:3-8. 3. Shokeir AA, Nijman RJ. Primary megaureter: current trends in
diagnosis and treatment. BJU international 2000;86:861-8.
4. Wilcox D, Mouriquand P. Management of megaureter in children. European Urology 1998;34:73-8.
5. Merlini E, Spina P. Primary non-refluxing megaureters. Journal of Pediatric Urology 2005;1:409-17.
6. Lee BR, Silver RI, Partin AW, Epstein JI, Gearhart JP. A quantitative histologic analysis of collagen subtypes: the primary obstructed and refluxing megaureter of childhood. Urology 1998;51:820-3. 7. Payabvash S, Kajbafzadeh AM, Tavangar SM, Monajemzadeh M,
Sadeghi Z. Myocyte apoptosis in primary obstructive megaureters: the role of decreased vascular and neural supply. The Journal of Urology 2007;178:259-64
8. Spudich JA, Huxley HE, Finch JT. Regulation of skeletal muscle contraction. II. Structural studies of the interaction of the tropomyosin-troponin complex with actin. Journal of Molecular Biology 1972;72:619-32.
9. Lehman W, Hatch V, Korman V, Rosol M, Thomas L, Maytum R, et al. Tropomyosin and actin isoforms modulate the localization of tropomyosin strands on actin filaments. Journal of Molecular Biology 2000;302:593-606.
10. Bach CT, Schevzov G, Bryce NS, Gunning PW, O'Neill GM. Tropomyosin isoform modulation of focal adhesion structure and cell migration. Cell Adhesion & Migration 2010;4:226-34.
11. Winder SJ, Ayscough KR. Actin-binding proteins. Journal of Cell Science 2005;118:651-4.
27
12. McKillop DF, Geeves MA. Regulation of the interaction between actin and myosin subfragment 1: evidence for three states of the thin filament. Biophysical Journal 1993;65:693-701.
13. Kamm KE, Stull JT. The function of myosin and myosin light chain kinase phosphorylation in smooth muscle. Annual Review of Pharmacology and Toxicology 1985;25:593-620.
14. Wen LP, Fahrni JA, Troie S, Guan JL, Orth K, Rosen GD. Cleavage of focal adhesion kinase by caspases during apoptosis. The Journal of Biological Chemistry 1997;272:26056-61.
15. Matsumura F, Yamashiro-Matsumura S. Purification and characterization of multiple isoforms of tropomyosin from rat cultured cells. The Journal of Biological Chemistry 1985;260:13851-9.
16. Hanash S. Disease proteomics. Nature 2003;422:226-32.
17. Tanagho EA, Smith DR, Guthrie TH. Pathophysiology of functional ureteral obstruction. The Journal of Urology 1970;104:73-88.
18. Gosling JA, Dixon JS. Functional obstruction of the ureter and renal pelvis. A histological and electron microscopic study. British Journal of Urology 1978;50:145-52.
19. Weiss RM, Lytton B. Vesicoureteral reflux and distal ureteral obstruction. The Journal of Urology 1974;111:245-9.
20. Kajbafzadeh AM, Payabvash S, Salmasi AH, Monajemzadeh M, Tavangar SM. Smooth muscle cell apoptosis and defective neural development in congenital ureteropelvic junction obstruction. The Journal of Urology 2006;176:718-23; discussion 23.
21. Karas M, Hillenkamp F. Laser desorption ionization of proteins with molecular masses exceeding 10,000 daltons. Analytical Chemistry 1988;60:2299-301.
22. Chacko S, Eisenberg E. Cooperativity of actin-activated ATPase of gizzard heavy meromyosin in the presence of gizzard tropomyosin. The Journal of Biological Chemistry 1990;265:2105-10.
28
et al. alpha-Tropomyosin mutations Asp(175)Asn and Glu(180)Gly affect cardiac function in transgenic rats in different ways. American Journal of Physiology Regulatory, Integrative and Comparative Physiology 2004;287:R685-95.
24. Mannikarottu AS, Disanto ME, Zderic SA, Wein AJ, Chacko S. Altered expression of thin filament-associated proteins in hypertrophied urinary bladder smooth muscle. Neurourology and Urodynamics 2006;25:78-88.
25. Mannikarottu AS, Changolkar AK, Disanto ME, Wein AJ, Chacko S. Over expression of smooth muscle thin filament associated proteins in the bladder wall of diabetics. The Journal of Urology 2005;174:360-4.
26. O'Neill GM. The coordination between actin filaments and adhesion in mesenchymal migration. Cell Adhesion & Migration 2009;3:355-7. 27. Creed SJ, Desouza M, Bamburg JR, Gunning P, Stehn J. Tropomyosin
isoform 3 promotes the formation of filopodia by regulating the recruitment of actin-binding proteins to actin filaments. Experimental Cell Research 2011;317:249-61.
28. Franzen B, Linder S, Uryu K, Alaiya AA, Hirano T, Kato H, et al. Expression of tropomyosin isoforms in benign and malignant human breast lesions. British Journal of Cancer 1996;73:909-13. 29. Hendricks M, Weintraub H. Tropomyosin is decreased in
transformed cells. Proceedings of the National Academy of Sciences of the United States of America 1981;78:5633-7.
30. Wang FL, Wang Y, Wong WK, Liu Y, Addivinola FJ, Liang P, et al. Two differentially expressed genes in normal human prostate tissue and in carcinoma. Cancer Research 1996;56:3634-7.
31. Zheng Q, Safina A, Bakin AV. Role of high-molecular weight tropomyosins in TGF-beta-mediated control of cell motility. International Journal of Cancer 2008;122:78-90.
32. Frisch SM, Ruoslahti E. Integrins and anoikis. Cell Biology 1997;9:701-6.
29
33. Raval GN, Bharadwaj S, Levine EA, Willingham MC, Geary RL, Kute T, et al. Loss of expression of tropomyosin-1, a novel class II tumor suppressor that induces anoikis, in primary breast tumors. Oncogene 2003;22:6194-203.
34. Yu H, Clarke MC, Figg N, Littlewood TD, Bennett MR. Smooth muscle cell apoptosis promotes vessel remodeling and repair via activation of cell migration, proliferation, and collagen synthesis. Arteriosclerosis, Thrombosis, and Vascular Biology 2011;31:2402-9.
30
ABSTRACT (IN KOREAN)
단백질체 연구기법을 통해 거대요관과 관련한 단백질의
규명과 이를 이용한 치료가능성
<지도교수 한 상 원>
연세대학교 대학원 의과학과
전 지 희
거대요관증은 선천적 혹은 후천적으로 발견되는 요관의 확장에 의한 것으로, 이전의 연구에서는 평활근 세포(smooth muscle)의 감소와 결합조직(connective tissue)이 증가되는 것으로 알려져 있다. 일부 연구자들에 의해서 패쇄성 거대요관증과 역류성 거대요관증에 대한 연구 결과가 발표되고 있지만 대부분의 연구는 조직적 수준에 머물고 있으며 따라서 그 병인론에 대해서는 명확하지 않다. 본 연구에서는 거대요관과 정상요관에서 유래된 평활근 배양 세포에서 단백질체 연구기법(Proteomics)을 이용하여 변화된 단백질을 분석하고 그 기능을 연구함으로써 거대요관의 병인론을 밝히고자 하였다. 패쇄성 거대요관증으로 진단된 5명의 환아와 정상 대조군으로서 5명의 환 아 요관 조직으로부터 평활근 세포를 10% fetal bovine serum(FBS)와 1% antibiotics가 포함된 M199 media에서 배양하였다. 배양된 세포에서 단백 질을 추출하여 2D gel electrophoresis를 실시하여 각 세포에서의 단백질 발현량을 PDQuest 프로그램을 이용하여 분석하였고 Nanoflow LC-ESI-MS-MS를 이용하여 단백질 프로파일을 분석하였다. 평활근세포의 수축성 에 관여하는 단백질을 우선적으로 선택하여 단백질 기능분석 규명을 위한 연구를 진행하였다. 증가된 단백질 중 α-Tropomyosin (TPM1)을 선정하 였고 이를 transfection하여 정상 평활근세포에서 과 발현시켰다. 세포 내 스트레스 섬유의 증가로 인한 세포 형태의 확연한 변화를 관찰 할 수 있었31 으며, 거대요관과 transfection된 평활근 세포에서 자살세포가 증가하는 것 이 확인되었다. 결과를 종합하면, 거대요관의 평활근 세포는 세포 내 단백질 TPM1 발현양의 변화로 인해 세포의 형태와 수축을 담당하는 기능 조절에 변화가 발생하고, 결국 이는 평활근세포의 사멸을 유도한다. 사멸된 평활근세포로 인한 빈자리는 이동성이 떨어진 평활근세포 대신 결합조직이 채우게 되고, 이러한 변화는 평활근세포와 결합조직의 비율을 변화시켜 요관의 섬유화를 통한 확장을 유도하는 것으로 보인다. 이 연구를 통해, 잠재적으로 TPM1은 거대요관 조직의 변화에 따른 섬유화를 방지할 수 있으며 다른 조직에서의 섬유화 연구에도 응용 가능할 것으로 보인다. --- 핵심되는 말: 거대요관, 평활근 세포, 섬유화, 단백질체, TPM1