저작자표시-비영리-변경금지 2.0 대한민국 이용자는 아래의 조건을 따르는 경우에 한하여 자유롭게 l 이 저작물을 복제, 배포, 전송, 전시, 공연 및 방송할 수 있습니다. 다음과 같은 조건을 따라야 합니다: l 귀하는, 이 저작물의 재이용이나 배포의 경우, 이 저작물에 적용된 이용허락조건 을 명확하게 나타내어야 합니다. l 저작권자로부터 별도의 허가를 받으면 이러한 조건들은 적용되지 않습니다. 저작권법에 따른 이용자의 권리는 위의 내용에 의하여 영향을 받지 않습니다. 이것은 이용허락규약(Legal Code)을 이해하기 쉽게 요약한 것입니다. Disclaimer 저작자표시. 귀하는 원저작자를 표시하여야 합니다. 비영리. 귀하는 이 저작물을 영리 목적으로 이용할 수 없습니다. 변경금지. 귀하는 이 저작물을 개작, 변형 또는 가공할 수 없습니다.
i
A THESIS
FOR THE DEGREE OF MASTER OF SCIENCE
Structural and functional delineation of two glutathione
S-Transferases from Disk abalone (Haliotis discus discus)
AND
Two phospholipid scramblase 1–related proteins from Red
lip mullet (Liza haematocheila); deciphering their
transcriptional responses against immune stimulants
Wijamunige Gayashani Sandamalika
Department of Marine Life Sciences
GRADUATE SCHOOL
JEJU NATIONAL UNIVERSITY
REPUBLIC OF KOREA
ii
Structural and functional delineation of two glutathione
S-Transferases from Disk abalone (Haliotis discus discus)
AND
Two phospholipid scramblase 1–related proteins from Red lip mullet
(Liza haematocheila); deciphering their transcriptional responses
against immune stimulants
Wijamunige Gayashani Sandamalika
(Supervised by Professor Jehee Lee)
A thesis submitted in partial fulfillment of the requirement for the degree of
MASTER OF SCIENCE
February 2019
The thesis has been examined and approved by
……… Thesis director, Myoung-Jin Kim, (PhD) - Research professor,
Fish Vaccine research Center, Jeju national university
………. Qiang Wan, (PhD) -Research professor,
Fish Vaccine research Center, Jeju national university
………... Jehee Lee, (PhD) -professor of Marine life sciences,
School of Marine Biomedical sciences, Jeju national university
2018/11/28 Date
Department of Marine Life Sciences
Graduate School
Jeju National University
Republic of Korea
i
Acknowledgement
Though the following dissertation is an individual work, I could never have researched the heights or explored the depths without the support, guidance and efforts lot of people.
First and foremost, I would like to express my deepest sincere gratitude to my supervisor Professor Jehee Lee, who gave me a precious opportunity to commence my post graduate studies at the Marine Molecular Genetics Lab in Jeju National University and directing me to the field of genetics. I am especially grateful to Dr. Thanthrige Thiunuwan priyathilaka for his systemic guidance and great effort he put into training me in the scientific field by improving my laboratory experiments and writings.
Beside my advisors, I would like to thank my thesis panel director Dr. Myoung-Jin Kim and Dr. Qiang Wan from Fish Vaccine Research Center, Jeju National University for being my thesis committee members. I sincerely thank all my lab members and faculty members for giving me various supports by instructing and providing laboratory facilities. And I am also thankful to my Korean and Sri Lankan friends for supporting me to fulfill my laboratory works and their kind co-operation to completion of my work.
My sincere thanks to National Fisheries Research and Development Institute for providing research grant to accomplish our studies.
I would like to express my eternal appreciation towards all my family members who always been with me and giving moral support to achieve my target.
ii
Contents
Acknowledgement ... i
Summary ... iv
List of figures ... viii
List of Tables ... x
CHAPTER 1: ... 1
Structural and functional delineation of two glutathione S-Transferases from Disk abalone (Haliotis discus discus)... 1
1. Introduction ... 2
2. Materials and Methods ... 7
2.1 Experimental animals and tissue collection ... 7
2.2 Chemicals & reagents ... 7
2.3 Identification & sequence analysis of GSTs from Disk Abalone ... 7
2.4 Tissue isolation and immune challenge experiment ... 9
2.5 RNA extraction and first-strand cDNA synthesis ... 9
2.6 Transcriptional analysis –Quantitative real-time PCR ... 10
2.7 Cloning of GSTs into the pMAL-c5X expression vector ... 11
2.8 Overexpression and purification of recombinant AbGST proteins ... 12
2.9 GST enzyme assay ... 12
2.10 Michaelis-Menten Kinetics ... 13
2.11 The effect of temperature, pH and inhibitors on rAbGSTs activity ... 13
2.12 Disk diffusion assay ... 13
2.13 Statistical Analysis ... 14
3. Results ... 15
3.1 Molecular characterization of AbGSTs ... 15
3.2 Homology analysis and phylogenetic relationship ... 16
3.3 Tertiary structural model of AbGSTs ... 21
3.4 Tissue-specific expression of AbGSTs... 24
3.5 AbGSTs expressions against pathogenic stress ... 26
3.6 Construction of recombinant AbGST proteins and purification ... 35
3.7 Specific activity and kinetic assay ... 36
3.8 Effect of temperature, pH, and an inhibitor on GSTs activity ... 38
3.9 Disk diffusion assay ... 42
iii
CHAPTER 2: ... 60
Two phospholipid scramblase 1–related proteins (PLSCR1like-a & -b) from Liza haematocheila: Molecular and transcriptional features and expression analysis after immune stimulation... 60
1. Introduction ... 61
2. Materials and methods ... 65
2.1. Experimental fish rearing and tissue collection ... 65
2.2. RNA extraction and cDNA synthesis ... 66
2.3. Identification and sequence analysis of MuPLSCR1like proteins ... 66
2.4. Transcriptional analysis by Quantitative real time PCR (qPCR) ... 67
3. Results ... 69
3.1. Identification and characterization of MuPLSCR1like-a and b ... 69
3.2. Homology analysis of MuPLSCR1like-a and -b ... 71
3.3. The 2D and 3D structural analysis of MuPLSCR1like-a & -b ... 73
3.4. Construction of the phylogenetic tree ... 75
3.5. Tissue distribution analysis of MuPLSCR1like-a and -b ... 76
3.6. Expression analysis of MuPLSCR1like proteins after immune stimulation ... 78
4. Discussion ... 80
5. Conclusion ... 88
iv
Summary
Disk abalone (Haliotis discus discus) and redlip mullet (Liza haematocheila) are two species which are very important in the aquaculture industry, especially in South Korea. However, both these key species are highly vulnerable to the spreading of infectious diseases caused by bacteria, viruses and parasites. Relatively high stock densities and poor environmental conditions in the culture farms resulted with mass mortalities ending with financial losses. Therefore, understanding the immune responses against infectious diseases in abalones and redlip mullets is essential for a sustainable development of the aquaculture industry. Therefore, in this study we have identified and studied two types of genes: Glutathione S- transferases and phospholipid scramblases from disk abalone and redlip mullet for the understanding of their characteristic features and behaviors in line with innate immune system.
Glutathione S-transferases (GSTs) are a superfamily of detoxification enzymes that primarily catalyze the nucleophilic addition of reduced glutathione to both endogenous and exogenous electrophiles. GSTs can convert toxic substances into less reactive and more hydrophilic products to facilitate their excretion. Currently, based on their primary and tertiary structures, substrate/inhibitor specificity and immunological cross-reactivity, cytosolic GSTs have been grouped into more than ten classes, which have been designated as classes α, β, δ, ζ, θ, μ, ρ, π, σ, τ, ϕ, ɛ and Ω. In this study we are dealing with GST theta (θ) and kappa (κ) revealing their molecular and transcriptional properties. Characterization of AbGST-θ revealed with 226 amino acids, 26.6 kDa of predicted molecular mass and 8.9 of theoretical isoelectric point. As illustrated in the multiple sequence alignment, eight glutathione binding sites (G-sites) and ten substrate binding sites (H-(G-sites) were identified in the well-distinct N-terminal and C-N-terminal domains of AbGST-θ, respectively. AbGST-θ exhibited its
v
highest sequence identity with Mizuhopecten yessoensis (59.1%) and the phylogenetic tree clearly positioned AbGST-θ with pre-defined GST-θ molluscan homologues. The
AbGST-θ was highly expressed in digestive tract of un-challenged abalones. Upon
challenge experiment, AbGST-θ showed significant modulations in their transcriptional levels depending on the time and the tissue type. The biochemical properties of AbGST-θ were identified to be 37 ℃ of optimum temperature and 7.5 of optimum pH. The determined enzyme kinetic parameters of AbGST-θ showed low affinity towards 1-Chloro-2,4-dinitrobenzene (CDNB) and glutathione (GSH) as substrates. Nonetheless with Cibacron blue, IC50 (half maximal inhibitory concentration) was calculated to be 0.08 μM while observing 100% inhibition with 100 μM. Furthermore, AbGST-θ resulted with significant protection ability towards H2O2, CdCl2, CuSO4 and ZnCl2 in the disk diffusion assay.
The predicted AbGSTκ protein consists of 227 amino acids, with a predicted molecular weight of 25.6 kDa and a theoretical isoelectric point (pI) of 7.78. In silico analysis reveals that AbGSTκ is a disulfide bond formation protein A (DsbA), consisting of a thioredoxin domain, GSH binding sites (G-sites), and a catalytic residue. In contrast, no hydrophobic ligand binding site (H-site), or signal peptides, were detected. AbGSTκ showed the highest sequence identity with the orthologue from pufferfish (Takifugu obscurus) (60.0%). In a phylogenetic tree, AbGSTκ clustered closely together with other fish GSTκs, and was evolutionarily distanced from other cytosolic GSTs. The predicted three-dimensional structure clearly demonstrates that the dimer adopts a butterfly-like shape. A tissue distribution analysis revealed that GSTκ was highly expressed in the digestive tract, suggesting it has detoxification ability. Depending on the tissue and time, AbGSTκ showed different expression patterns, and levels of expression, following challenge of the abalone with
vi
immune stimulants. Enzyme kinetics of the purified recombinant proteins demonstrated its conjugating ability using 1-Chloro-2,4-dinitrobenzene (CDNB) and glutathione (GSH) as substrates, and suggested it has a low affinity for both substrates. The optimum temperature and pH for the rAbGSTκ GSH: CDNB conjugating activity were found to be 35°C and pH 8, respectively indicating that the abalone is well adapted to a wide range of environmental conditions. Cibacron blue (100 µM) was capable of completely inhibiting rAbGSTκ (100%) with an IC50 (half maximal inhibitory concentration) of 0.05 µM. A disk diffusion assay revealed that rAbGSTκ could significantly protect cells from H2O2, CdCl2, and ZnCl2.
Phospholipid scramblases (PLSCRs) are a family of transmembrane proteins known
to be responsible for Ca2+-mediated bidirectional phospholipid translocation in the
plasma membrane. Apart from the scrambling activity of PLSCRs, recent studies revealed their diverse other roles, including antiviral defense, tumorigenesis, protein– DNA interactions, apoptosis regulation, and cell activation. Nonetheless, the biological and transcriptional functions of PLSCRs in fish have not been discovered to date. Therefore, in this study, two new members related to the PLSCR1 family were
identified in the red lip mullet (Lizahaematocheila) as MuPLSCR1like-a and
MuPLSCR1like-b, and their characteristics were studied at molecular and
transcriptional levels.
Sequence analysis revealed that MuPLSCR1like-a and MuPLSCR1like-b are composed of 245 and 228 amino acid residues (aa) with the predicted molecular weights of 27.82 and 25.74 kDa, respectively. A constructed phylogenetic tree showed that MuPLSCR1like-a and MuPLSCR1like-b are clustered together with other known PLSCR1 and -2 orthologues, thus pointing to the relatedness to both PLSCR1 and PLSCR2 families. Two-dimensional (2D) and 3D graphical representations illustrated
vii
the well-known 12-stranded β-barrel structure of MuPLSCR1like-a and MuPLSCR1like-b with transmembrane orientation toward the phospholipid bilayer. In analysis of tissue-specific expression, the highest expression of MuPLSCR1like-a was observed in the intestine, whereas MuPLSCR1like-b was highly expressed in the brain, indicating isoform specificity. Of note, we found that the transcription of
MuPLSCR1like-a and MuPLSCR1like-b was significantly upregulated when the fish
were stimulated with poly(I:C), suggesting that such immune responses target viral infections. Overall, this study provides the first experimental insight into the characteristics and immune-system relevance of PLSCR1-related genes in red lip mullets.
Key words: glutathione S- transferase, theta, kappa, disk abalone, Haliotis discus
discus, Phospholipid scramblase 1 like, PLSCR, Red lip mullet, Liza haematocheila,
viii
List of figures
Fig. 1. Multiple sequence alignment of the amino acid sequences of AbGST-θ and its orthologs from different organisms. ... 17 Fig. 2. Multiple sequence alignment of the amino acid sequences of AbGSTκ and its orthologs from different organisms. ... 18 Fig. 3. A phylogenetic tree constructed using the neighbor-joining method based on different classes of GSTs. ... 19 Fig. 4. A phylogenetic tree constructed using the neighbor-joining method based on different classes of GSTs. ... 20 Fig. 5.Surface representations of human GST-θ (B, D) and AbGST-θ (C, E) highlighting the C-terminal tails in red color. ... 22 Fig. 6. Predicted three-dimensional structure of AbGSTκ. ... 23 Fig. 7. Tissue specific transcriptional profile of A) AbGST-θ and B) AbGSTκ in disk
abalone (Haliotis discus discus).. ... 25 Fig. 8. Relative mRNA expression, analyzed by qPCR of AbGST-θ over time in gill tissue (A, B, C), and hemocytes (D, E, F) in response to challenges with LPS (A, D), poly I:C (B, E), and Vibrio parahaemolyticus (C, F). ... 30 Fig. 9. Relative mRNA expression, analyzed by qPCR of AbGST-κ over time in gill tissue (A, B, C), and hemocytes (D, E, F) in response to challenges with LPS (A, D), poly I:C (B, E), and Vibrio parahaemolyticus (C, F). ... 34 Fig. 10. SDS-PAGE analysis of purified A) rAbGST-θ and B) AbGSTκ. ... 36 Fig. 11. A) The effect of pH, B) temperature and C) inhibitor (Cibacron Blue)
concentration on the GSH conjugating activity of AbGST-θ. ... 39 Fig. 12. Effect of A) Temperature, B) pH, and C) Inhibitor (Cibacron Blue) concentration on the GSH conjugating activity of AbGSTκ. ... 41 Fig. 13. Disk diffusion assay of AbGST-θ against E. coli BL21. ... 42
ix
Fig. 14. Disk diffusion assay of AbGSTκ against E. coli BL21. ... 43 Fig. 15. Multiple-sequence alignment of the amino acid sequences of
MuPLSCR1like-a & -b and its orthologs from different species. ... 70 Fig. 16. Predicted 3D structures of MuPLSCR1like-a & -b, respectively. ... 73 Fig. 17. Graphical representation of the predicted topology of MuPLSCR1like-a & -b
with respect to the lipid bilayer. 74
Fig. 18. A phylogenetic tree constructed by the neighbor-joining method based on different classes of PLSCRs.. ... 75 Fig. 19. Tissue-specific transcriptional profiles of MuPLSCR1like-a & -b in red lip mullets. ... 77 Fig. 20. Relative mRNA expression of MuPLSCR1like-a and MuPLSCR1like-b analyzed by qPCR over time in the spleen of red lip mullets (A–F) in response to challenges with poly(I:C) (A, D), LPS (B, E), and L. garvieae (C, F). ... 78 Fig. 21. Relative mRNA expression of MuPLSCR1like-a and MuPLSCR1like-b, analyzed by qPCR over time in the head kidney of red lip mullets (A–F) in response to challenges with poly(I:C) (A, D), LPS (B, E), or L. garvieae (C, F). ... 79
x
List of Tables
Table 1. Sequences of primers used in this study ... 11 Table 2. Pairwise identity (I%), similarity (S%), and gaps (G%) of disk abalone
GST-θ protein toward selected orthologs at amino acid levels ... 16 Table 3.Substrate specific parameters at 25°C, when the substrate and GSH concentrations were 1.0 mM each, and the specific activities of AbGST-θ and AbGSTκ towards the different substrates. ... 37 Table 4. Optimum temperature, pH, Michaelis-Menten kinetic parameters, and inhibitor IC50 values for AbGST-θ and AbGSTκ using CDNB as the substrate (n=3)... 38 Table 5. Sequences of primers used in this study ... 67 Table 6. Pairwise identity (I%), similarity (S%), and gaps (G%) of red lip mullet
1
CHAPTER 1:
Structural and functional delineation of two glutathione
S-Transferases from Disk abalone (Haliotis discus discus)
2
1. Introduction
The marine environment is a complex and dynamic environment filled with multiple stressors including chemical, physical and biological stresses, resulting from both natural and human anthropogenic activities (MURRAY et al., 2014). Marine organisms have inherited several mechanisms and adaptations to tolerate these challenges in order to survive (Guo et al., 2015). Cellular detoxification mechanisms are one such mechanism. Generally, a cellular detoxification mechanism consists of four distinct phases which are temporally and spatially distinct. Phase zero (0) includes the uptake of xenobiotics by membrane transport proteins; phase I includes enzymatic bio-activation of the parent compounds through oxidation-reduction reactions; phase II includes enzyme(s) mediated conjugation of phase I metabolites, or parent compounds, to water-soluble moieties; and finally, phase III involves the efflux of parent compounds, or metabolites, from cells by membrane transporters (Hodgson, 2010).
Glutathione S-transferases (GSTs; EC 2.5.1.18) are enzymes that are found in many organisms including microbes, insects, plants, fish, birds and mammals, and contribute to phase II detoxification in their respective species (Hayes and Pulford, 1995). In keeping with other detoxification enzymes, GSTs protect the organism by removing harmful substances by converting them into non-reactive water-soluble substances (Hayes and Pulford, 1995). These enzymes also have non-catalytic functions, including the binding of hydrophobic non-substrate ligands, modulation of signaling processes, regulation of stress-activated cell signaling pathways, biosynthesis of leukotriene and prostaglandins, and catabolism of aromatic amino acids (Hayes et al., 2005; Hayes and Pulford, 1995).
3
mitochondrial, or MAPEG (membrane associated proteins in eicosanoid and glutathione metabolism) subfamily members (Hayes et al., 2005). Based on their amino acid sequence, structure, immunological cross reactivity, evolutionary relationship, catalytic, and substrate specificity, cytosolic GSTs are further subdivided into several classes: alpha, beta, delta, epsilon, zeta, theta, mu, nu, pi, sigma, tau, phi, rho, kappa, omega, elongation factor 1 gamma, dehydroascorbate reductase, and tetrachlorohydroquinone dehalogenase (Frova, 2006). Microsomal GST and leukotriene C4 synthase are categorized as belonging to the MAPEG group. The GSTs from each family have short regions of high identity in common, and share a common evolutionary pathway (Li et al., 2005). GSTs generally share greater than 60% sequence identity within a class, and less than 30% among distinct classes (Li et al., 2005). Over the past years the three-dimensional structures of soluble GSTs in several classes have been reported (Board et al., 2000; Cameron et al., 1995; Ji et al., 1992; Oakley et al., 2001; Polekhina et al., 2001; Rossjohn et al., 1998).
Cytosolic GSTs can be identified as homodimers or heterodimers consisting with two distinct domains of 23–30 kDa in each monomer as :a N-terminal thioredoxin-like domain and a C-terminal alpha helical domain (Kasthuri et al., 2013). The dimer interface may have variations as hydrophobic ball-and-socket (α, μ, π, ϕ classes) or hydrophilic nature (θ, σ, β, classes). The thioredoxin-like domain is responsible for GSH binding with the presence of specific substrate, hence termed as GSH-binding sites (G-site) (Allocati, 2018). The catalytic activity of these G-sites are controlled by tyrosine (Tyr), serine (Ser), or cysteine (Cyst) residues, considered as critical mediators of glutathione conjugation (Ji et al., 1992). The C-terminal domain together with N-terminal domain are involving in the shaping of hydrophobic substrate binding sites (H-site) (Allocati, 2018). Although the G-site sequences are highly conserved
4
among the GST classes, H-sites had exhibited significant variations in their sequences, which allows the diversification of the substrate specificity (Ji et al., 1992).
GST theta (θ) class was first identified and characterized using 1-menaphthyl sulphate and 1,2-epoxy-3-(ρ-nitrophenoxy) propane as substrates (Motoyama and Dauterman, 1977). However, GST-θ is considered as the most ancient group which consists with
two different types: GST-θ1 and GST-θ2 sharing 55% sequence identity in their
protein structure. According to the studies of rat, although GSTs are expressing an organ-specific pattern in their tissue distribution, most of the examined GST-θ were observed in liver, lung, blood, kidney, spleen, brain, testis, ovary, heart and small intestine (Hayes et al., 2005). In human studies, GST-θ1 and GST-θ2 have been identified, cloned and provided evidences for their ability to detoxify carcinogenic chemicals and chemotherapeutic agents (Landi, 2000). Considering about marine invertebrates, GST-θ has been characterized only from freshwater prawn (Macrobrachium rosenbergii) (Arockiaraj et al., 2014) manila clam (Ruditapes
philippinarum) (Saranya Revathy et al., 2012) and sea cucumber (Apostichopus japonicus) (Shao et al., 2017), up to date. Out of them, only the studies of GST-θ from
manila clam and sea cucumber are consisted with the recombinant protein expression
and the functional studies. Moreover, apart from the xenobiotic detoxification of
GSTs, these studies have further revealed the innate immune responses of GST-θ class by inducing the organisms with viral and bacterial pathogens.
However, among the cytosolic GSTs, kappa is the least studied (Harris et al., 1991). The GST kappa (GSTκ) proteins are an ancient protein family, with orthologues in bacteria and eukaryotes. The protein was identified and isolated for the first time from the mitochondrial matrix of rat liver (Harris et al., 1991). Recently, the structure of a kappa class GST from rat mitochondrion (rGSTκ) in complex with glutathione (GSH)
5
was reported, which shows a folding topology different from that of the other GST classes (Ladner et al., 2004). These enzymes have recently been demonstrated to localize in peroxisomes (Morel et al., 2004), and are proposed to be present in the endoplasmic reticulum in adipose tissue (Liu et al., 2008; Zhou et al., 2010). The kappa class GSTs possess peroxidase activity, which permits the detoxification of lipid peroxides and reactive oxygen species (ROS) generated from lipid metabolism and the respiratory chain (Bonekamp et al., 2009). GST kappa possesses a disulfide bond formation protein A (DsbA) domain, consisting of a thioredoxin domain and a protein disulfide isomerase from Escherichia coli, thus it is considered as orthologous to bacteria (Martin, 1995). The expression, purification, and crystal structure of human kappa class GST (hGSTκ) has been determined by the multiple-isomorphous replacement method (Li et al., 2005), and suggests that within the GST superfamily, the kappa class of GST is more closely related to the θ class of enzymes. Although many GST isoforms from several aquatic organisms have been previously studied, reports on GSTκ are very rarely available. GSTκ has been studied in Macrobrachium
rosenbergii, and appears to possess a detoxification capability that can overcome
various abiotic and biotic oxidative stressors (Chaurasia et al., 2016). In zebrafish, an overall study of GST superfamily has been conducted and showed the structural and functional characteristic features of GSTκ (Glisic et al., 2015). The effect of a cyanobacterial crude extract on the transcription of GSTκ has been studied in goldfish (Carassius auratus), with the result that there was differential expression in various tissues (Hao et al., 2008). However, to date there have been no detailed reports of GSTκ from mollusks.
Abalones are slow growing marine gastropods that live in the coastal intertidal zone, and are a key element in the marine ecosystem, as well as in the fisheries and
6
aquaculture industry. Because of the dynamic environmental and pathogenic conditions in the intertidal zone that create numerous environmental stresses, and the fact that abalone population is highly sensitive to environmental variations, this has led to a decrease in abalone survival (Elvitigala et al., 2015). In parallel, in the abalone farming industry, mass mortality has occurred because of poor water quality, critical climate changes, and unexpected disease outbreaks (Cook, 2014). In the present study, using a variety of molecular bioinformatics tools, we have characterized GST theta (AbGSTθ) and kappa (AbGSTκ) from the disk abalone (Haliotis discus
discus), which is widely cultured in South Korea. Functional studies were carried out
with the recombinant proteins to determine their enzymatic and antioxidant properties, and an analysis of the stress mediated response were also conducted. In addition, the transcriptional levels of AbGSTs were determined under normal physiological conditions and immunologically challenged conditions in order to evaluate the involvement of AbGSTθ and AbGSTκ in the abalone’s immunity.
7
2. Materials and Methods
2.1 Experimental animals and tissue collection
Healthy disk abalones (Haliotis discus discus), with an average body weight of 50 ± 5 g, were obtained from a commercial abalone farm in Jeju Island, Republic of Korea. The abalones were acclimatized to the laboratory conditions by maintenance in 60 L flat-bottomed fiberglass tanks with aerated sea water at temperature of 20 ± 1°C and 34 ± 0.6 psµ of salinity for a one-week period and fed with marine seaweed (Undaria
pinnatifida).
2.2 Chemicals & reagents
SYBR Premix Ex Taq TM was purchased from TaKaRa, Japan. Tri ReagentTM (Sigma
-Aldrich, USA) was used for total RNA extraction. For the immune challenge experiments, polyinosinic: polycytidylic acid (poly (I: C)) (Sigma -Aldrich, USA) was used as an immune stimulant. Reduced glutathione (GSH), 1-chloro-2,4-dinitrobenzene (CDNB), 1,2-dichloro-4-nitrobenzene (DCNB), ethacrynic acid (ECA), 4-nitrobenzyl chloride (4-NBC) and 4-nitrophenethyl bromide (4-NPB) were purchased from Sigma-Aldrich. Cibacron blue (CB) and isopropyl-β-D-thiogalactopyranoside (IPTG) were purchased from Polyscience Inc. and Promega respectively.
2.3 Identification & sequence analysis of GSTs from Disk Abalone
The full length coding sequence of disk abalone glutathione S-transferase theta and kappa was identified from the abalone transcriptome database (Elvitigala et al., 2015), established in our laboratory, using a Roche 454 Genome sequencer FLX system
(GS-FLXTM) (Droege and Hill, 2008). Briefly, total RNA was extracted from healthy disk
abalones with Tri ReagentTM (Sigma- Aldrich, Missouri, USA) and processed with a
8
library construction kit (Clontech, USA) and a Trimmer cDNA normalization kit (Evrogen, Russia), were used to synthesize first strand cDNA and normalize it, respectively. The Basic Local Alignment Search Tool (BLAST) at the National Center for Biotechnology Information (NCBI) (http://www.ncbi.nlm.nih.gov/BLAST) was used to confirm the identity of the AbGSTθ and AbGSTκ genes. The open reading frames (ORF) and the amino acid sequences of the deduced proteins were determined using ORF finder (https://www.ncbi.nlm.nih.gov/orffinder). ExPASy prosite (Sigrist et al., 2013) and SignalP (Petersen et al., 2011) programs were used to scan for conserved domains and signal peptides within AbGSTθ and AbGSTκ, respectively. Characteristic signature domains were identified using the SMART online server (http://smartembl-heidelberg.de), and the NCBI-conserved domain database (CDD) (https://www.ncbi.nlm.nih.gov/Structure/cdd/cdd.shtml). The phylogenetic trees were constructed using the neighbor-joining method using MEGA 6 software (Tamura et al., 2011). The multiple sequence alignments were performed using Clustal omega (http://www.ebi.ac.uk/Tools/msa/clustalo) (Sievers et al., 2014) and Color align conservation (http://www.bioinformatics.org/sms2/color_align_cons.html) (Perry, 2002) web based software. The three-dimensional (3D) models of GSTθ and GSTκ were generated using the SWISS-MODEL (https://swissmodel.expasy.org) protein structure modelling server (Schwede et al., 2003), and then visualized using the PyMOL v1.5 software (DeLano, 2002).
9
2.4 Tissue isolation and immune challenge experiment
Tissue samples derived from the gills, mantle, digestive tract, muscles, and hepatopancreas were carefully isolated from four healthy abalones to analyze the tissue specific expression of AbGSTs. Hemolymph was collected from the pericardial cavity of each abalone using a sterile syringe and immediately centrifuged at 3000 × g for 10 min at 4°C in order to isolate the hemocytes. All the tissue samples were snap-frozen and stored at −80°C until RNA extraction.
Healthy disk abalones were divided into four groups and maintained separately to determine their immune response to one pathogenic bacterial strain and two immune stimulants. For the bacterial challenge experiment, one group of abalones was injected with the gram-negative bacterial strain (Vibrio parahaemolyticus). To do this, live V.
parahaemolyticus (100 µL, 1 × 10⁴ CFU/µL) were suspended in saline (0.9% NaCl) and injected intramuscularly into each abalone. For the immune stimulation experiment, one group of abalone was injected with 100 µL of the double stranded RNA viral mimic poly I:C (5 µg/µL), while in one other group each abalone was injected intramuscularly with 100 µL of LPS (5 µg/µL, from Escherichia coli 055: B5; Sigma, St. Louis, MO, USA) in saline. The remaining group of abalones was injected with 100 µL saline and were treated as the control group. After the different immune challenges, the gill tissues and hemocytes were isolated at 3, 6, 12, 24, 48, 72, and 120 h post-injection (p.i.). All the collected samples were snap-frozen and stored at -80°C until RNA extraction.
2.5 RNA extraction and first-strand cDNA synthesis
Total RNA was extracted from the above-mentioned abalone tissues using TRIzol
Reagent (Sigma) following the manufacture’s protocol. The concentration of the
10
(BioRad, USA). Thereafter an aliquot (2.5 µg) of the total RNA was reverse
transcribed using a Prime Script TM first-strand cDNA synthesis kit (TaKaRa, Japan)
and stored at −20°C after being diluted 40-fold.
2.6 Transcriptional analysis –Quantitative real-time PCR
The transcriptional analysis of AbGSTθ and AbGSTκ in healthy and immune challenged disk abalones were performed by quantitative real time PCR (qPCR) using
a Real Time System TP800 Thermal Cycler Dice TM (TaKaRa, Japan) with SYBR
Green as the fluorescent agent. The gene specific primers were designed according to the MIQE guidelines (Sinton et al., 1999) (Table 1), and were used to amplify the
AbGSTθ and AbGSTκ genes. For standardization, the abalone ribosomal protein L5
(GenBank accession: EF103443) was used as an internal reference with the appropriate primers (Table 1). The qPCR reaction mixture contained 3 µL of diluted cDNA from the respective tissue, 5 µL of 2 × TaKaRa Ex Taq™ SYBR premix, 0.5 µL of each primer (10 pmol/µL), and 1 µL of dH2O (PCR grade) in a total volume of 10µL. The PCR program consisted of one cycle at 95°C for 10 s; followed by 45 cycles of 95°C for 5 s, 58°C for 20 s; and 72°C for 20 s; and a final single cycle of
95°C for 15 s, 60°C for 30 s, and 95°C for 15 s. The Livak (2-ΔΔCT) method (Livak
and Schmittgen, 2001) was used to quantitatively analyze the relative mRNA expression levels of AbGSTs. All the challenged samples had normalized to the relevant saline control at each time point. Obtained results were represented as fold changes (mean +/- standard deviation) using the expression at 0 h un-injected control as the basal level reference.
11 Table 1. Sequences of primers used in this study
Primer name Application Sequence of primer (5'-3')
AbGSTκ _F AbGSTκ _R AbGSTκ_qF AbGSTκ_qR AbGSTθ _F AbGSTθ_R AbGSTθ_qF AbGSTθ_qR AbRib_F AbRib_R ORF amplification qPCR- amplification ORF amplification qPCR- amplification qPCR- Internal control GAGAGAGGATCCATGTCGGCAAAGAAGAGAGTGGAGT GAGAGAAAGCTTTCAGAGCTTAGCTTTGGCCATTTCTG GTTGACATGCAACAGCCTGACAAGAC TGCATCACTAAGACCAGCCTTCTTCC GAGAGAGAATTCATGGCGTTGAAAGTGTACTATGATTTGATGTCTC GAGAGAGTCGACTCAAAGATTAGATCCAAGTGAGGACTTGGTCA AACTGGCAGCACCTGAACACAAG TACCGGTGACAGCTTTACGAACCA TCACCAACAAGGACATCATTTGTC CAGGAGGAGTCCAGTGCAGTATG
2.7 Cloning of GSTs into the pMAL-c5X expression vector
Primers were designed with appropriate restriction sites to allow for cloning of the coding region of AbGSTθ and AbGSTκ into the expression vector pMAL-c5X, as shown in Table 1. PCR amplification was performed using a TaKaRa thermal cycler (Japan), and the ExTaq™ DNA polymerase (TaKaRa, Bio Inc., Japan). The reaction was performed in a total volume of 50 µL, containing 5 U of Ex Taq polymerase, 5 µL of 10 Ex Taq buffer, 4 µL of 2.5 mM dNTPs, 50 ng of template, and 40 pmol of each primer. The PCR profile was as follows, with an initial denaturation of 94°C for 3 min; 35 cycles of amplification at 94°C for 30 s, 59°C for 30 s, and 72°C for 1.5 min; and a final extension at 72°C for 5 min. The amplified PCR product and the pMAL-c5X vector were then digested using the corresponding restriction enzymes. The resultant products were electrophoresed on a 1% agarose gel and the appropriate gel
bands were purified using the AccuprepTM gel purification kit (Bioneer, Korea)
12
vector were incubated overnight at 16°C with Mighty Mix (TaKaRa, Japan) to allow for ligation of the PCR product into the pMAL-c5X vector. The ligated product was then transformed into Escherichia coli DH5α and the coding sequence was confirmed by sequencing.
2.8 Overexpression and purification of recombinant AbGST proteins
To express the recombinant AbGST proteins (rAbGSTθ and rAbGSTκ), the pMal-c5X/AbGST constructs were transformed into E. coli BL21 (DE3) (New England BioLabs, USA) and incubated at 37°C in LB broth medium containing 100 µg/mL ampicillin, until the OD600 reach 0.6. Isopropyl-β-galactoside (IPTG) was then added to the culture at a final concentration of 0.5 mM and incubated for 8 h at 20°C to induce the expression of the recombinant protein. After incubation, the cells were harvested by centrifugation at 1200×g for 30 min at 4°C. The resultant pellet was resuspended in column buffer (20 mM Tris-HCl, pH 7.4, 200 mM NaCl) and stored overnight at −20°C. Lysozyme (1 mg/mL) was added to the thawed cell suspension and the suspension was sonicated on ice. The resultant cell lysate was centrifuged at 9000×g for 30 min at 4°C. The rAbGST proteins were purified from the supernatant using maltose affinity chromatography, as described previously (Alexandrov et al., 2001). The same protocol was repeated to overexpress and purify the maltose binding protein (MBP). The size of the recombinant proteins were determined by 12%
SDS-PAGE along with molecular standards (EnzynomicsTM, Korea) and the protein
concentrations were assessed using a Bradford assay (Bradford, 1976).
2.9 GST enzyme assay
The specific activities of rAbGSTs were measured, as described previously (Michel and McGovern, 1974). The reactions were performed in a final volume of 200 µL containing 0.1 M phosphate buffer pH 6.5, 100 mM reduced GSH, 100 mM substrate,
13
and the appropriate amount of enzyme. The activity was measured separately using CDNB, DCNB, 4-NPB, 4-NBC, and ECA as substrates. The absorbance of the reaction was measured at the corresponding wavelengths indicated in Table 2, immediately and 5 minutes after addition of the substrate. The temperature was kept constant at 25°C throughout the experiment. All assays were performed in triplicate.
2.10 Michaelis-Menten Kinetics
To determine the Michaelis-Menten kinetics, different concentrations of the CDNB substrate (0.25−4 mM) were used to measure the activity of the recombinant proteins, as described in 2.8.1, while maintaining the GSH concentration constant. The Michaelis-Menten constant (Km) and the maximum reaction velocity (Vmax) values were analyzed using a Lineweaver-Burk plot (Maciolek et al., 1963). The activity of the recombinant proteins was measured in the same manner using different concentrations of GSH (0.25−4 mM), while maintaining the CDNB concentration constant.
2.11 The effect of temperature, pH and inhibitors on rAbGSTs activity
To determine the effect of pH on activity of the recombinant rAbGST proteins using CDNB as the specific substrate, a pH buffer series, ranging from pH 3–11 was used while maintaining all other reaction conditions the same, as described in section 2.8.1. The effect of temperature on the activity of recombinant rAbGST proteins was measured using water baths ranging in temperature from 10–60°C, with CDNB as the substrate. The effect of the GST inhibitor Cibacron blue (CB), on the recombinant rAbGST protein was assessed over a range of CB concentrations (0.001–100 µM) as described previously (Jayasinghe et al., 2016).
2.12 Disk diffusion assay
14
transformed with pMAL-c5X vector, and E. coli. transformed with the AbGST /pMAL-c5X construct, a disk diffusion assay was performed, as described previously (Lee et al., 2007). LB bacterial cultures were induced with 0.5 mM IPTG and incubated at 25°C for 4 hours. The bacterial cultures were then evenly spread on LB agar plates and four Whatman filter-paper disks (3 mm diameter) were placed on each agar plates in equal distance. The disks were treated with 5 µL of H2O2, 1 M CdCl2, 1
M CuSO4 or 1 M ZnCl2, respectively as determined by a preliminary assay. Treated
plates were incubated overnight at 37°C and the diameter of the cleared zones was measured.
2.13 Statistical Analysis
All experiments were performed in triplicate. The data are reported as mean ± standard deviation (SD). For the evaluation of the significance differences between groups, an unpaired Student’s t-test was used, and for the disk diffusion assay, the statistical analysis was performed using, a one-way analysis of variance (ANOVA) with Duncan’s Post Hoc multiple comparisons to evaluate the significance differences within groups. P-values less than 0.05 (P < 0.05) were considered as being statistically significant.
15
3. Results
3.1 Molecular characterization of AbGSTs
The amino acid sequences of AbGSTθ (GenBank Accession No: MK226199) and
AbGSTκ (GenBank Accession No: KY022631) were deduced from the abalone cDNA database. Based on the ExPASy-ProtParam analysis, the predicted AbGSTθ and AbGSTκ proteins consisted of 230 and 227 amino acids, with a predicted molecular weight of 26.6 kDa and 25.6 kDa, and a theoretical isoelectric point (pI) of 8.9 and 7.78, respectively. The instability indexes were 40.73 and 45.79 for AbGSTθ and AbGSTκ, respectively. Several bioinformatics tools were used to identify protein domains, families, functional sites, and associated patterns and profiles present in AbGSTθ and AbGSTκ.
AbGST-θ contained two soluble GST domains: a thioredoxin like N-terminal domain (Residues 1-75) and a C- terminal domain (110-203). Eight GSH binding sites
(G-sites) at the positions of: S11, Q12, H40, K41, K52, L53, E66, S67 and one sulfate binding
site (Q12)were identified at the N- terminal of AbGST-θ. Moreover, ten substrate
binding sites (H-sites) were observed in the AbGST-θ C-terminal at: H104, R108, G109,
A112, M113, F115, R116, I120, E174 and Q177. Furthermore, the motif scan analysis
revealed that AbGST-θ consists with three casein kinase II phosphorylation sites (146-149); 165-168; 206-209) and two protein kinase C phosphorylation sites (192-194; 211-213).According to the analysis AbGSTκ protein contains GSH binding sites
(G-sites) at Pro16, Tyr17, Ser18, Asn54, Lys63, Phe182, Gly183, Lys184, Phe199, Ser201,
Asp202, and Arg203; no hydrophobic ligand binding sites (H-sites) were observed.
AbGSTκ also possessed the same general fold as DsbA, consisting of a thioredoxin domain (5–212 aa), which is interrupted by an alpha-helical domain. SignalP 4.1 software analysis did not reveal any signal peptide in both AbGST-θ and AbGSTκ
16 proteins.
3.2 Homology analysis and phylogenetic relationship
The pairwise sequence alignment analysis was carried out to compare the identity and similarity percentages of AbGSTs, with other known GST homologues.
Table 2. Pairwise identity (I%), similarity (S%), and gaps (G%) of disk abalone GST-θ protein toward selected orthologs at amino acid levels
According to the observed data, corresponding to AbGST-θ, the highest sequence identity and similarity was observed from Mizuhopecten yessoensis (Japanese Weathervane Scallop) as 59.1% and 75.3%, respectively. The predicted multiple sequence alignment of AbGST-θ with other molluscan and non-molluscan organisms demonstrated that the N-terminal region is highly conserved through the evolution compared to the C-terminal region (Fig. 1). Highly conserved GSH binding sites
were observed in the N-terminal at S11, Q12, E66, S67 while substitutions were
Name Accession no Identity (%) Similarity (%) Gaps (%) Amino acids Mizuhopecten yessoensis XP_021358629.1 59.1 75.3 2.1 235 Lingula anatina XP_013408169.1 53.2 69.3 1.7 231
Alitta succinea ABQ82132.1 49.4 69.3 2.6 231
Osmerus mordax ACO09513.1 45.7 64.5 4.3 234
Danio rerio NP_956815.2 44.4 61.5 4.3 234
Ruditapes philippinarum AFB83399.1 39.9 59.3 14.1 248
Cephus cinctus XP_015598273.2 39.6 54.9 15.7 255
Mus musculus CAA66666.1 35.6 53.8 12.6 253
Macaca mulatta NP_001244563.1 34.9 54.9 14.1 255
17
observed in H40, F41, K52, L53 positions. Out of the C-terminal H-sites, R108, E174, Q177
were highly conserved among all the species through the evolution although H104,
G109, A112, M113, F115, R116, I120 sites exhibited replacements.
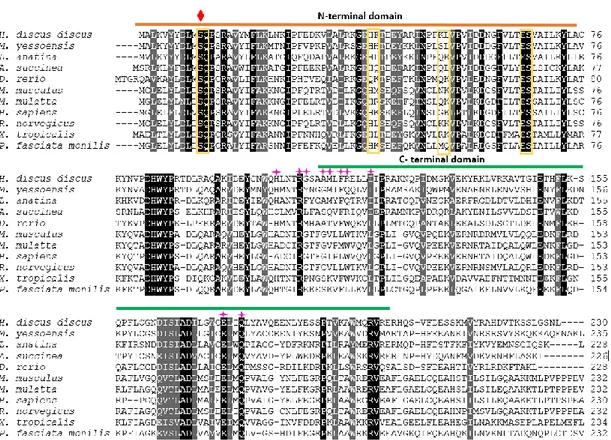
Fig. 1. Multiple sequence alignment of the amino acid sequences of AbGST-θ and its orthologs from different organisms. Fully conserved amino acids are shown in black, and strongly conserved and weakly conserved amino acids are shown in dark grey and light grey, respectively. The N-terminal domain and the C-terminal domain are
marked with orange and green color lines, respectively. The conserved Ser11 and
sulfate binding site (Q12) are marked with red and green color symbols, respectively.
The putative G-sites are shown with yellow color boxes and the pink color symbols indicate the H-sites.
However, all the aligned GSTκs contained highly conserved G−sites. Based on the pairwise sequence identity analysis of AbGSTκ, the highest identity was found with the pufferfish (Takifugu obscurus) (60.0%) ortholog with which it shared a 73.0% sequence similarity. Sequence alignment analysis of AbGSTκ with respective GSTκ from other species including fish, mollusk, amphibian, nematodes, and mammals,
18
showed that both the N and C−termini were found to be relatively diverse and did not contain any conserved amino acid sequences (Fig. 2).
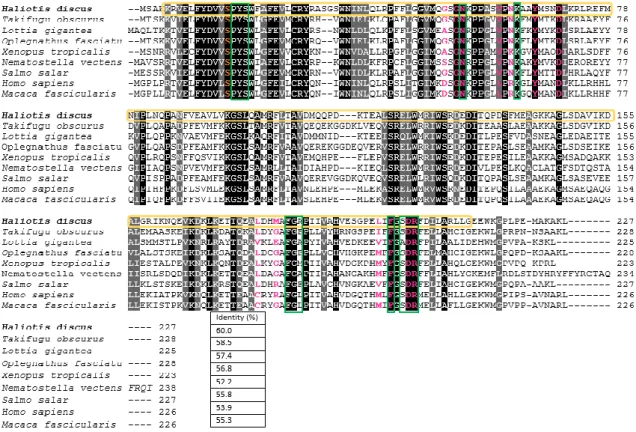
Fig. 2. Multiple sequence alignment of the amino acid sequences of AbGSTκ and its orthologs from different organisms. Fully conserved amino acids are shown in black, and strongly conserved and weakly conserved amino acids are shown in dark grey and light grey, respectively. The conserved DSBA-like thioredoxin domain (5-212) is marked in yellow. The putative GSH binding sites, and the residues involved in the dimer interface, are shown with green lines and pink letters, respectively. The catalytic serine residue is shown in orange. The % identity of each orthologue with AbGSTκ is shown at the end of each respective sequence in the alignment.
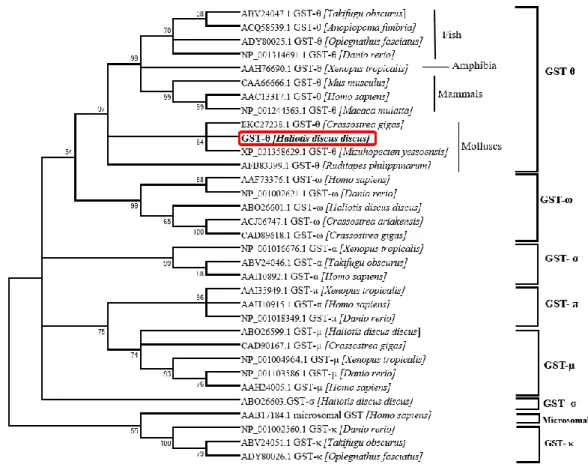
A phylogenetic tree was constructed for AbGST-θ together with other various GST classes, using the neighbor joining method (Fig. 3). According to the figure, GST-θ had form a separate clade including evolutionary different organisms together. However, AbGST-θ clearly clustered together with molluscan GST-θ: Mizuhopecten
yessoensis and Crassostrea gigas. Separate sub clades were observed for other GST
classes and previously identified disk abalone (Haliotis discus discus) GSTs had appropriately placed in the respective classes.
19
Fig. 3. A phylogenetic tree constructed using the neighbor-joining method based on different classes of GSTs. The bootstrap values are shown at the node of each branch. The NCBI accession numbers are given with the organism name.
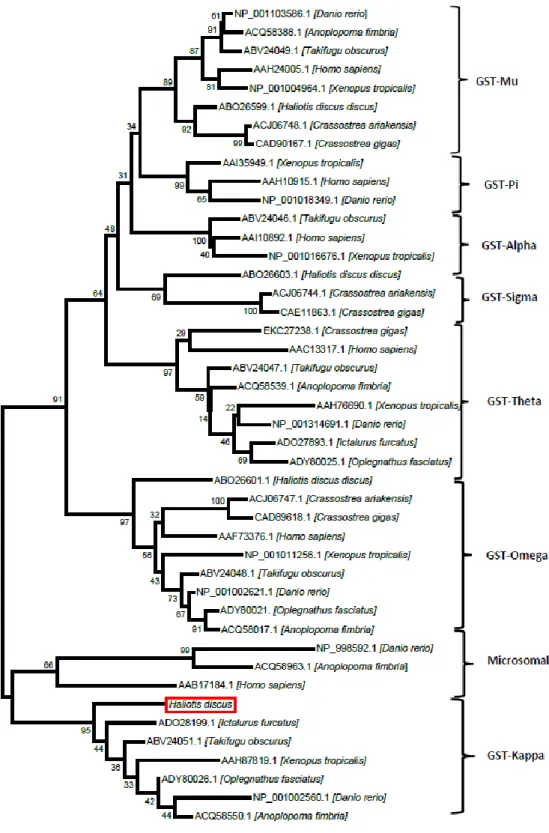
The constructed phylogenetic tree for AbGSTκ shows the relationship between AbGSTκ and the different sub-families of the GST superfamily (Fig. 4). The tree branched into two main clusters separating the cytosolic GSTs and the mitochondrial GSTs. AbGSTκ was found to be clustered with the mitochondrial GSTs. Moreover, AbGSTκ was found to be closely clustered with other fish GSTκs.
20
Fig. 4. A phylogenetic tree constructed using the neighbor-joining method based on different classes of GSTs. The bootstrap values are shown at the node of each branch. The NCBI accession numbers are given with the organism name.
21
3.3 Tertiary structural model of AbGSTs
In order to analyze the structural features of AbGST-θ, a three-dimensional model was constructed using Swiss-Modeling and then it was analyzed by the PyMOL computer software (Fig. 5A).
22
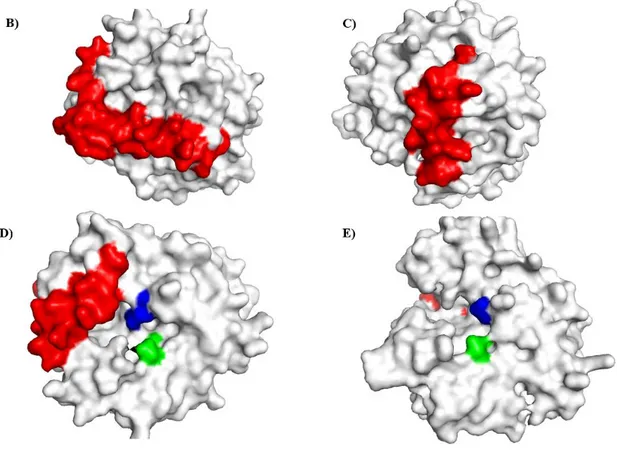
Fig. 5.Surface representations of human GST-θ (B, D) and AbGST-θ (C, E) highlighting the C-terminal tails in red color. The blue color surface representing the H-site and green color surface representing the G-site region in each figure. The 3D structure models were predicted using the Swiss-model server and visualized using PyMOL software.
N- terminal and C-terminal domains could identified separately which were connecting each other by a short tract. The N-terminal domain consisted with βαβ unit connected to ββα unit by a surface exposed region which contain two small α-helices. The structural topology of the C-terminal domain consisted with only six α-helices.
The orange color sphere represented the Ser11 residue which is considered as a
characteristic feature in GST- θ class. The surface representations of human GST- θ (Fig. 5 B, D) and AbGST-θ (Fig. 5 C, E) demonstrated the highlighted C-terminal tail in red color. According to the figure, human GST- θ showed a long C-terminal extension compared to AbGST-θ. The blue color surface represented the H-site and green color surface represented the G-site region in both figures.
23
3D structure modeling of AbGSTκ was performed using the SWISS-MODEL server and visualized using the PyMOL surface viewer program (Fig. 6A).
A)
B)
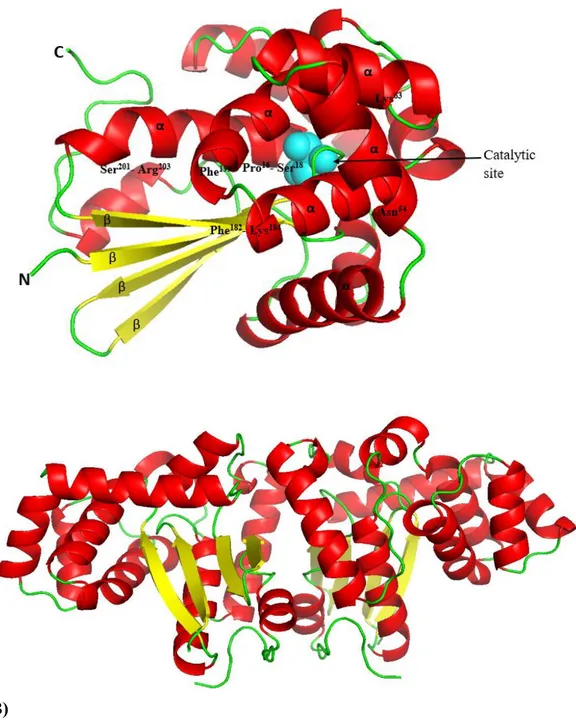
Fig. 6. A) Predicted three-dimensional structure of AbGSTκ. The α-helices and β-sheets are marked, and the positions of the predicted G-sites are labeled. The catalytic residue is shown as a blue colored sphere. B) The butterfly-like shape adopted by the AbGSTκ dimer. The 3D structure models were predicted using the Swiss-model server and visualized using PyMOL software.
The crystal structure of glutathione transferase belonging to the human kappa class was used as a template. This template shares 53.78% sequence identity and 0.99
24
coverage with the AbGSTκ sequence. The 3D structure analysis showed the presence of α-helices and four conserved antiparallel β-sheets. The functional DSBA domain of AbGSTκ is distributed throughout the helices, coils, and sheets while forming the butterfly-like shape of the dimer (Fig. 6B).
3.4 Tissue-specific expression of AbGSTs
To understand the potential endogenous functions of AbGST-θ and AbGSTκ, their relative expressions were examined in different tissues. To achieve this, cDNA samples were prepared from the disk abalone organs and analyzed using qPCR. According to the analysis of the expression profiles from the disk abalone revealed that the highest expression level of AbGST-θ was observed from the digestive tract (~26 fold), followed by hepatopancreases (~20 fold). All the examined tissues had expressed AbGST-θ in different levels indicating their potential physiological roles within the body (Fig. 7A). AbGSTκ was highly expressed in the digestive tract (~20 fold), mantle (~20-fold), and muscles (~18-fold), whereas the lowest expression was observed in the hepatopancreas (Fig. 7B).
25
Fig. 7. Tissue specific transcriptional profile of A) AbGST-θ and B) AbGSTκ in disk abalone (Haliotis discus discus). Data are presented as mean ± standard deviation (n=3).
A)
26
3.5 AbGSTs expressions against pathogenic stress
In order to understand the roles of AbGST-θ and AbGSTκ in immune responses, we examined the transcriptional levels of both AbGSTs in gill tissue and hemocytes after immune challenges with bacteria, a viral mimic, and LPS (Fig. 8). V.
parahaemolyticus, Poly (I:C), and LPS were used to challenge the abalones to assess
the immune responses.
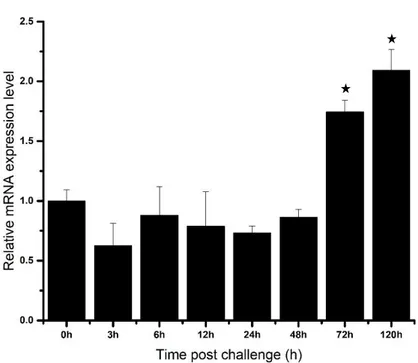
The AbGST-θ was significantly upregulated after 48 h (~ 4-fold) p.i. of LPS in abalone gills (Fig. 8A). Meanwhile the poly I:C injection was able to significantly upregulate AbGST-θ in abalone gill tissue at 48h (~5-fold) of p.i. (Fig. 8B). Furthermore, V. parahaemolyticus injection resulted with significant upregulations in abalone gill tissue at 24h (~2-fold) and 72h (~3-fold) of p.i (Fig. 8C). The mRNA expression of AbGST-θ was significantly upregulated at 72 h and 120 h p.i. of LPS and V. parahaemolyticus in hemocytes (Fig. 8D and F). Moreover, poly I:C stimulation significantly upregulated the expressions of AbGST-θ only at 72h of p.i (Fig. 8E).
27 A)
B)
28 C)
29 E)
F)
30
Fig. 8. Relative mRNA expression, analyzed by qPCR of AbGST-θ over time in gill tissue (A, B, C), and hemocytes (D, E, F) in response to challenges with LPS (A, D), poly I:C (B, E), and Vibrio parahaemolyticus (C, F). Data are presented as mean ± standard deviation (n=3). Data with marked with a * represent a statistical difference in expression compared with the 0 h post-injection baseline.
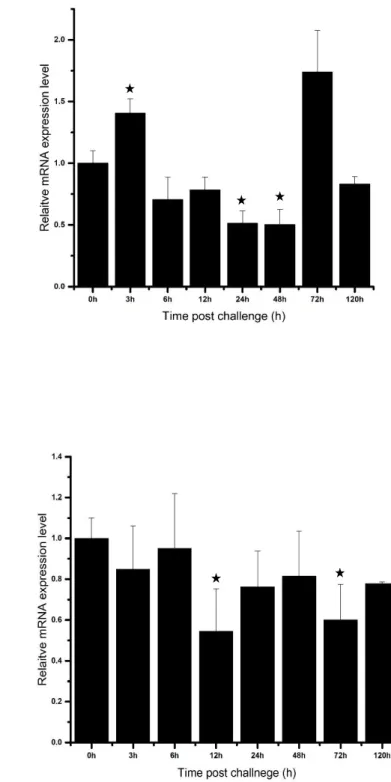
Following LPS treatment, the basal transcriptional level of AbGSTκ in the gills rapidly decreased at 3 h of p.i, and then increased gradually up to 48 h of p.i. This upregulation at 48 h of p.i. was significant (P < 0.05) compared with that in the un-injected control animals (Fig. 9A). Following V. parahaemolyticus injection, the mRNA level of AbGSTκ in gill tissue decreased as well as increased at different time points, not showing any significant up or downregulation overall (Fig. 9B). Treatment with poly I:C resulted in a fluctuating pattern of AbGSTκ mRNA levels in gills, with both upregulation and downregulation being observed (Fig. 9C). Following the same immune challenges, the relative mRNA level of AbGSTκ in hemocytes showed different expression patterns from those seen in the gills. In hemocytes, following LPS treatment, the AbGSTκ mRNA levels were significantly upregulated at 48 and 72
31
h.p.i. but were significantly downregulated at 6, 24, and 120 h.p.i (Fig. 9D). V.
parahaemolyticus treatment significantly downregulated AbGSTκ mRNA levels at 12
and 72 h.p.i (Fig. 9E). The viral mimic, poly I:C, caused a significant upregulation of
AbGSTκ mRNA levels at 3 h.p.i., and a significant downregulation at 24 and 48 h.p.i.
(Fig. 9F).
32
B)
33
D)
E)
34 F)
Fig. 9. Relative mRNA expression, analyzed by qPCR of AbGST-κ over time in gill tissue (A, B, C), and hemocytes (D, E, F) in response to challenges with LPS (A, D), poly I:C (B, E), and Vibrio parahaemolyticus (C, F). Data are presented as mean ± standard deviation (n=3). Data with marked with a * represent a statistical difference in expression compared with the 0 h post-injection baseline.
35
3.6 Construction of recombinant AbGST proteins and purification
Recombinant AbGST proteins (rAbGST-θ and rAbGSTκ) were over-expressed using the pMal-c5X/ AbGSTs construct in E. coli BL21 after induction with IPTG. After purifying the recombinant protein using affinity chromatography based on the presence of the maltose binding protein (MBP) fusion tag, their approximate molecular masses were determined by electrophoresis on a 12% SDS-PAGE gel using molecular mass markers (Fig. 10). The resultant AbGST-θ/MBP fusion protein exhibited a band of ~70 kDa being compatible with the predicted molecular mass of AbGST-θ-26.6 kDa; MBP 42.5 kDa (Fig. 10A). Moreover, the AbGSTκ/MBP fusion protein had a size of ~68 kDa, including the 42.5 kDa MBP tag, confirming AbGSTκ’s predicted molecular mass of 25.6 kDa (Fig. 10B). Both proteins were considered as pure based on the presence of only those appropriate single bands.
36 B)
Fig. 10. SDS-PAGE analysis of purified A) rAbGST-θ and B) AbGSTκ. M: protein marker, U: un-induced extract, L: lysate from IPTG induced cells, P: pellet from IPTG induced cells, S: supernatant from IPTG induced cells, E: purified recombinant protein after elution.
3.7 Specific activity and kinetic assay
The activities of rAbGST-θ, rAbGSTκ and MBP against different substrates, including CDNB, DCNB, 4-NPB, 4-NBC, and ECA were measured, as described previously (Board et al., 2000) (Table 5). Detectable activity was observed only using CDNB as the substrate. No significant activity was detected for MBP against any of the substrates and therefore it was treated as a control and further functional studies were conducted only with rAbGST-θ and rAbGSTκ.
37
Table 3.Substrate specific parameters at 25°C, when the substrate and GSH concentrations were 1.0 mM each, and the specific activities of AbGST-θ and AbGSTκ towards the different substrates.
Substrate pH λmax (nm) Molecular extinction Coefficient (ϵ) (mM −1 cm −1) AbGST-θ Specific activity (μmol min -1 mg -1) AbGSTκ Specific activity (μmol min -1 mg -1) CDNB DCNB 4-NPB 4-NBC ECA 6.5 7.5 6.5 6.5 6.5 340 345 310 310 270 9.6 8.5 1.2 1.9 5.0 5.38 ± 0.09 n.d n.d 2.52 ± 0.08 0.52 ± 0.07 6.51 ± 0.09 n.d n.d n.d n.d n.d – not detected
The rAbGST-θ showed highest catalytic activity towards the CDNB substrate (5.38 ±
0.09 μmol min -1 mg -1) with detectable activities towards 4-NBC (2.52 ± 0.08 μmol
min -1 mg -1) and ECA (0.52 ± 0.07 μmol min -1 mg -1) substrates. No detectable
activities were observed for DCNB and 4-NPB substrates. The specific activity of rAbGSTκ against the CDNB substrate was 6.51 ± 0.09 µmol/min/mg. No detectable activities for rAbGSTκ were observed with other substrates.
The enzyme activity for rAbGST-θ and rAbGSTκ were measured with different concentrations of CDNB and GSH. For rAbGST-θ, with a fixed concentration of
CDNB, the Km and Vmax were calculated as 5.21 ± 0.22 mMand 10.68 ± 0.10 μmol
min -1 mg -1, respectively. Meanwhile with a fixed concentration of GSH, the Km and
Vmax values were calculated to be as 2.65 ± 0.18 mM and 8.23 ± 0.09 μmol min -1 mg
-1, respectively (Table 6.). For rAbGSTκ, at a fixed CDNB concentration, the Km and
Vmax values for GSH were 2.95 ± 0.28 mM and 12.77 ± 0.29 µmol/min/mg,
respectively. At a fixed GSH concentration, the Km and Vmax values for CDNB were 3.81 ± 0.30 mM and 14.35 ± 0.30 µmol/min/mg, respectively.
38
Table 4. Optimum temperature, pH, Michaelis-Menten kinetic parameters, and inhibitor IC50 values for AbGST-θ and AbGSTκ using CDNB as the substrate (n=3). Protein Optimum Temp. (oC) Optimum pH Inhibitory IC 50 (μM) Kinetics CDNB(GSH(1mM)) Km(mM) Vmax (μmol mg-1min-1) Kinetics GSH(CDNB(1mM)) Km(mM) Vmax (μmol mg-1min-1) AbGSTθ AbGSTκ 37 35 7.5 8 0.08±0.01 0.05±0.01 5.21 ± 0.22 10.68 ± 0.10 3.81 ± 0.30 14.35 ± 0.30 2.65 ± 0.18 8.23 ± 0.09 2.95 ± 0.28 12.77 ± 0.29
3.8 Effect of temperature, pH, and an inhibitor on GSTs activity
Using CDNB as the specific substrate, the optimum pH and temperature for maximum catalytic activity of rAbGST-θ and rAbGSTκ were determined. For rAbGST-θ the optimum pH was detected as pH:7.5 while giving highest activities within a narrow range from pH 7 to 9 (Fig. 7A). The optimum temperature of rAbGST-θ for CDNB conjugation activity was ~ 37 ℃ (Fig. 7B). Moreover, the
higher temperatures resulted the loss of enzymatic activities. Furthermore, 100%
inhibition of rAbGST-θ-CDNB conjugation activity was observed with 100 μM
concentration of CB (Fig. 7C). The IC50 value for CB was calculated as 0.08 ± 0.01 μM.
39
Fig. 11. A) The effect of pH, B) temperature and C) inhibitor (Cibacron Blue) concentration on the GSH conjugating activity of AbGST-θ.
40 0 20 40 60 80 100 120 10 20 30 35 40 45 50 60 R esid ual ac tivity( % ) Temperature (℃) 0 20 40 60 80 100 120 3 4 5 6 7 8 9 10 11 Re sid u al ac tivity( % ) pH value
41
Fig. 12. Effect of A) Temperature, B) pH, and C) Inhibitor (Cibacron Blue) concentration on the GSH conjugating activity of AbGSTκ.
The optimum temperature for the CDNB conjugation activity of rAbGSTκ was 35°C (Fig. 7A). rAbGSTκ was also shown to have GSH: CDNB conjugating activity over a broad pH range from 4 to >11, with an optimum activity at pH 8 (Fig. 7B). The highest activities were observed over the pH range of 7–10. Moreover, CB (100 µM) inhibited rAbGSTκ by 100% using CDNB as the substrate (Fig. 7C). The IC50 value for CB was 0.05 µM. 0 10 20 30 40 50 60 70 80 90 100 0.0010 0.0100 0.1000 1.0000 10.0000 100.0000 R es idu al act ivi ty (% ) Inhibitor concentration (µM) 0.001 0.01 0.1 1 10 100
42
3.9 Disk diffusion assay
In AbGST-θ, Clearance zones with various diameters were observed around all the H2O2 treated disks. Among them the largest clearance zone was observed at the untransformed E. coli plate while other two were smaller than that. Apart from that, all the heavy metal treated disks also exhibited clearance zones with different diameters. Maximum diameters for CdCl2, ZnCl2 and CuSO4 treatments were observed in the untransformed E. coli plates, whereas the AbGST-θ transformed plates showed significant smaller clearance zones around the disks.
Fig. 13. Disk diffusion assay of AbGST-θ against E. coli BL21. The diameter of the clearance zone (cm) was measured in plates with untransformed E. coli (un-EC), E. coli transformed with the pMALc2X vector (ve-EC), and E. coli transformed with the AbGST-θ /pMAL-c2X vector (θ-EC). Disks were impregnated with H2O2, CdCl2, CuSO4, and ZnCl2. Data are presented as mean ± standard deviation (n=3). Significant differences within each group were analyzed using a one-way analysis of variance (ANOVA) with Duncan’s Post Hoc multiple comparisons test. Data indicated with different letters are significantly different (p < 0.05) within the group.
In the disk diffusion assay for AbGSTκ using H2O2, clearance zones were observed to varying degrees (Fig. 8) around all the disks. The largest clearance zone was observed in the untransformed E. coli plate, whereas the clearance zones of the other two plates were significantly smaller. At the same time, we demonstrated the effect of three
0.00 0.50 1.00 1.50 2.00 2.50 3.00 3.50 4.00 4.50 5.00 1 2 3 4 Cle ar an ce z on e d iam ete r (c m ) Stress stimulant un-EC ve-EC θ-EC H2O2 CuSO4 CdCl2 ZnCl2 b c d e e f g h i i j a
43
heavy metals (Cd, Zn, Cu) on AbGSTκ (Fig. 8) using the disk diffusion assay. All the disks treated with heavy metals in the LB agar plates showed clearance zones of varying degrees. For CdCl2-treated disks, the maximum diameter of the clearance zone was observed for the untransformed E. coli plate, whereas the other plates had significantly smaller clearance zones (Fig. 8). For the CuSO4-treated disks, the AbGSTκ-transformed plate did not show any significant change in the clearance zone diameter compared with that of the untransformed and vector transformed plates. Finally, for the ZnCl2-treated disks, the highest clearance zone diameter was observed on the untransformed E. coli plate, whereas the AbGSTκ-transformed E. coli plate had a significantly smaller clearance zone diameter (Fig. 8).
Fig. 14. Disk diffusion assay of AbGSTκ against E. coli BL21. The diameter of the clearance zone (cm) was measured in plates with untransformed E. coli (un-EC), E. coli transformed with the pMALc5x vector (ve-EC), and E. coli transformed with the AbGSTκ/pMALc5x vector (k-EC). Disks were impregnated with H2O2, CdCl2, CuSO4, and ZnCl2. Data are presented as mean ± standard deviation (n=3). Significant differences within each group were analyzed using a one-way analysis of variance (ANOVA) with Duncan’s Post Hoc multiple comparisons test. Data indicated with different letters are significantly different (p < 0.05) within the group.
44
4. Discussion
GSTs are identified as a diverse and important class of isoenzymes involved in the phase II detoxification system (Glisic et al., 2015). GST-θ is considered as the most ancient group which consists with two different types; GST-θ1 and GST-θ2 sharing 55% sequence identity in their protein structure. Among the numerous studies on GSTs, kappa class has been recognized as the least studied class (Hayes et al., 2005). Limited reports are available on their gene expression and functional studies, especially in mollusks. Therefore, in this study we are focusing on these two genes from GST superfamily: GST-θ and GST-κ identified from disk abalone (Haliotis
discus discus).
In our study, we identified several characteristics of AbGST-θ and AbGSTκ by means of in silico analysis. Most of the cytosolic GSTs are available in nature as dimers with a molecular mass of a subunit varies from 23 kDa to 27 kDa (Blanchette et al., 2007). The predicted molecular weight of AbGST-θ (26.6 kDa) was agreed with other previously identified theta class GSTs (Saranya Revathy et al., 2012)(Bathige et al., 2014) and this also indicates the cytosolic nature of AbGST-θ. Furthermore, the absence of signal peptides within AbGST-θ also proposed it to be a cytosolic protein (Talmud et al., 1996). The instability index, which predicts the regional instability is calculated based on the weighted sum of dipeptides that occur more frequently in unstable proteins than in stable proteins, was 45.79 for AbGSTκ. This high value, being greater than 40, classifies this protein as being unstable (Guruprasad et al., 1990). The lack of a signal peptide suggests that the both proteins do not have any secretion properties. AbGSTκ also possessed the same general fold as DsbA, consisting of a thioredoxin domain (5–212 aa), which is interrupted by an alpha-helical domain, a characteristic feature of the GSTκ family. All members of the GST