AN APPLICATION OF THE DETERMINATION METHOD FOR SOIL PARAMETERS
WITH THE DESIGN CODE FOR PORT AND HARBOUR FACILITIES IN JAPAN
YOICHIWATABEi)
,
IKURONOZAKIii),
MASANORITANAKAi)and OHKYUN KWONiii)ABSTRACT
This paper introduces a practical determination method for soil parameters adopted in the new performance based design code for port and harbour facilities in Japan. In the new port-design code, the depth profile of the derived values is modeled as the profile of the estimated values so as to be either the mean value or the regression line, then the correction factors are multiplied to the estimated value according to the coefficient of variation (if COV > 0.1) and the number of the data entries (if n < 10). The new port-design code is applied to the unconfined compression test results for the Hiroshima Port clay in order to evaluate the undrained shear strengths. From the discussion, it is emphasized that not only the statistic treatment but also the engineering judgment are required in the procedure of the soil parameter determination for the reliability design.
Key Words: soil parameter, characteristic value, performance based design, design standard, port facilities
1 INTRODUCTION
This paper introduces a new practical method, which has been adopted in the design code for port and harbour facilities in Japan (The Japan Port and Harbour Association, 2007), to evaluate soil parameters. The determination method described in the new design code for port facilities in Japan is called as “new port-design code” hereafter. Determination methods for soil parameters for reliability design method are introduced in, e.g., Eurocode 7 (EN 1997-1, 2004) and JGS4001 (JGS, 2004). The determination method in these general-design codes is called as “general design code” hereafter.
In Japan, soil parameters for performance-based reliability design should be determined according to JGS4001. The characteristic value (see Figure 1) is generally the expected value of the derived parameters; however, it is not merely an average. The value should be considered the statistical estimation errors. The soil parameters of the ground and the quality parameters of the industrial products are totally different in their treatments. The statistical treatment for soil parameters is strongly required in consideration of the non-uniform sedimentary structure, the investigation errors, the testing errors, the limited number of the data entries, etc. In the new port-design code, a simplified and reasonable method, which pursues the practical usability by simplifying the statistical treatment, to determine the soil characteristic values was introduced.
In this paper, the new port-design code is applied to the unconfined compression test results in order to
evaluate the undrained shear strengths of the Hiroshima Port clay. The aim of this study is to emphasize that not only the statistical treatment but also the engineering judgment are required for reliability design.
Measured value in the soil test Derived value as the soil parameter
Characteristic value Value for the design
Primary treatment with empirical/theoretical equation Depth profile modeled in each soil layer
Partial safety factor Estimated value
Statistical treatment in consideration of the data variation
Figure 1. Flowchart in determination for soil parameters in the design code for port facilities in Japan.
2 CHARACTERISTIC VALUE
The flowchart shown in Figure 1 is modified for the new port-design code, but reflecting the purport of JGS4001. The characteristic value is the representative one obtained by modeling the depth profile of the data taking account of the variation of the estimated values.
i) Port and Airport Research Institute, 3-1-1, Nagase, Yokosuka 239-0826, Japan. ii) Toa Research and Development Center, Yokohama 230-0035, Japan.
In a case for industry products, the characteristic value is generally defined as 5% fractile corresponding to Equation (1), e.g. in Eurocode 0 (EN 1990, 2002).
xk = μ(x) – 1.645 σ(x) (1) where, μ(x) is the average of x, and σ(x) is the standard deviation of parameter x. If we consider ground failure, for example, we have to treat the whole ground failure, not the failure in each element. Thus, Eurocode 7 adopted the value corresponding to the 95% confidence level instead of the 5% fractile (Orr, 2006). In JGS4001, the characteristic value is described as the same manner as Eurocode 7, but the confidence level is not fixed to 95%. Ovesen (1995) proposed a simple equation expressed as Equation (2) to obtain the lower limit of 95% confidence level.
xk = μ(x) – 1.645 σ(x)/ n (2)
where n is the number of data entries. Schneider (1997) proposed a more simplified equation for n = 11.
xk = μ(x) – 0.5 σ(x) (3) The new port-design code adopted a more practical method, which uses the outline of both Schneider’s and Ovesen’s equations and is partly consistent with the general-design code.
For the soil parameter x, the estimated soil parameter x* is modeled such as uniform depth profile (x* = c1); linear depth profile (x* = c1 z + c2); etc. Where z is the depth, and c1 and c2 are constants. The estimated value x* is the value on the approximated depth profile of the soil parameter. Note here that the depth profile of x* must be estimated as either the expected constant value or the regression function to minimize the errors.
In order to evaluate the variation of the derived values x, it is convenient to use the coefficient of variation COV. It has been known that the COV of the derived values obtained by well skilled technicians is less than 0.1 for a typical Japanese marine clay (Watabe et al., 2007). In other words, the variation in this level is inevitable because of the ground heterogeneity and the laboratory testing errors. In a case of a large COV value, it is reasonable to conservatively determine the characteristic value taking account of the uncertainties.
In order to calculate the characteristic value xk from the estimated value x*, correction factor b1 is introduced as a function of the COV, then xk is defined as Equation (4) with the correction factor defined as Equation (5).
xk = b1×x* (4) b1 = 1 ± (COV/2) (5) The minus sign is used when the soil parameter x is a favorable in design. On the other hand, the plus sign is used when it is unfavorable in design. In these definitions, the characteristic values correspond to
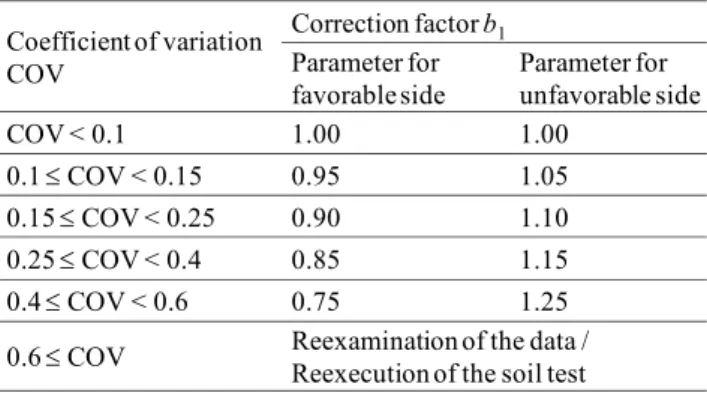
either 30% or 70% fractile value. Because the simplification is aimed in this method, the values listed in Table 1 are to be used instead of the correction factors with detailed fractions. When the COV is larger than 0.6, it is judged that the reliability of the soil parameter is too low for the design. In this case, the test results are reexamined.
Table 1. Value of correction factor b1.
Coefficient of variation COV Correction factor b1 Parameter for favorable side Parameter for unfavorable side COV < 0.1 1.00 1.00 0.1 ≤ COV < 0.15 0.95 1.05 0.15 ≤ COV < 0.25 0.90 1.10 0.25 ≤ COV < 0.4 0.85 1.15 0.4 ≤ COV < 0.6 0.75 1.25
0.6 ≤ COV Reexamination of the data / Reexecution of the soil test
If the number of data entries is not sufficient for statistical treatment, another correction factor b2 is introduced to correct b1. Then, the characteristic value is expressed as Equation (6).
ak = b1×b2×x* (6) About 10 or more data entries in the depth profile can be thought to be sufficient to reliably calculate COV. In the case with less than 10 data entries, the correction factor is defined as Equation (7).
b2 = 1 ± (0.5/n) (7) Here, b2 for the case with only one data entry is set to 0.5 or 1.5, respectively, and the reliability is assumed to rapidly increase with the number of data entries. 3 COMPARISON BETWEEN THE NEW PORT- DESIGN CODE AND GENERAL DESIGN CODE
In the general design code, characteristic value of soil parameters is defined as the lower or upper limit of a certain level of confidence interval (95% in most cases). In this chapter, a relationship between the characteristic values determined by the new port-design code and 95% confidence level, respectively, is discussed. Soil parameters, which are favorable in design, are described here. In the general design codes, the lower limit of 95% confidence interval expressed as Equation (8) is defined as the characteristic value by assuming t-distribution, because the standard deviation (the coefficient of variation) for the population is unknown when soil parameters are evaluated by geotechnical investigation. COV 1 * SD 1 * 1 ; 1 . 0 × − = × − = − n t x k x x n s k (8)
where ks is the coefficient in association with the confidence interval for the n data of the derived values, the notation t0.1;n–1 is the inversion function of t-distribution for 95% confidence level with a degree of freedom n–1.
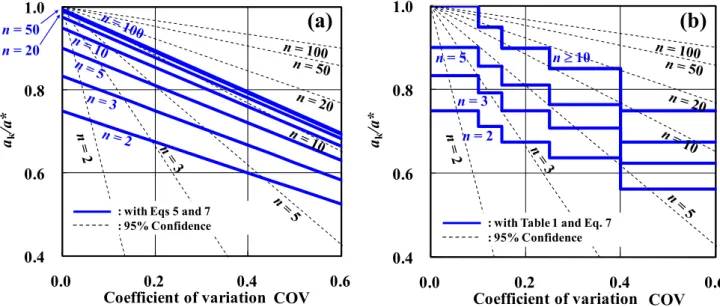
The characteristic values obtained by the new port-design code (Equation 6) and the 95% confidence level (Equation 8) are compared in Figure 2a. In the case of n = 10, the characteristic values obtained by the both equations are agreed well. Compared to the lower limit of 95% confidence level, the characteristic value determined by the new port-design code tends to be conservative when the number of data entries is larger; while it tends to be challenging when n is smaller. In practice, it is sometimes happen that the number of data entries is significantly limited to less than 5. In a case of complicated stratification, in particular, the number of the data entries is significantly limited if depth profile of a very thin soil layer is examined. In such case, it can be said from Figure 2a that the characteristic value determined by Equation (8) is unrealistically smaller than that determined by Equation (6).
The characteristic values determined by the new port-design code with correction factors b1 listed in Table 1 and b2 expressed by Equation (7) for n < 10 are drawn in Figure 2b. The characteristic value xk in a range of COV ≤ 0.1 and n ≥ 10 is coincident with the estimated value x*, i.e. xk/x* = 1. In the case of n = 10, the characteristic values determined by the both two methods are agreed well, and in the cases of n < 10, the difference between the values determined by the two methods is not significant.
5 APPLICATION OF THE NEW PORT- DESIGN CODE TO UNDRAINED SHEAR STRENGTH
The applicability of the new port-design code is studied in the following part. Here, a case study in determination of soil parameters with the new port design code is attempted to a data set, obtained from site investigation in Hiroshima Port, Japan, stored in the geotechnical database for port and harbor facilities in Japan (Watabe and Tanaka, 2004). Depth profiles of natural water content wn, liquid limit wL, and plastic limit wp are shown in Figure 3. It can be said that the clay has a significantly low plasticity below a depth of z = 19 m. 0 5 10 15 20 25 0 50 100 150 深度 z (m ) 含水比w (%) 自然含水比wn 液性限界wL 塑性限界wp Water content w (%) 0 5 10 15 20 25 De pt h z (m ) 0 50 100 150 : wn : wL : wp
Figure 3. Depth profiles of consistency: (a) natural water content wn; (b) liquid limit wL; (c) plastic limit wp. 0.4 0.6 0.8 1.0 0.0 0.2 0.4 0.6 ak /a *
Coefficient of variation COV
n = 50 n = 20
: with Eqs 5 and 7 : 95% Confidence
(a)
COV 0.4 0.6 0.8 1.0 0.0 0.2 0.4 0.6 ak /a *Coefficient of variation COV
n = 2 n = 3
n = 5 n ≥ 10
: with Table 1 and Eq. 7 : 95% Confidence
(b)
COV
Figure 2. Relationship between ak/a*, COV, and n: (a) the new-port design code with Eqs 5 and 7 compared to the 95% confidence level; (b) the new-port design code with correction factors b1 listed in Table 1 and b2 expressed by Eq. 7 for n < 10 compared to the 95% confidence level.
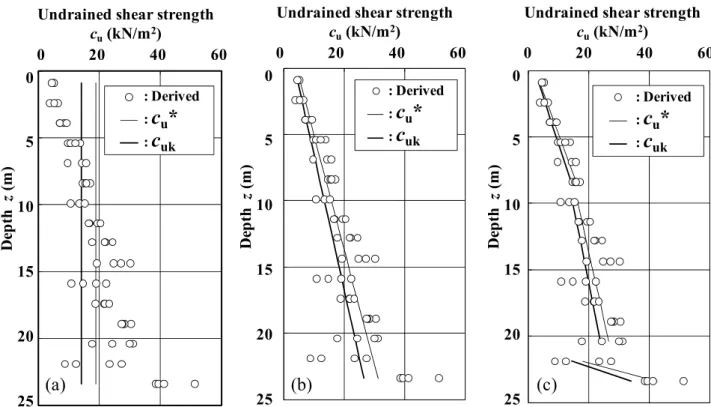
From the depth profile of the derived values of cu (= qu/2) obtained from the unconfined compression test, the estimated value cu* and characteristic value cuk are examined. Figure 4 shows the depth profiles of cu corresponding to the following modeling: (a) uniform distribution; (b) uni linear distribution, in which the value increases linearly with depth; (c) tri-linear distribution, in which the value increase linearly with depth in each divided layer.
In case of uniform distribution (Figure 4(a)), the regression line representing the estimated values is expressed as cu* = 18.9 (kN/m2). The calculated COV of 0.52 corresponds to b1 = 0.75 from Table 1. Because there are more than 10 data entries, thus b2 = 1.0 from its definition. Therefore, the characteristic value cuk is obtained as 0.75cu*. From an engineering judgment, the modeling as the uniform depth profile does not make sense for the natural soft clay deposit.
In case of uni-linear distribution (Figure 4(b)), the estimated value is expressed as cu* = 4.1 + 1.15z (kN/m2). The calculated COV of 0.25 corresponds to b
1 = 0.85 from Table 1. Because there are more than 10 data entries, thus b2 = 1.0 from its definition. Therefore, the characteristic value cuk is obtained as 0.85cu*.
The clay deposit can be divided into 3 layers targeting to minimize the COV (Figure 4(c)). The estimated values are expressed as cu* = 2.2 + 1.61z (kN/m2) at z < 9.5 m, cu* = 6.4 + 0.99z (kN/m2) at 9.5 m z ≤ 21.0 m, and cu* = –342.0 + 16.44z (kN/m2) at 21.0 m ≤ z. The calculated COV of 0.19, 0.21, and 0.34
corresponds to b1 = 0.90, 0.90, and 0.85, respectively, from Table 1. Because there are more than 10 data entries in the first and second layers, thus b2 = 1.0; however, there are 8 data entries in the third layer, thus b2 = 0.94. Therefore, the characteristic value cuk is obtained as 0.90cu* 0.90cu*, and 0.80 cu*, respectively.
If we focus on the data at z = 21.9 m, it can be seen that the values of cu are divided into two groups in around 10 kN/m2 and 25 kN/m2, respectively. The former is significantly smaller than the trend interpolated from the other data, indicating that those values are outliers which cannot be explained by soil mechanics. The depth profile of undrained shear strength cu should be a function of consolidation yield stress pc; however, we cannot see any pc data corresponding to the smaller shear strength. The smaller shear strength obtained as an outlier was probably caused by the low plasticity of the soil as seen in Figure 3. Therefore, these outliers at z = 21.9 m were attempted to be removed from the data set, and then, the estimated value was remodeled by tri-linear distribution (Figure 5(b)). In this case, the undrained shear strength linearly increases with depth, indicating a common trend for normally consolidated soft clay deposits.
In consideration of the consistency in Figure 3, the boundary between the second and third layers should be set at around z = 18 m rather than z = 21 m. In this case, both the consolidation yield stress pc and undrained shear strength cu show a natural depth profile.
0 5 10 15 20 25 0 20 40 60 深さ z (m ) 非排水せん断強さ cu(kN/m2) 導出値cu 推定値cu* 特性値cuk 0 5 10 15 20 25 0 20 40 60 深度 z (m) 非排水せん断強さ cu(kN/m2) 導出値cu 推定値cu* 特性値cuk 0 5 10 15 20 25 0 20 40 60 深度 z (m ) 非排水せん断強さ cu(kN/m2) 導出値cu 推定値cu* 特性値cuk
(a)
(b)
(c)
Undrained shear strength
cu(kN/m2) 0 20 40 60 0 5 10 15 20 25 D ept h z (m )
Undrained shear strength
cu(kN/m2) 0 20 40 60 0 5 10 15 20 25 D ept h z (m )
Undrained shear strength
cu(kN/m2) 0 20 40 60 0 5 10 15 20 25 D ept h z (m ) : Derived :
c
u*
:c
uk : Derived :c
u*
:c
uk : Derived :c
u*
:c
ukFigure 4. Depth profiles of undrained shear strength cu: (a) uniform distribution; (b) uni-linear distribution; (c) tri-linear distribution.
Therefore, the boundary is revised from z = 21 m to z = 18 m, then the estimated value cu* and characteristic value cuk are obtained as shown in Figure 5(c). This depth profile is consistent with the depth profile of the consistency (see Figure 3), indicating a more rational distribution. However, the strength increase ratio with depth at a depth of z ≥ 18 m is still too large to be explained by soil mechanics. This fact indicates that most of the data at around z = 20 m were underestimated. This is consistent with the abovementioned outliers corresponding to the soil with low plasticity.
6 SUMMARY
This paper introduced the new practical method, which is adopted in the design code for port facilities in Japan, to determine the depth profile of the characteristic values of soil parameter. In this method, the depth profile of the derived values is modeled as the profile of the estimated values so as to be either the mean value or the regression line, then the correction factors are multiplied to the estimated value according to the coefficient of variation (if COV > 0.1) and the number of the data entries (if n < 10). This method, which is simplified without real statistical treatment, is partly consistent with the general design code such as Eurocode 7 and JGS4001. The characteristic value is
defined as 30% or 70% fractile values which correspond to 95% confidence level, when the number of data entries n is 10 and the data variation COV is 0.1. The characteristic value of the soil parameters used in the reliability design should be objectively determined with the same confidence level based on a statistical treatment. However, the mere statistical treatment that is independent from empirical know-how based on soil mechanics is unrealistic to achieve a certain confidence level in practice; because both the engineering judgment and geological interpretation are strongly required to model the depth profile in association with the soil stratification.
REFERENCES
1) The Japan Port and Harbour Association (2007): Technical standards, and commentaries for port and harbour facilities. (in Japanese)
2) EN 1997-1: 2004: Eurocode 7, Geotechnical design –Par 1: General rules.
3) JGS (2004): Principles for foundation design grounded on performance based design concept: JGS4001-2004.
4) EN 1990: 2002: Eurocode 0, Basis of structural design. 5) Orr, T.L.L. (2006): Development and implementation of
Eurocode 7, Proc. International Symposium on New Generation Design Codes for Geotechnical Engineering Practice – Taipei 2006, CD-ROM, 1-18.
6) Ovesen, N.K. (1995): Eurocode 7 for geotechnical design, Proc. Bengt B. Broms Symposium on Geotechnical 0 5 10 15 20 25 0 50 100 150 200 深度 z (m) 圧密降伏応力 pc(kN/m2) 導出値pc 0 5 10 15 20 25 0 20 40 60 深度 z (m ) 非排水せん断強さ cu(kN/m2) 導出値cu 推定値cu* 特性値cuk 0 5 10 15 20 25 0 20 40 60 深度 z (m ) 非排水せん断強さ cu(kN/m2) 導出値cu 推定値cu* 特性値cuk
(a)
(b)
(c)
Undrained shear strength
cu(kN/m2) 0 20 40 60 0 5 10 15 20 25 Dep th z (m )
Undrained shear strength
cu(kN/m2) 0 20 40 60 0 5 10 15 20 25 D ept h z (m )
Undrained shear strength
cu(kN/m2) 0 20 40 60 0 5 10 15 20 25 D ept h z (m ) : Derived : Derived :
c
u*
:c
uk : Derived :c
u*
:c
ukFigure 5. Depth profiles of mechanical properties: (a) depth profile of consolidation yield stress pc; (b) tri-linear depth profile of undrained shear strength cu omitting the outliers; (c) tri-linear depth profile of undrained shear strength cu with modified division of the soil layers.
Engineering, 333-360.
7) Schneider, H.R. (1997): Definition and determination of characteristic soil properties, Proc. 12th ICSMGE, 2271-2274.
8) Watabe, Y., Shiraishi, Y., Murakami, T. and Tanaka, M. (2007): Variability of physical and consolidation test results for relatively uniform clay samples retrieved from Osaka
Bay, Soils and Foundations, 47 (4), 701-716.
9) Watabe, Y. and Tanaka, M. (2004): History of geotechnical database for port and airport construction in Japan, Proceedings of the International Conference on Engineering Practice and Performance of Soft Deposits, IS-Osaka 2004, 409-414.