Prediction Models of Cognitive
Trajectories in Patients with
Nonamnestic Mild Cognitive
Impairment
Jin San Lee
1,2,3, Seong-Kyung Cho
4, Hee Jin Kim
1,2, Yeo Jin Kim
5, Key-Chung Park
3,
Samuel N. Lockhart
6, Duk L. Na
1,2,8, Changsoo Kim
7& Sang Won Seo
1,2,8,9To evaluate prediction models of cognitive trajectories in patients with nonamnestic mild cognitive impairment (naMCI) using group-based trajectory analysis, we evaluated 121 patients with naMCI who underwent at least their first three yearly assessments. Group-based trajectory models were used to classify cognitive trajectories based on Clinical Dementia Rating Sum of Boxes scores over four years in patients with naMCI. A total of 22 patients (18.2%) were classified into the “fast-decliners” group, while 99 patients (81.8%) were classified into the “slow-decliners” group. The mean age was higher in the decliners than in the slow-decliners (p = 0.037). Compared to the slow-decliners, the fast-decliners were more frequently impaired in the domains of language (p = 0.038) and frontal/executive functions (p = 0.042), and had more frequent multiple-domain cognitive impairment (p = 0.006) on baseline neuropsychological tests. The rate of conversion to dementia was significantly higher in the fast-decliners than in the slow-decliners (86.4% vs. 10.1%, p < 0.001). Our findings showed that there are indeed distinct patterns of cognitive trajectories in patients with naMCI. Close observation of naMCI patients’ baseline demographic and clinical profiles in clinical settings may help identify individuals at greatest risk for dementia.
Mild cognitive impairment (MCI) is a clinically heterogeneous syndrome, and the MCI syndrome can be clas-sified into amnestic and nonamnestic MCI (naMCI) subtypes depending on the degree of impairment in the memory domain1. Patients with naMCI have impairments in other cognitive domains than memory (e.g. frontal/
executive, language, or visuospatial). Previous studies have shown that amnestic MCI patients have a high likeli-hood of progressing to Alzheimer’s Disease (AD) dementia, whereas naMCI patients have a higher likelilikeli-hood of progressing to a non-AD dementia2–5. In particular, the causes and outcomes of cognitive impairments in naMCI
may be more heterogeneous6. However, to date, the long-term cognitive trajectories in patients with naMCI,
assessed using clinical and functional measures, are not well known.
Many studies have examined the clinical and neuropsychological profiles related to the likelihood of pro-gression from MCI to dementia. These previous reports have shown that older age, verbal memory impairment, frontal/executive dysfunction, multiple-domain impairment, and the presence of at least one apolipoprotein E (APOE) ε4 allele increase the risk of conversion to dementia7–12. However, most previous studies have evaluated
clinical outcomes by comparing naMCI with amnestic MCI, or by combining naMCI and amnestic MCI patients together12–14. So far, there have been no studies investigating the clinical profiles related to disease progression
of naMCI separately from amnestic MCI. Since the research criteria for MCI due to AD consider both amnestic
1Department of Neurology, Samsung Medical Center, Sungkyunkwan University School of Medicine, Seoul, 06351,
Korea. 2Neuroscience Center, Samsung Medical Center, 06351, Seoul, Korea. 3Department of Neurology, Kyung Hee
University Hospital, Seoul, Korea. 4Department of Preventive Medicine, Yonsei University Wonju College of Medicine,
Wonju, Korea. 5Department of Neurology, Chuncheon Sacred Heart Hospital, Hallym University College of Medicine,
Chuncheon, Korea. 6Department of Internal Medicine, Wake Forest School of Medicine, Winston-Salem, USA. 7Department of Preventive Medicine, Yonsei University College of Medicine, Seoul, Korea. 8Department of Health
Sciences and Technology, SAIHST, Sungkyunkwan University, Seoul, 06351, Korea. 9Clinical Research Design and
Evaluation, SAIHST, Sungkyunkwan University, Seoul, 06351, Korea. Correspondence and requests for materials should be addressed to S.W.S. (email: [email protected])
Received: 16 March 2018 Accepted: 1 July 2018 Published: xx xx xxxx
MCI and naMCI as possible prodromal stages of AD-type dementia, understanding the cognitive trajectories of naMCI has clinical importance15.
Group-based trajectory analysis provides a tool for figuratively painting a statistical portrait of the predictors and consequences of distinct trajectories of development16. It also can enable identification, summarization, and
communication of complex patterns in longitudinal data17. Group-based models have been applied to address
questions related to developmental trajectories in psychology18,19, medicine20, and criminology21. Several studies
have also used these models to facilitate causal inference in situations where randomization to treatment condi-tion is not possible22,23. Recently, a few studies have used trajectory analysis to identify predictive or prognostic
factors in patients with MCI10,24,25. However, no studies have applied this method to naMCI patients to determine
longitudinal cognitive trajectories.
To better understand the cognitive trajectories of naMCI, we evaluated 121 patients with naMCI who under-went at least their first three yearly assessments. The primary goal was to classify longitudinal cognitive trajecto-ries of naMCI using group-based trajectory analysis. The secondary goal was to evaluate the demographic and clinical risk factor profiles which best predicted the prognosis of naMCI patients. We hypothesized not only that group-based trajectory analysis would enable to identification of distinct groups of naMCI patients based on lon-gitudinal trajectories of decline, but also that specific patient characteristics would predict membership in these naMCI trajectory groups.
Results
Demographic and clinical characteristics.
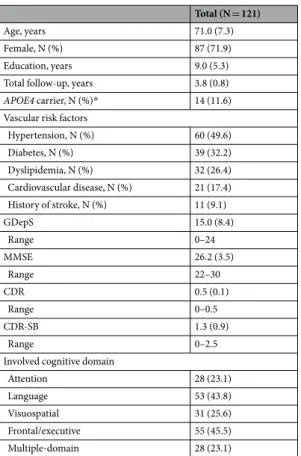
The demographic and clinical characteristics of participants at baseline are presented in Table 1. The mean age of participants was 71.0 years and 87 (71.9%) were female.APOE genotyping was performed in 76 (62.8%) of 121 patients, and 14 were ε4 carriers (11.6% of all patients).
The mean (standard deviation [SD]) Mini-Mental Status Examination (MMSE), Clinical Dementia Rating (CDR), and Clinical Dementia Rating Sum of Boxes (CDR-SB) scores at baseline were 26.2 (3.5), 0.5 (0.1), and 1.3 (0.9), respectively. The most frequently involved cognitive domain was frontal/executive function (45.5%), followed by language (43.8%) and visuospatial (25.6%) functions. A total of 28 (23.1%) patients were impaired in multiple cognitive domains; of these, five (17.9%) had three domains affected and 23 (82.1%) had two domains involved.
Groups identified by group-based trajectory analysis.
In order to define the cognitive trajectories based on CDR-SB score in patients with naMCI, we tested solutions varying the number of groups from one toTotal (N = 121)
Age, years 71.0 (7.3)
Female, N (%) 87 (71.9) Education, years 9.0 (5.3) Total follow-up, years 3.8 (0.8) APOE4 carrier, N (%)* 14 (11.6) Vascular risk factors
Hypertension, N (%) 60 (49.6) Diabetes, N (%) 39 (32.2) Dyslipidemia, N (%) 32 (26.4) Cardiovascular disease, N (%) 21 (17.4) History of stroke, N (%) 11 (9.1) GDepS 15.0 (8.4) Range 0–24 MMSE 26.2 (3.5) Range 22–30 CDR 0.5 (0.1) Range 0–0.5 CDR-SB 1.3 (0.9) Range 0–2.5
Involved cognitive domain
Attention 28 (23.1)
Language 53 (43.8)
Visuospatial 31 (25.6) Frontal/executive 55 (45.5) Multiple-domain 28 (23.1)
Table 1. Demographic and clinical characteristics of the study participants. Values are mean (SD), score,
or N (%). *APOE genotyping was performed in 76 (62.8%) of the 121 patients with naMCI. Abbreviations: N = number; SD = standard deviation; APOE4 = apolipoprotein E ε4; GDepS = Geriatric Depression Scale, MMSE = Mini-Mental State Examination; CDR = Clinical Dementia Rating; CDR-SB = Clinical Dementia Rating Scale Sum of Boxes.
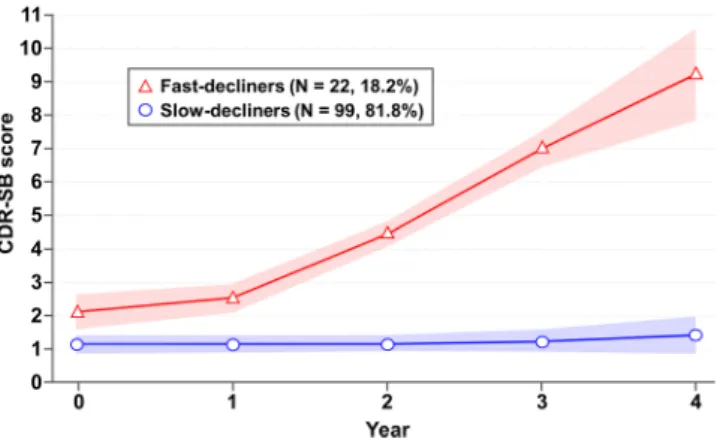
four. According to the Bayesian Information Criterion (BIC) value (−698.08), the two-group solution with a quadratic polynomial shape was found to be the most appropriate. The cognitive trajectories in 121 patients with naMCI are illustrated in Fig. 1. A total of 22 patients (18.2%) were classified into the “fast-decliners” group, while 99 patients (81.8%) were classified into the “slow-decliners” group. The change in CDR-SB score over four years was greater than seven points in the fast-decliners, but less than one point in the slow-decliners.
Identifying variables that distinguish trajectories.
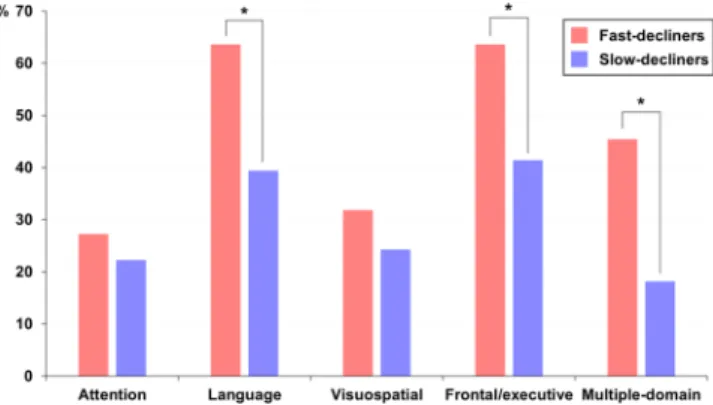
Table 2 presents the results of comparisons of demographic and clinical characteristics between the fast- and slow-decliners. The mean age was higher in the fast-decliners than in the slow-decliners (74.0 ± 6.7 vs. 70.4 ± 7.3, p = 0.037). There were no differences in the ratios of gender and years of education between the fast- and slow-decliners. In the fast-decliners, the cogni-tive and functional impairment evaluated by the CDR-SB at baseline was significantly greater than that of the slow-decliners (2.1 ± 0.8 vs. 1.1 ± 0.7, p < 0.001). In addition, we compared the proportion of participants with abnormal results on baseline neuropsychological tests between the two groups. Compared to the slow-decliners, the fast-decliners were impaired more frequently in the domains of language (p = 0.038) and frontal/executive functions (p = 0.042), and had more frequent multiple-domain cognitive impairment (p = 0.006, Fig. 2). In addi-tion, logistic regression analysis controlling for age and the number of impaired cognitive domains confirmed that impaired language (OR 7.7, p = 0.046) and frontal/executive functions (OR 8.2, p = 0.040) significantly pre-dicted membership in the fast-decliners group.Longitudinal changes in neuropsychological test performance over time by group-based
tra-jectories.
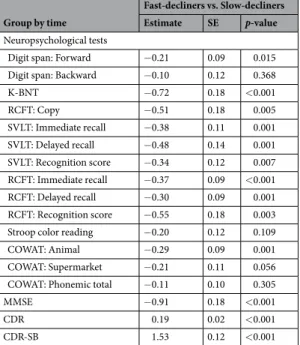
Table 3 shows mixed effects models examining how worsening in performance on neuropsycho-logical tests over time was related to naMCI patient group status, defined by the group-based trajectory method. Significant group-by-time interactions were obtained for most neuropsychological tests from baseline to year five. Over time, the fast-decliners showed significantly worse performance than the slow-decliners in the Korean version of the Boston Naming Test (K-BNT), the Seoul Verbal Learning Test (SVLT), the Rey-Osterrieth Complex Figure Test (RCFT), the Controlled Oral Word Association Test (COWAT, animal), MMSE, CDR, and CDR-SB scores. As shown in Table 2, the rate of conversion to dementia was significantly higher in the fast-decliners (86.4%) than in the slow-decliners (10.1%).Discussion
We assessed longitudinal cognitive trajectories in a sample of 121 patients with naMCI using group-based trajec-tory analysis based on CDR-SB scores. The results from the present study showed that there are indeed distinct patterns of cognitive trajectories in patients with naMCI: one group can be classified as fast-decliners, while the remaining participants can be classified as slow-decliners. Furthermore, we found that several baseline demo-graphic and clinical characteristics, including older age and impairments in the cognitive domains of language and frontal/executive functions, are risk factors for predicting future decline among naMCI patients. Given the increasing interest in the clinical outcomes of naMCI, our results suggest that close observation of naMCI patients’ baseline demographic and clinical profiles may help identify individuals at greatest risk for dementia.
The novelty of the present study is that it takes into account the variability of cognitive trajectories based on CDR-SB in individual patients, and thereby seeks to refine our understanding of the relationship between disease progression and prognosis. We found that the trajectory groups derived from our group-based trajectory mod-eling were a convenient statistical device for understanding cognitive trajectories in patients with naMCI. The fast-decliners, representing less than 20% of the study participants, showed continuous deterioration in CDR-SB scores over time, while the slow-decliners showed no change. To date, only a few studies have investigated lon-gitudinal performance in patients with naMCI26. However, these previous studies operationally defined clinical
Figure 1. Cognitive trajectories based on CDR-SB score from baseline (year 0) to year 4 among 121 patients
with naMCI. Shown are results of the group-based trajectory analysis used to identify groups of patients following a similar trajectory of cognitive decline over time, as assessed with the CDR-SB score at years 0, 1, 2, 3, and 4. The 2 cognitive trajectories that were identified are shown with 95% confidence intervals (red or blue shaded area). CDR-SB = Clinical Dementia Rating Scale Sum of Boxes; naMCI = nonamnestic mild cognitive impairment.
progression as a worsening on the CDR-SB over two years. In contrast, the trajectory analysis performed in the present study was designed to identify clusters of individuals who have followed a similar developmental trajec-tory on an outcome of interest17,27,28. To the best of our knowledge, this is the first study to conduct a data-driven
classification of naMCI patients based on longitudinal performance, rather than a longitudinal analysis based on
a priori classification.
Another noteworthy finding was that there were distinct baseline demographic and clinical profiles able to predict the prognosis of patients with naMCI. At baseline evaluation, the fast-decliners were older, had more frequent impairments in the domains of language and frontal/executive functions, and had more frequent multiple-domain involvement on neuropsychological testing compared to the slow-decliners. Our finding is partly consistent with a previous study, which showed that naMCI patients who clinically progressed were older and had lower baseline performance on category fluency and visuospatial tasks compared with naMCI patients who remained stable26. That study sample, however, consisted of single-domain (frontal/executive dysfunction)
naMCI patients. Notably, we found baseline impairments in both language and frontal/executive functions in
Fast-decliners
(N = 22) Slow-decliners (N = 99) P-value
Age, years 74.0 (6.7) 70.4 (7.3) 0.037 Female, N (%) 18 (81.8) 69 (69.7) 0.253 Education, years 7.7 (5.8) 9.3 (5.2) 0.205 Total follow-up, years 3.5 (0.7) 3.9 (1.4) 0.049 APOE4 carrier, N (%) 3 (13.6) 11 (11.1) 0.634 Vascular risk factors
Hypertension, N (%) 13 (59.1) 47 (47.5) 0.324 Diabetes, N (%) 10 (45.5) 29 (29.3) 0.142 Dyslipidemia, N (%) 4 (18.2) 28 (28.3) 0.331 Cardiovascular disease, N (%) 2 (9.1) 19 (19.2) 0.258 History of stroke, N (%) 1 (4.5) 10 (10.1) 0.412 GDepS 16.2 (8.1) 14.8 (8.5) 0.482 CDR-SB 2.1 (0.8) 1.1 (0.7) <0.001 Conversion to dementia 19 (86.4) 10 (10.1) <0.001 AD 14 (73.7) 6 (60.0) DLB 2 (10.5) 3 (30.0) SVaD 2 (10.5) 1 (10.0) CBS 1 (5.3) 0 (0.0)
Table 2. Comparisons of demographics, baseline neuropsychological test performances, and dementia
conversion between the fast- and slow-decliners in patients with naMCI. Values are mean (SD) or number (%). Chi-square and Student’s t-tests were performed to compare demographic variables between the fast- and slow-decliners groups. Abbreviations: N = number; SD = standard deviation; APOE4 = apolipoprotein E ε4; GDepS = Geriatric Depression Scale, MMSE = Mini-Mental State Examination; CDR = Clinical Dementia Rating; CDR-SB = Clinical Dementia Rating Scale Sum of Boxes; K-BNT = Korean version of the Boston Naming Test; RCFT = Rey-Osterrieth Complex Figure Test; SVLT = Seoul Verbal Learning Test; COWAT = Controlled Oral Word Association Test; AD = Alzheimer’s disease; DLB = dementia with Lewy bodies; SVaD = subcortical vascular dementia; CBS = corticobasal syndrome.
Figure 2. Comparisons between proportions of naMCI patients in the fast-decliners (red) and slow-decliners
(blue) groups with abnormal baseline neuropsychological test results. naMCI = nonamnestic mild cognitive impairment. *p < 0.05.
patients with naMCI strongly predicted membership in the fast-decliners group, even after controlling for age and the number of involved cognitive domains. Our results therefore suggest that investigating baseline clinical pro-files in patients with naMCI has important implications for identifying individuals who are at risk for dementia.
In the present study, mixed effects models also demonstrated that the fast-decliners group exhibited wors-ening in neuropsychological test performance over time, including worswors-ening in the memory domain. Indeed, patients with naMCI in our study mainly converted to clinically diagnosed AD dementia. Our findings are not in line with some previous studies showing that naMCI patients have a higher likelihood of progressing to a non-AD dementia2–5. This discrepancy could be explained by factors including differences between clinical and
patholog-ical diagnosis, a relatively small sample size, or insufficient follow-up. Indeed, several other studies have shown that a substantial number of naMCI patients progress to AD dementia during follow-up29,30.
Several limitations of the present study should be acknowledged. First, as the number of patients in the fast-decliners group was relatively small, the analyses may have had low statistical power. However, considering the prevalence of naMCI in community-based studies (0.5–6%)13,31,32, the results of our study still have clinical
significance. Further investigation with larger sample sizes and a longer follow-up period is needed to understand long-term trajectory of naMCI. Second, it is not a population-based study, which limits its generalizability to the general population. Third, we did not have molecular imaging or neuropathologic data on the participants. Fourth, there could be a large number of situations where a common pattern of change over time cannot be assumed. Fifth, although we followed naMCI patients for a minimum of three years, this may not have been a sufficient length of time to properly evaluate the likelihood of conversion to dementia. Finally, some of the par-ticipants in this study had somewhat high Geriatric Depression Scale (GDepS) or low MMSE scores. However, depression is common in individuals with MCI33,34 and the naMCI patients with high GDepS score in this study
did not meet the diagnostic criteria for major depressive disorder on baseline screening. Also, many elderly peo-ple in South Korea have low educational levels due to the Korean War, thus, the MMSE scores of the elderly who have normal cognitive function are relatively lower than those of other countries. We excluded participants who met criteria for dementia based on the Diagnostic and Statistical Manual of Mental Disorders-IV (DSM-IV)35,
not on the MMSE score.
In conclusion, our findings showed that there are indeed distinct patterns of cognitive trajectories in patients with naMCI. We suggest that evaluating baseline clinical profiles as risk factors for cognitive deterioration may help inform early-life interventions in patients with naMCI. Close observation of naMCI patients’ baseline demo-graphic and clinical profiles in clinical settings may help identify individuals at greatest risk for dementia.
Group by time
Fast-decliners vs. Slow-decliners Estimate SE p-value
Neuropsychological tests
Digit span: Forward −0.21 0.09 0.015 Digit span: Backward −0.10 0.12 0.368 K-BNT −0.72 0.18 <0.001 RCFT: Copy −0.51 0.18 0.005 SVLT: Immediate recall −0.38 0.11 0.001 SVLT: Delayed recall −0.48 0.14 0.001 SVLT: Recognition score −0.34 0.12 0.007 RCFT: Immediate recall −0.37 0.09 <0.001 RCFT: Delayed recall −0.30 0.09 0.001 RCFT: Recognition score −0.55 0.18 0.003 Stroop color reading −0.20 0.12 0.109 COWAT: Animal −0.29 0.09 0.001 COWAT: Supermarket −0.21 0.11 0.056 COWAT: Phonemic total −0.11 0.10 0.305
MMSE −0.91 0.18 <0.001
CDR 0.19 0.02 <0.001
CDR-SB 1.53 0.12 <0.001
Table 3. Mixed effects models of worsening in performance on neuropsychological tests over time by
group-based trajectories in patients with naMCI. Linear mixed effects model were performed using group (fast-decliners vs. slow-(fast-decliners), time, and the interaction term between group and time (group by time) as fixed effects and patient as a random effect. Age-, sex-, and education-specific z-scores were used in the comparison of longitudinal neuropsychological performance between the fast- and slow-decliners groups. Abbreviations: naMCI = non-amnestic mild cognitive impairment; SE = standard error; K-BNT = Korean version of the Boston Naming Test; RCFT = Rey-Osterrieth Complex Figure Test; SVLT = Seoul Verbal Learning Test; COWAT = Controlled Oral Word Association Test; MMSE = mini-mental state examination; CDR = Clinical Dementia Rating; CDR-SB = Clinical Dementia Rating sum of boxes.
Methods
Participants.
The study participants were included from two registry studies: 54 patients with naMCI from the Memory Disorder Clinic in Samsung Medical Center (May 2003 to June 2015) and 67 patients with naMCI from the Clinical Research Center for Dementia of South Korea study, a nationwide multicenter cohort study of cognitive disorders involving 31 memory disorder clinics at universities and general hospitals in South Korea (September 2005 to August 2012)36. These two studies used a common standardized diagnostic assessment, whichincluded an assessment for the diagnostic criteria for naMCI. All participants met the clinical criteria proposed by Petersen1: cognitive complaints reported by patients or by their caregiver; scores lower than −1.0 SD of the age-,
sex-, and education-adjusted norms on tests for at least one of the main cognitive domains except memory; gen-erally intact activities of daily living; and the absence of dementia. They also had completed at least their first three yearly assessments, with the same interview and neuropsychological testing conducted at both their baseline and follow-up evaluations. The study participants were recruited according to the modified questionnaire of Health screening and random recruitment for cognitive aging research37.
Participants were excluded if they met criteria for dementia based on the DSM-IV; had a history of a neu-rological disorder, current psychiatric illness, substance abuse, or head trauma with loss of consciousness; had uncontrolled diabetes or hypothyroidism; or were taking medications that affect cognition. Participants under-went a brain magnetic resonance imaging scan and were excluded if they had a cerebral, cerebellar, or brainstem infarction; hemorrhage; brain tumor; hydrocephalus; severe cerebral white matter hyperintensities (deep white matter ≥2.5 cm and caps or band ≥1.0 cm); or severe head trauma.
Standard protocol approvals, registrations, and patient consents.
We obtained written informed consent from each patient. This study was approved by the Institutional Review Board at the Samsung Medical Center. All methods were carried out in accordance with approved guidelines.Neuropsychological testing and clinical assessments.
All participants underwent neuropsycholog-ical testing using a standardized neuropsychologneuropsycholog-ical battery, the Seoul Neuropsychologneuropsycholog-ical Screening Battery38.The battery contains tests for attention, language, praxis, elements of Gerstmann syndrome, visuoconstructive function, verbal and visual memory, and frontal/executive function. The battery in the present study includes Digit span (forward and backward), K-BNT, RCFT (copying, immediate and 20-minute delayed recall, and rec-ognition), SVLT (3 learning-free recall trials of 12 words, a 20-minute delayed recall trial for these 12 items, and a recognition test), phonemic and semantic COWAT, and a Stroop Test (word and color reading of 112 items during a 2-minute period). Age-, sex- and education-specific norms for each test, based on 447 normal subjects, were used for comparison. Z-scores lower than −1.0 SD of the age-, sex- and education-adjusted norms were considered abnormal. We also performed MMSE, CDR, CDR-SB, and GDepS.
Conversion to dementia.
The diagnosis of dementia was based on criteria from the DSM-IV and required clinical evidence of cognitive deficits confirmed by neuropsychological testing, as well as evidence of impairment in social or occupational functions confirmed by activities of daily living scales. The MMSE or CDR-SB scores were not used in the determination of the diagnosis of dementia. For the diagnosis of probable AD, we used the criteria of the National Institute of Neurological and Communicative Disorders and Stroke-Alzheimer’s Disease and Related Disorders Association39. Established diagnostic criteria for clinical dementia with Lewy bodies,sub-cortical vascular dementia, and corticobasal syndrome were also used40–42.
Statistical analyses.
We used group-based trajectory models (SAS Proc Traj; SAS Institute Inc) to clas-sify cognitive trajectories based on CDR-SB scores over four years in 121 patients with naMCI28. The modelselection for the trajectory analysis was based on the BIC values between models28. The BIC enables a balance
of both model complexity and model fit, in a manner similar to the adjusted R2, with lower numbers indicating
a better model fit. The appropriate number of trajectories and trajectory shape were selected by recommended procedures19,28,43.
Continuous variables were presented as means ± SD and were compared using Student’s t-test. Categorical variables were compared using the Chi-square test or Fisher’s exact test. To investigate the effects of baseline neu-ropsychological test abnormalities on cognitive trajectory group based on CDR-SB score, we performed a logis-tic regression analysis after entering age (continuous), neuropsychological test abnormalities on each cognitive domain (three categories: language, visuospatial, frontal/executive functions), and single- or multiple-domain involved status as the independent variables, and group as the dependent variable. To determine whether there were significant differences in neuropsychological performance over time between the groups, we also performed linear mixed effects modeling using age, years of education, group, time, and the interaction term between group and time (group by time) as fixed effects, and patient as a random effect. Statistical significance was set at p < 0.05 in two-tailed tests. Statistical analyses were performed using SPSS version 20.0 (SPSS Inc., Chicago, IL, USA).
References
1. Winblad, B. et al. Mild cognitive impairment–beyond controversies, towards a consensus: report of the International Working Group on Mild Cognitive Impairment. J Intern Med 256, 240–246 (2004).
2. Petersen, R. C. et al. Current concepts in mild cognitive impairment. Arch Neurol 58, 1985–1992 (2001). 3. Petersen, R. C. Mild cognitive impairment as a diagnostic entity. J Intern Med 256, 183–194 (2004).
4. Ferman, T. J. et al. Nonamnestic mild cognitive impairment progresses to dementia with Lewy bodies. Neurology 81, 2032–2038 (2013).
5. Molano, J. et al. Mild cognitive impairment associated with limbic and neocortical Lewy body disease: a clinicopathological study.
Brain 133, 540–556 (2010).
7. Perri, R., Serra, L., Carlesimo, G. A. & Caltagirone, C. Amnestic mild cognitive impairment: difference of memory profile in subjects who converted or did not convert to Alzheimer’s disease. Neuropsychology 21, 549–558 (2007).
8. Tabert, M. H. et al. Neuropsychological prediction of conversion to Alzheimer disease in patients with mild cognitive impairment.
Arch Gen Psychiatry 63, 916–924 (2006).
9. Palmer, K., Backman, L., Winblad, B. & Fratiglioni, L. Mild cognitive impairment in the general population: occurrence and progression to Alzheimer disease. Am J Geriatr Psychiatry 16, 603–611 (2008).
10. Xie, H., Mayo, N. & Koski, L. Identifying and characterizing trajectories of cognitive change in older persons with mild cognitive impairment. Dement Geriatr Cogn Disord 31, 165–172 (2011).
11. Lee, S. J., Ritchie, C. S., Yaffe, K., Stijacic Cenzer, I. & Barnes, D. E. A clinical index to predict progression from mild cognitive impairment to dementia due to Alzheimer’s disease. PLoS One 9, e113535 (2014).
12. Espinosa, A. et al. A longitudinal follow-up of 550 mild cognitive impairment patients: evidence for large conversion to dementia rates and detection of major risk factors involved. J Alzheimers Dis 34, 769–780 (2013).
13. Busse, A., Hensel, A., Guhne, U., Angermeyer, M. C. & Riedel-Heller, S. G. Mild cognitive impairment: long-term course of four clinical subtypes. Neurology 67, 2176–2185 (2006).
14. Tifratene, K., Robert, P., Metelkina, A., Pradier, C. & Dartigues, J. F. Progression of mild cognitive impairment to dementia due to AD in clinical settings. Neurology 85, 331–338 (2015).
15. Albert, M. S. et al. The diagnosis of mild cognitive impairment due to Alzheimer’s disease: recommendations from the National Institute on Aging-Alzheimer’s Association workgroups on diagnostic guidelines for Alzheimer’s disease. Alzheimers Dement 7, 270–279 (2011).
16. Nagin, D. S. Group-based trajectory modeling: an overview. Ann Nutr Metab 65, 205–210 (2014).
17. Nagin, D. S. & Odgers, C. L. Group-based trajectory modeling in clinical research. Annu Rev Clin Psychol 6, 109–138 (2010). 18. Kaup, A. R. et al. Trajectories of Depressive Symptoms in Older Adults and Risk of Dementia. JAMA Psychiatry (2016).
19. Helgeson, V. S., Snyder, P. & Seltman, H. Psychological and physical adjustment to breast cancer over 4 years: Identifying distinct trajectories of change. Health Psychology 23, 3–15 (2004).
20. Buscot, M. J. et al. Bayesian hierarchical piecewise regression models: a tool to detect trajectory divergence between groups in long-term observational studies. BMC Med Res Methodol 17, 86 (2017).
21. Weisburd, D., Bushway, S., Lum, C. & Yang, S.-M. Trajectories of crime at places: a longitudinal study of street segments in the city of Seattle. Criminology 42, 283–322 (2004).
22. Odgers, C. L. et al. Is it important to prevent early exposure to drugs and alcohol among adolescents? Psychol Sci 19, 1037–1044 (2008).
23. Haviland, A., Nagin, D. S., Rosenbaum, P. R. & Tremblay, R. E. Combining group-based trajectory modeling and propensity score matching for causal inferences in nonexperimental longitudinal data. Dev Psychol 44, 422–436 (2008).
24. David, N. D., Lin, F. & Porsteinsson, A. P. Trajectories of Neuropsychiatric Symptoms and Cognitive Decline in Mild Cognitive Impairment. Am J Geriatr Psychiatry 24, 70–80 (2016).
25. Dodge, H. H., Mattek, N. C., Austin, D., Hayes, T. L. & Kaye, J. A. In-home walking speeds and variability trajectories associated with mild cognitive impairment. Neurology 78, 1946–1952 (2012).
26. Johnson, J. K. et al. Baseline predictors of clinical progression among patients with dysexecutive mild cognitive impairment. Dement
Geriatr Cogn Disord 30, 344–351 (2010).
27. Nagin, D. S. Overview of a semi-parametric, group-based approach for analyzing trajectories of development (2002).
28. Jones, B. L., Nagin, D. S. & Roeder, K. A SAS procedure based on mixture models for estimating developmental trajectories.
Sociological Methods & Research 29, 374–393 (2001).
29. Schneider, J. A., Arvanitakis, Z., Leurgans, S. E. & Bennett, D. A. The neuropathology of probable Alzheimer disease and mild cognitive impairment. Ann Neurol 66, 200–208 (2009).
30. Vos, S. J. et al. Prediction of Alzheimer disease in subjects with amnestic and nonamnestic MCI. Neurology 80, 1124–1132 (2013). 31. Ma, F. et al. Prevalence of Mild Cognitive Impairment and Its Subtypes among Chinese Older Adults: Role of Vascular Risk Factors.
Dement Geriatr Cogn Disord 41, 261–272 (2016).
32. Sachdev, P. S. et al. The Prevalence of Mild Cognitive Impairment in Diverse Geographical and Ethnocultural Regions: The COSMIC Collaboration. PLoS One 10, e0142388 (2015).
33. Reinlieb, M., Ercoli, L. M., Siddarth, P., St Cyr, N. & Lavretsky, H. The patterns of cognitive and functional impairment in amnestic and non-amnestic mild cognitive impairment in geriatric depression. Am J Geriatr Psychiatry 22, 1487–1495 (2014).
34. Ismail, Z. et al. Prevalence of Depression in Patients With Mild Cognitive Impairment: A Systematic Review and Meta-analysis.
JAMA Psychiatry 74, 58–67 (2017).
35. Diagnostic and Statistical Manual of Mental Disorders. American Psychiatric Association: Washington, DC ed 4 (1994).
36. Park, H. K. et al. Clinical characteristics of a nationwide hospital-based registry of mild-to-moderate Alzheimer’s disease patients in Korea: a CREDOS (Clinical Research Center for Dementia of South Korea) study. J Korean Med Sci 26, 1219–1226 (2011). 37. Christensen, K. J., Moye, J., Armson, R. R. & Kern, T. M. Health screening and random recruitment for cognitive aging research.
Psychol Aging 7, 204–208 (1992).
38. Ahn, H. J. et al. Seoul Neuropsychological Screening Battery-dementia version (SNSB-D): a useful tool for assessing and monitoring cognitive impairments in dementia patients. J Korean Med Sci 25, 1071–1076 (2010).
39. McKhann, G. et al. Clinical diagnosis of Alzheimer’s disease: report of the NINCDS-ADRDA Work Group under the auspices of Department of Health and Human Services Task Force on Alzheimer’s Disease. Neurology 34, 939–944 (1984).
40. McKeith, I. G. et al. Diagnosis and management of dementia with Lewy bodies: third report of the DLB Consortium. Neurology 65, 1863–1872 (2005).
41. Erkinjuntti, T. et al. Research criteria for subcortical vascular dementia in clinical trials. J Neural Transm Suppl 59, 23–30 (2000). 42. Mathew, R., Bak, T. H. & Hodges, J. R. Diagnostic criteria for corticobasal syndrome: a comparative study. J Neurol Neurosurg
Psychiatry 83, 405–410 (2012).
43. Jung, T. & Wickrama, K. A. S. An introduction to latent class growth analysis and growth mixture modelling. Social and Personality
Psychology Compass 2, 302–317 (2008).
Acknowledgements
This research was supported by the Brain Research Program through the National Research Foundation of Korea (NRF) funded by the Ministry of Science, ICT & Future Planning (2016M3C7A1913844), by a NRF grant funded by the Korean government (2015R1C1A2A01053281 and 2017R1A2B2005081), by the Fire Fighting Safety & 119 Rescue Technology Research and Development Program funded by National Fire Agency (MPSS-2015-80), and by the Korea Ministry of Environment (MOE) as the “Environmental Health Action Program (2014001360002)”.
Author Contributions
J.S. Lee and S.W. Seo designed the study. J.S. Lee, H.J. Kim, Y.J. Kim, D.L. Na, and S.W. Seo acquired the data, which J.S. Lee, S.K. Cho, H.J. Kim, Y.J. Kim, K.C. Park, D.L. Na, C. Kim, and S.W. Seo analyzed. J.S. Lee, S.N. Lockhart, and S.W. Seo wrote the article, which all authors reviewed and approved for publication.
Additional Information
Competing Interests: The authors declare no competing interests.
Publisher's note: Springer Nature remains neutral with regard to jurisdictional claims in published maps and
institutional affiliations.
Open Access This article is licensed under a Creative Commons Attribution 4.0 International
License, which permits use, sharing, adaptation, distribution and reproduction in any medium or format, as long as you give appropriate credit to the original author(s) and the source, provide a link to the Cre-ative Commons license, and indicate if changes were made. The images or other third party material in this article are included in the article’s Creative Commons license, unless indicated otherwise in a credit line to the material. If material is not included in the article’s Creative Commons license and your intended use is not per-mitted by statutory regulation or exceeds the perper-mitted use, you will need to obtain permission directly from the copyright holder. To view a copy of this license, visit http://creativecommons.org/licenses/by/4.0/.