In this paper, we present the Touch Text exTractor (Touch TT), an interactive text segmentation tool for the extraction of scene text from camera-based images. Touch TT provides a natural interface for a user to simply indicate the location of text regions with a simple touchline. Touch TT then automatically estimates the text color and roughly locates the text regions. By inferring text characteristics from the estimated text color and text region, Touch TT can extract text components. Touch TT can also handle partially drawn lines which cover only a small section of text area. The proposed system achieves reasonable accuracy for text extraction from moderately difficult examples from the ICDAR 2003 database and our own database.
Keywords: Scene text recognition, touchscreen interface.
Manuscript received Feb. 22, 2010; revised Sept. 2, 2010; accepted Sept. 20, 2010. This work was supported by the Korea Science and Engineering Foundation (KOSEF) grant funded by the Korea government (MOST) 2009-0078943.
Jehyun Jung (phone: +82 42 350 7817, email: [email protected]) SeongHun Lee (email: [email protected]), Min Su Cho (corresponding author, email: [email protected]), and Jin Hyung Kim (email: [email protected]) are with the Department of Computer Science, KAIST, Daejeon, Rep. of Korea.
doi:10.4218/etrij.11.1510.0029
I. Introduction
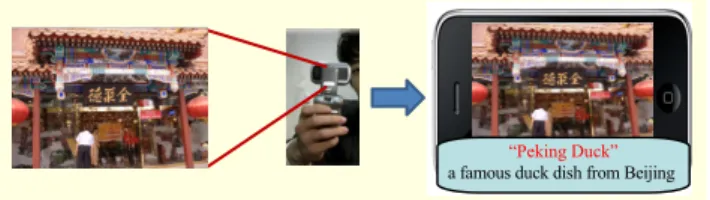
Scene text recognition via mobile phones has recently received a great deal of attention from many researchers [1], [2]. Automatically discovering text information, such as the titles of books and DVDs, landmarks, logos, contact information, signboards, and restaurant names from scene images, can be useful for various content-based applications in mobile devices. If smart phones can understand the meaning of text embedded in captured images, they can provide diverse services, such as language translation, touring information, and assistance to the visually impaired. For example, as a user simply snaps a photo of a restaurant signboard, an internet-connected mobile device can instantly recognize the name of the restaurant and return relevant information about the establishment (Fig. 1).
While segmentation and recognition of text from scanned document images have been quite successful, the extraction of colored scene text poses a new challenge. As the first step of the overall scene text recognition system, successful text region extraction from the original image is crucial for all other steps of the text recognition process. Errors at this point are propagated all along the recognition system. Thus, achieving accuracy in identifying the text region is a major challenge. There are many problems related to separating text from
Fig. 1. Usage of scene text in mobile devices.
“Peking Duck”
a famous duck dish from Beijing
Touch TT: Scene Text Extractor Using
Touchscreen
Interface
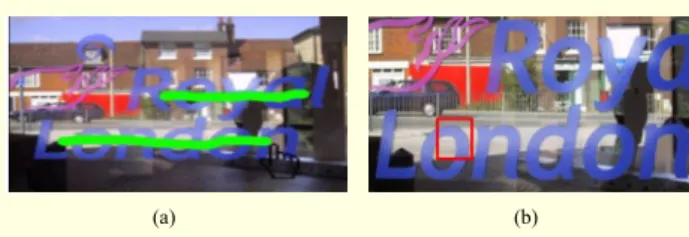
Fig. 2. User interface: (a) Touchline and (b) Focus.
(a) (b)
camera-captured images that await solution. Text extraction from unconstrained natural scene images is difficult due to the lack of any prior knowledge of text features, such as text color, font, size, orientation, or even the location of the probable text regions. In addition, scene images usually have non-uniform illumination due to uncontrolled lighting conditions and the presence of shadows. It is also common for the content and background in outdoor images to have complex layouts. When the system scans the whole image for text, non-text pixels surrounding the actual text could be confused for text if they form shapes similar to that of text. As an example, the bars on a window could be interpreted as a series of I’s. Finally, the greatest present challenge is that, since computational power in a mobile device is limited, current complicated text extraction methods processing the whole image cannot be applied in real-time devices. Such complications make extracting text from scene images a persistent challenge.
To handle these challenging issues related to scene text extraction, we suggest an interactive vision system by borrowing the power of a user interface. On the basis that most smart-phones provide a touchscreen, we offer a novel and natural user interface called Touchline. By using Touchline, the user can give a hint regarding the location of the text regions with a single touch on the screen of a mobile phone (Fig. 2(a)). The extraction module in the proposed system can infer text information from the user’s hints. The proposed method has outstanding features that distinguish it from previous methods. First, text separation using the proposed system would be much easier even from a complex background since the system can estimate the color of the target text region in advance. Second, the proposed system cannot only reduce false detection caused by the surrounding non-text regions but also reduce the computation time for text separation in mobile devices by restricting the search area to the user’s indicated section. The proposed system achieves reasonable accuracy for text extraction from moderately difficult examples from the ICDAR 2003 database and our own database.
The balance of this paper is organized as follows. Section II presents related works on the scene text extraction method. Section III describes a general overview of our proposed system. In sections IV and V, the algorithm of our proposed
system is explained in detail: component extraction, text verification, and text region expansion. In section VI, the efficiency and performance of the suggested system are experimentally evaluated. The paper concludes in section VII.
II. Related Works
Due to the enormous potential that text information extraction has for commercial applications, research on text extraction for camera-based scene images is being pursued both in academia and industry. There are many reports in the literature regarding different techniques that researchers are suggesting to overcome the current challenges [3], [4]. Ezaki and others [1] proposed a four-step text extraction method based on connected components: Sobel edge detection, Otsu binarization, connected component extraction, and rule-based connected component filtering. Gatos and others [5] applied binarization techniques to both gray and inverted gray images and chose the optimum result between both binarization results. However, binarization on gray-scale images cannot distinguish different color components having the same luminance.
Kim and others [6] combined color continuity, gray level variation, and color variance features to extract text regions. Park and others [7] first split color pixels into chromatic and achromatic components and then separated them by histogram-based K-means clustering. All these methods could result in many missed and false detections with natural scene images. In other words, many text regions might not be detected (false negative errors), or background noise might be interpreted as a text region (false positive errors). Such errors could affect the performance of the optical character recognition (OCR) systems. From this review of the literature, we may conclude that text extraction from natural scene images is still a challenging problem, especially for images with complex backgrounds and natural illumination.
To reliably separate objects from their backgrounds, interactive vision systems that enlist the power of a user interface have been suggested. For instance, Lazy Snapping cuts [8] and GrabCut [9] adopt interactive graph cuts to segment objects from backgrounds; intelligent scissors allow objects within digital images to be extracted quickly and accurately using simple gesture motions with a mouse. Likewise, we proposed Focus (a resizable square rim) as an interface to help users point out a target character in our previous system [10] (Fig. 2(b)). With a hint from Focus regarding the location of the target text, the color of the target text is easily estimated by clustering colors only within the focused section. Since we know in advance the color of the target text region, text separation is much easier, even from complex backgrounds. In addition, restricting the search area to
within the focused section can prevent misclassification errors caused by surrounding non-text regions. After obtaining the target text region within the identified section, the target text region is expanded iteratively by searching neighboring sections using the updated text color. Such an iterative method would prevent the problem of one text region being separated into more than one due to non-uniform illumination and reflection.
Although Focus is a powerful tool to separate text from background, the previous approach using Focus has some limitations. First, the identified focus area is assumed to cover a single text character, and the system does not know the locations of the other neighboring characters. This is why the system assumes that the text regions are aligned horizontally to reduce the searching time. If the system considers texts are located in various angles, it has to scan all possibilities so that computational time can also increase. In addition, if we remove horizontal constraint, the system can produce unexpected results. For instance, when a user indicates the first ‘o’ of “London” in Fig. 2, ‘R’ in the diagonal direction (the first character of “Royal”) can be also detected as a part of text region. There are so many options to be considered when there is no restriction on the searching neighbors. So, we restricted the horizontal line in the Focus. As a result, each focus rim is usually related to only one word, and thus the user must select several target areas to extract multiple lines of text. Second, when the user indicates a subpart (radical) of a character, the system regards the extracted radical component as a whole character region. Consequently, it cannot find whole text regions based on a small piece of the character region. Therefore, we now extend our previous system by exploiting the touch interface of modern devices in order to obtain a raw estimation of the text position from the user. Getting information using Touchline is more intuitive for the user than using Focus, and it gives more information to the system. This approach can reduce computational complexity and improve extraction performance.
III. System Overview
In this paper, we propose a scene text extraction system called Touch Text exTractor (Touch TT) for isolating text regions from natural scene images. Our proposed system utilizes touchline information drawn by the user on a touchscreen interface. The interaction with the user permits a reduction in computational complexity and an improvement in performance. On the other hand, the main difference with respect to the previous work, where the user has only to indicate one or more single focus area(s), is that in this method, the user provides more information by drawing one or more
Fig. 3. Overview of scene text separation using Touchline. • • • • • •
Component extraction Image binarization with
color information Noise removal Image + Touch Color 2 Color 1 Color 3 Text verification
Extracted text region
Text candidate 1 Text candidate 2 Text candidate 3 Selection of character color candidates
Text region expansion
Fig. 4. Touch TT prototype. Internet
Mobile scene text recognition system
Mobile device with camera
Server Natural scene with line
Recognition result Internet search
lines over the text/word to be extracted. Touchline interface is a natural way for users to interact with the extraction application; it enables users to draw lines at various angles, which allows Touch TT to recognize non-horizontally aligned text.
The main algorithm has two functions: it generates text region candidates, and it verifies the label of the candidate regions (as text or non-text). The text region candidates are generated through an adaptive binarization algorithm that utilizes text color candidates obtained from the touchlines. The candidate labels are then verified via heuristic rules based on the characteristics of the text regions. As shown in Fig. 3, the key steps of this framework are the selection of text color candidates, extraction of text components, verification of text components, and expansion of the text region. These steps will be explained in sections IV and V.
implemented a prototype system based on the Android phone (Fig. 4). When Touch TT in a mobile device achieves a binarized text image, it sends the result to the server. After the OCR module in the server recognizes the text area, the server sends not only the final recognition result but also the translation result back to the mobile device. After that, various functions, such as internet searches, can be performed using the recognition and translation result.
IV. Component Extraction with Color Information
1. Selection of Text Color CandidatesText regions are predicted by a bottom-up process of image segmentation. Image segmentation is built based on two assumptions about text regions: homogeneity of text color and distinctiveness between text and background regions. Since the pixel colors are similar within a given text region, they can be grouped separately from the background based on their color value. If the system knows the color of the text, the text regions can be easily extracted by reference to the text color.
When the user draws a line on the text region, Touch TT estimates the text color from the user’s line information. However, since the number of pixels on a touchline is small, it is difficult to estimate the true text color. Thus, Touch TT scans a broader area by surveying additional lines (two higher and two lower lines within a certain distances) around the user’s line. In the experiment, the distance was set to a tenth of image height which shows the best performance for the validation set. Touch TT analyzes the rough text area and selects color candidates for the target text. Since the line area contains only a small number of different colors, it is easier to estimate the target text color compared to searching through the entire image. Whereas the proportion of the entire image accounted for by the text region is generally relatively small, the text region generally occupies a significant proportion of the user-selected search area, so the text color may be identified as one of the dominant colors inside the search area. For example, from the image in Fig. 5, Touch TT extracts four dominant colors (light blue, dark blue, light gray, and dark gray) with the hope that the target text color is included in the identified colors.
Generally, the text itself will occupy a significant portion of the region selected by the user; thus, it is considered that the text color will be one of the most prevalent colors in the area selected by the user and will likely be one of the distinct colors near the touchline that describes the boundary between the text and the background. For this approach, we assume that the characters have a uniform color. Color clustering is a common approach to find the major colors from an image [11]. However,
Fig. 5. Selection of text color candidates from the touchline.
Fig. 6. Color clustering result including bounding pixels.
when clustering the pixels around the touchline between the text and the background, the color of the text boundary pixels might be chosen as the representative text color in place of the true text color. Boundary pixels usually have colors that are mixes between the text and background colors. When clustering approaches select boundary pixels as representative of the text color, then the text components and background are sometimes combined in the text extraction result, or only a partial region of the characters is extracted (Fig. 6).
To prevent this adverse effect of boundary pixels, Touch TT samples non-boundary pixels, that is, pixels in homogeneous areas which have low edge intensity, from the user selected region. The edge value is obtained as the maximum magnitude of a Sobel mask [12] among the red, green, and blue color channels on each pixel.
2 2 ( , ) ( , ) ( , ) | ( , ) | | ( , ) |, r r r r r x y x y G x y = G x y +G x y ≈ G x y + G x y (1) 2 2 ( , ) ( , ) ( , ) | ( , ) | | ( , ) |, g g g g g x y x y G x y = G x y +G x y ≈G x y + G x y (2) 2 2 ( , ) ( , ) ( , ) | ( , ) | | ( , ) |, b b b b b x y x y G x y = G x y +G x y ≈G x y + G x y (3) ( , ) max{ r( , ), g( , ), b( , )}, G x y = G x y G x y G x y (4)
where G x y G x yr( , ), g( , ), andG x yb( , )are edge magnitude values in red, green, and blue channel images. Then, the system samples pixels which have minimum edge intensity values, considering the neighboring pixels in each (3×3) window.
Fig. 7. Color distribution of (a) original image and (b) sampled pixels.
(a) (b)
( , ) ( , ), 1 , 1.
G x y ≤G x n y m+ + − ≤n m≤ (5)
Since most pixels with minimum edge values belong to either the text region or the background region, we can avoid the undesirable effect of interpreting boundary pixels as text region pixels through our approach. Figure 7 illustrates the color distribution of the sampled pixels from the original image. The color distribution of the original image shows that the colors of the text and the background are mixed and indistinct. On the other hand, the color distribution of the sampled pixels shows that they are well separated.
Touch TT applies a clustering algorithm to the sampled pixels to select representative colors. There are two well-known clustering methods: K-means clustering and mean-shift clustering. The K-means clustering algorithm [13] finds the most dominant K colors from the targeted region. It first selects
K cluster seeds randomly, and it then assigns each pixel to the
group that has the closest centroid. When all pixels have been assigned, it recalculates and updates the positions of the K centroids. These phases are iteratively repeated until the K centroids are converged. On the other hand, the mean-shift algorithm [14] separates pixels into clusters by estimating modes of data. First, it selects one sampled pixel (r, g, b), and it constructs a cube in which the length of one side is 2h. Then, it calculates the new location (r', g', b') by averaging the values of pixels in the cube and moves the cube to (r', g', b').
0 0 0 ( ) ( ) ( ) 0 0 0 ( ) ( ) ( ) ( , , ) , ( , , ) { , , }, h h h i r h g h b h i h h h r h g h b h C p r r g g b b C p r r g g b b C r g b =− =− =− =− =− =− ⋅ + + + ′ = + + + =
∑ ∑ ∑
∑ ∑ ∑
(6) where p(r, g, b) means the number of pixels that have the color value (r, g, b). It repeats the calculation of the average of the pixels in the cube and relocates the cube until the centroids areconverged.
When applying the mean-shift algorithm, we do not need to select the number of clusters (in contrast with K in the K-means algorithm). However, the mean-shift algorithm is more time-consuming than the K-means algorithm, which is a critical drawback for our application in mobile devices. Whereas it is hard to determine the number of clusters when applying K-means clustering to the whole image because of various color distributions in different scene images, a small number of clusters is sufficient to find the text color within the limited user selected area. When the number of clusters is set as five, the K-means algorithm shows excellent performance in our experiment. From the clustering result, Touch TT selects representative text color candidates along the user’s touchline. 2. Generation of Text Region Candidates
Touch TT then extracts text candidate components independently for each text color candidate by applying a binarization algorithm (black-pixel components in Fig. 8, top row). Noise removal rules are used to handle noise components (Fig. 8, bottom row). For instance, when connected components are not overlapped with the lines (the user’s indicated line and the system’s added lines), those connected components are regarded as noise and removed.
With the text color candidate acquired in the clustering algorithm, Touch TT extracts the text component from the image. However, a simple assignment of pixels into one of the text color candidates could cause erroneous extraction results. For example, the clustering algorithm frequently separates pixels in one text component into different groups when there is a color gradation (Fig. 9). On the other hand, the binarization method can effectively separate the scene text from complex
Fig. 8. Text component extraction.
backgrounds in cases where the text pixels have similar color values distinguishable from the background. Furthermore, the binarization method has a tendency to extract the text region as a single component even if the text color varies due to reflections or uneven illumination, provided the variation occurs in a smooth gradation.
The binarization process is independently applied for each text color candidate (called seed colors) since the system does not know the true text color. An image binarization technique using each seed color is conducted to classify the whole image area into two regions, that is, one region for colors similar to that of the text color candidate and the other for different colors. The similarity between each pixel color and candidate color is represented as the color distance value. The more similar each pixel and the candidate color are, the smaller the color distance value is. Considering that the text found in most scenes is designed to be easily visible, it would be effective to use a color distance which well represents the human perception of colors. Thus, we have chosen to use a perceptually uniform color space, the hue (h), chroma (c), and luminance (l) space (HCL color space) [15]. The HCL distance between a pixel color (h, c, l) and a seed color (hs, cs, ls) is defined as
2 2 2
HCL L( s) CH{ s 2 s cos( s)},
D = A l l− +A c +c − cc h h− (7)
where AL =0.1,ACH =0.2 (+ −h hs) 2. AL is a constant of linearization for luminance, and ACH is a parameter which helps to reduce the distance between colors having the same hue value as the hue in the seed color. The HCL distance is more suitable in the case of scene text images, that is, the hue is more robust in the presence of illumination changes than the RGB color (Fig. 10). Figure 11 shows the difference between the RGB Euclidean distance and the HCL distance, where the gray scale represents the distance from the seed color. The pixels with small color distance values are a dark color. The red points of the two images indicate the seed text colors. In the RGB distance-of-color image, the upper and lower parts of the text region are very different; the lower parts of the text are rather close in color to the background of the image. On the other hand, in the HCL distance-of-color image, every part of the text region shows as uniformly dark and is separated from the background.
The binarization method requires a threshold for borders between two regions. In contrast to the global binarization method [16], which uses a fixed global threshold, the adaptive binarization method [17] finds thresholds adaptively for each pixel. As shown in Fig. 5, even if the color of the background pixels is similar to that of the seed color, by comparing the colors in the neighboring areas, the text region and the background region can be distinguished. The threshold for each pixel is calculated from the distribution of the histogram
Fig. 10. HCL color distance of Fig. 5.
Fig. 11.Comparison on the color distance: (a) original image, (b) RGB color image, and (c) HCL distance-of-color image.
(a) (b) (c)
Fig. 12.Comparison of binarization methods: (a) original image, (b) HCL distance-of-color image, (c) global binarization result of (b), and (d) adaptive binarization result of (b).
(a) (b) (c) (d)
of the neighboring pixels in an (n×n) window:
1 1 , 128 s T = ⋅ + ⋅m ⎧⎨ k ⎛⎜ − ⎞⎟⎫⎬ ⎝ ⎠ ⎩ ⎭ (8)
where m is the mean, and s is the standard deviation of the histogram. The threshold can be varied from the standard deviation by changing k. The local binarization method can handle complex images where there is low contrast between the text and background in terms of the HCL distance. For example, Fig. 12 shows the difference between the two binarization methods on the HCL distance-of-color image. Adaptive binarization shows a better result than its counterpart global binarization; the text region is well separated from the background.
Using the extracted text region and background region, the system estimates the background colors around the text pixels by calculating the mean of the neighboring background pixels. From the estimated background image and the original image, the pixels are finally designated as text pixels if the difference from the background color value is larger than a threshold.
Fig. 13. (a) Original image and (b) binarization result.
(a) (b)
Fig. 14. Example of noise components.
Figure 13 shows an example of the binarization result.
The binarization method may generate not only text components but also some noise in the text region (Fig. 14). That is mainly because it extracts components in a wide range of regions covering the user’s line. Thus, Touch TT needs to prune the connected components (CC) based on the properties of text components. ( ) ( ) , ( ) Height CC AspectRatio CC Width CC = 2 ( ) ( ) , ( ( )) Area CC OccupancyRatio CC Area BoundingBox CC = ( ( )) ( ) , ( ( )) Deviation StrokeThickness CC StrokeThicknessVar CC Mean StokeThickness CC = 2 ( ) ( ) . ( ( )) Area CC Compactness CC Length Contour CC =
When the characteristics of a connected component are far from the normal properties of the text component, Touch TT regards the connected component as noise and removes it. For instance, using an aspect ratio rule, long bar-shaped noise components are removed. Based on the fact that the noise components are often more complex than the text components, the occupancy ratio and compactness of components are used to filter out complexly shaped noise components. In addition, text characters are composed of strokes, and the strokes usually have uniform thickness. This characteristic of text components is also used to remove noise components.
V. Verification of Text Candidate Components
The extracted components are determined to be text or non-
Fig. 15. Text verification and text expansion.
text regions in the verification step (Fig. 15). Since characters have common shape characteristics, such as aspect ratio and constant stroke thickness which are distinctive from those of background regions, the geometric shape of a single component is considered for the verification measurement. In addition, characters within a touchline of text usually have a similar font and color, so spatial relationships among the neighboring components are also important factors to determine the identity of these components. Heuristic rules based on the characteristic of text regions are used to filter out the background components. In addition, Touch TT expands the text region to deal with partially drawn lines or severe color gradation so that the binarized text region is successfully obtained in a post-processing step. As result, the OCR module can recognize the text “London” from the binarization result.
When the component extraction process for each text color candidate has finished, Touch TT decides which components are a true text string. Five heuristic conditions on the shape and size of the characters are used to determine the text string from text component candidates by checking the global consistency of the text string. In most images, text characters do not appear alone, but together with other characters. Characters are subjected to certain geometric restrictions, that is, their height, width, and compactness usually fall into specific ranges of values. The system compares all text candidates which are obtained from each seed color and then selects the final text region which maximally satisfies the following list of requirements. For instance, the system gives higher confidence scores to components when the components have strong average edge intensity on the component boundary compared to the average edge intensity in the component pixels.
System requirements: i) Number of components ≥ 2.
ii) Minimum variation of the distances between components. iii) Minimum variation in the heights of components. iv) Minimum variation in the compactness of components. v) Strong edge intensity on the component boundary
Fig. 16. Text verification.
Fig. 17. Text region expansion and result.
compared to the edge intensity in the component.
Touch TT also applies other heuristic rules to check all components of text strings aligned along the selected text line. When text components are aligned along the user selected line, the variation of distance between the components and the line is small. In addition, pixels in the text area are distributed similarly in the subregions around the line. Subregions are defined as the four (upper/lower and left/right) regions around the line drawn by the user. The components of the top left in Fig. 16 are rejected due to the compactness condition (compactness is the ratio between the area of the component region and the contour length of the component), and the components of the bottom left are removed because of the alignment condition.
After obtaining true text regions from the verification process, Touch TT scans the areas surrounding the text regions to search for undetected text regions in the post-processing step. Since users sometimes draw a line only partially, searching the areas of the original image neighboring the discovered text regions is necessary to locate any missed characters (Fig. 17). In the majority of cases, a text string is aligned along the user selected line in the image, and therefore neighboring text regions can usually be found within a certain distance. By limiting the post-processing search area to within a certain distance or direction of discovered text, such as searching only to the left and right in the case of a horizontal text line, low computational time can be maintained. To handle the color gradation problem, the seed color is chosen from the average color value of the left-most character when searching neighboring areas to the left of discovered text (and vice versa for the right direction). In the search region, Touch TT conducts the same component extraction process, an adaptive binarization using the updated text color. The text color is continually updated by averaging the color of the most recently discovered neighboring text
component. By exploiting the fact that neighboring characters have similar colors, neighboring text regions are well extracted through the iterative region growing methods. Searching for neighbor components ends when there are no more text components or when a newly discovered component does not satisfy the characteristics of a character. After the text region expansion, Touch TT obtains the final text extraction result. This binarization result is used as an input for the OCR module.
VI. Experimental Results
For evaluating the performance of the proposed methods, 2,385 images from various environments (signboards, book covers, and English and Korean characters) were collected. We manually segmented 373 realistic images to extract the ground truth text regions. In other words, the ground truth images contain the text components with the white color and background region (the rest of the image) with the black color. Those images include non-uniform illumination, complex background, and high variation on shape, size, and color of text. We will refer to these collected images as the KAIST scene text database. The KAIST scene text database is currently available at http://ai.kaist.ac.kr/home/DB/SceneText (xml tag files that contain text information and the ground truth images are included). We also used the dataset of the ICDAR 2003 Robust Reading Competition [18] for comparison with the previous system (we manually segmented 317 images for the ground truth images).
To evaluate the performance of text extraction, we used a similar evaluation method to that of the ICDAR 2003 competition. It is based on the notions of precision and recall, which are calculated in terms of the number of pixels [6]. Let E be the set of pixels which are estimated as text components by the system, T be the set of pixels on the text components of the ground truth image, and let C be E∩T. Precision p and recall r are defined as p = |C| / |E| and r = |C| / |T|.
Table 1 shows a comparison among the performance of the Baseline system, which does not use any interactive locations, our previous system, which uses Focus, and the presently proposed work, which uses Touchline. The Baseline method which extracts the text regions without a user’s hint conducted the same approach to the entire image; five dominant colors are estimated from the entire images as the text color candidates. Color distance maps are generated for each color seed. Then, they are binarized to obtain the text components. Some heuristics are also used to remove the non-text components. We computed the average precision and recall over all the images in the dataset. It is shown that the extraction method using user interface achieved a high precision rate for the test images. Since the method applying the user-indicated text line
Table 1. Text extraction performance for both datasets (precision/ recall).
Database Baseline Focus Touchline
KAIST 0.55/0.54 0.68/0.74 0.85/0.90
ICDAR 2003 0.55/0.53 0.61/0.71 0.81/0.85
Table 2. Processing time for the previous method using Focus and the proposed method (s).
Focus Touchline
Image 11.66 4.95
Text region 5.76 2.44
can utilize more information, it shows a higher precision and recall rate than applying the focus.
The Baseline method had difficulty handling characters of multiple colors or removing the non-text components, while the extraction methods Focus and Touchline show better performance. Since the Baseline method has no information on the text colors and location, when the portion of the text region in the images is relatively small, color clustering on the color distribution could yield inadequate segmentation result. On the other hand, the Focus method extracts text components more precisely using the fact that they are aligned horizontally along the focus. When scene images contain text regions which are diagonally or vertically aligned, the Focus method cannot extract those text components properly because of the horizontal text line assumption. The best performance was achieved by the proposed method since it can utilize more information such as text alignment and colors of text from the user’s touchline.
In Table 2, the processing times for Focus and Touchline are compared. In terms of computational complexity, the proposed method outperforms our previous method. This result shows that the proposed method has more effectively utilized the user’s hint than our previous method had.
Figure 18 compares the text extraction results which are obtained using three extraction methods. We observed that our proposed system could segment images as accurately as possible with as little user intervention as possible. With respect to the previous work, where the user has only to indicate one or more single focus area, in the proposed method, the user provides more information by drawing one or more lines over the text, which improved the quality of the extraction.
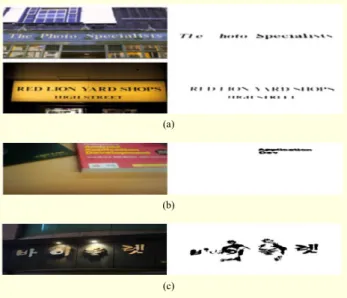
Figure 19 shows several examples of the text extraction results by the proposed method. In almost every case, the text areas are detected well as shown in the final binary images.
Fig. 18. Scene text extraction results (a) Baseline, (b) Focus, and (c) Touchline.
(a) (b) (c)
Fig. 19. Scene text separation results.
Non-text areas are also eliminated effectively. The proposed method worked successfully even in the case with non-uniform text color. In addition, it can handle multiple lines without any difficulties. From the experimental result, we may conclude that it can improve the extraction performance using natural user interface.
Fig. 20. Scene text extraction results on special cases.
Fig. 21. Erroneous cases due to (a) variation of stroke width, (b) relatively small text region, and (c) strong reflection.
(a)
(b)
(c)
for multilingual text. Our proposed method is mainly designed to separate English words, but these results show that it is possible to expand the algorithm to handle other languages. As shown in Fig. 20, some special cases where characters are arranged diagonally or even vertically are successfully processed by the proposed method using the text-line information. These images cause difficulties for the previous method using the focus since it assumes that the text components are aligned horizontally.
Some separation errors occurred with a few scene images
(Fig. 21). First, a variation of stroke width due to the specific font can cause an extraction error so that some character components were not clearly extracted (Fig. 21(a)). Second, when only a small region in an image is the text region compared to the size of the whole image, the text region would have an insufficient resolution to extract precise text components (Fig. 21(b)). Third, the proposed method cannot handle strong reflection effects, so that a lot of parts of characters in the reflection area are missed (Fig. 21(c)). In addition, we found that the adaptive binarization with the HCL distance measure is sensitive to a little difference between the text and background on the hue axis. An excessive color change in the same component also caused error. However, the total results showed that the target text regions are extracted well from even a complex background in most cases.
VII. Conclusion
We have proposed a text extraction algorithm called Touch TT that utilizes text location information provided through a touchscreen. Touch TT uses lines drawn by the user to target text components for automatic extraction. Touch TT first chooses text color candidates and binarizes the images based on the text color candidates. Then, it verifies the true text candidate and expands the text region to find any missed characters. Our proposed method was tested on the dataset from the ICDAR 2003 competitions and the KAIST scene text database. Our research indicates that our proposed method is applicable and useful in the mobile environment.
Our main contribution is that, in our method, the text region is robustly separated from natural scene images using a touchscreen interface which is intuitive for users. The processing of scene text is a challenging problem in mobile devices because of severe computational limitations. However, hints given by users can play a pivotal role in acquiring text information from images in mobile devices. By allowing the indication of the text through a user-targeted line interface, the proposed method resolves the difficulties of text extraction from natural scene images that have been caused by uneven illumination, complex backgrounds, and the existence of text-like objects within such images. We have confirmed the feasibility of our method for hand-held camera applications.
References
[1] N. Ezaki, M. Bulacu, and L. Schomaker, “Text Detection from Natural Scene Images: Towards a System for Visually Impaired Persons,” Proc. ICPR, 2004, pp. 683-686.
[2] L. Xu et al., “Automatic Text Discovering through Stroke-Based Segmentation and Text String Combination,” Proc. 16th ACM Int.
Conf. Multimedia, 2008, pp. 805-808.
[3] D. Doermann, J. Liang, and H. Li, “Progress in Camera-Based Document Image Analysis,” Proc. Seventh Int. Conf. Document
Anal. Recog., 2003, pp. 606-616.
[4] C. Mancas-Thilloul, Natural Scene Text Understanding, doctoral dissertation, Presses Universitaires de Louvain.
[5] B. Gatos et al., “Text Detection in Indoor/Outdoor Scene Images,”
Proc. 1st Workshop Camera-Based Document Anal. Recog.,
2005, pp. 127-132.
[6] K. Kim et al., “Scene Text Extraction in Natural Scene Images Using Hierarchical Feature Combining and Verification,” Proc.
17th Int. Conf. Patt. Recog., vol. 2, 2004, pp. 679-682.
[7] J. Park, H. Yoon, and G. Lee, “Automatic Segmentation of Natural Scene Images Based on Chromatic and Achromatic Components,” Lecture Notes Computer Sci., vol. 4418, 2007, pp. 482-493.
[8] Y. Li et al., “Lazy Snapping,” Int. Conf. Graphics Interactive
Techniques, 2004, pp. 303-308.
[9] C. Rother, V. Kolmogorov, and A. Blake, “GrabCut: Interactive Foreground Extraction Using Iterated Graph Cuts,” ACM Trans.
Graphics, vol. 23, no. 3, 2004, pp. 309-314.
[10] E. Kim, S. Lee, and J.H. Kim, “Scene Text Extraction using Focus of Mobile Camera,” Proc. 10th Int. Conf. Document Anal. Recog., 2009, p. 166-170.
[11] N. Nikolaou and N. Papamarkos, “Color Segmentation of Complex Document Images,” VISAPP, 2006, pp. 251-263. [12] W.K. Pratt, Digital Image Processing, New York, NY: Wiley,
1978.
[13] J. MacQueen, “Some Methods for Classification and Analysis of Multivariate Observations,” Proc. Fifth Berkeley Symp.
Mathematical Statistics Probability, 1967, pp. 281-297.
[14] D. Comaniciu and P. Meer, “Mean Shift: A Robust Approach Toward Feature Space Analysis.” IEEE Trans. Patt. Anal. Mach.
Intell., vol. 24, no. 5, 2002, pp. 603-619.
[15] M. Sarifuddin and R. Missaoui, “A New Perceptually Uniform Color Space with Associated Color Similarity Measure for Content-Based Image and Video Retrieval,” Proc. ACM SIGIR
Workshop on Multimedia Inf. Retrieval, 2005, pp. 1-8.
[16] N. Otsu, “A Threshold Selection Method from Gray-level Histograms,” IEEE Trans. Syst., Man, Cybern., vol. 9, no. 1, 1979, pp. 62-66.
[17] J. Sauvola and M. Peitikainen, “Adaptive Document Image Binarization,” Patt. Recog., vol. 33, no. 2, 2000, pp. 225-236. [18] S. Lucas et al., “ICDAR 2003 Robust Reading Competitions,”
Proc. ICDAR, 2003, pp. 682-687.
Jehyun Jung received his BS in computer science from Yonsei University, Seoul, Korea, in 2008, and MS in computer science from Korea Advanced Institute of Science and Technology (KAIST), Daejeon, Korea, in 2010. His research interests include text recognition, computer vision, and machine learning. SeongHun Lee received his BS in computer science from Pusan National University, Busan, Korea, in 2004, and MS in computer science from Korea Advanced Institute of Science and Technology (KAIST), Daejeon, Korea, in 2006. He is currently a PhD candidate in computer science at KAIST. His major research interests are pattern recognition, artificial intelligence, image processing, and text recognition.
Min Su Cho received his BS in computer science from Hanyang University, Ansan, Korea, in 2009, and is currently an MS candidate in computer science at Korea Advanced Institute of Science and Technology (KAIST). His research interests include pattern recognition, machine learning, computer vision, and text recognition.
Jin Hyung Kim received the BS in engineering from Seoul National University, Korea, in 1971, and the MS and PhD in computer science from University of California, Los Angeles, in 1979 and 1983, respectively. He was a research engineer at Korea Institute of Science and Technology from 1973 to 1976. He was a senior staff member in computer science at Hughes Research Laboratories, Malibu, California, from 1981 to 1985. He joined the faculty of Korea Advanced Institute of Science and Technology (KAIST), in 1985. In 1990, he founded the Center for AI Research and later served as a chief director. He was a visiting scientist at IBM Watson Research Center and Samsung SDS. He is a member of both the National Academy of Engineering of Korea and the Korean Academy of Science and Technology. He was elected Fellow of the International Association of Pattern Recognition in 2000. He has published more than 200 papers including about 60 international journal papers in the area of artificial intelligence and pattern recognition. His research is now focused on handwriting recognition and scene text recognition.