©The Japan Endocrine Society
Original
High circulating follistatin-like protein 1 as a biomarker of
a metabolically unhealthy state
Sun-Young Lee1) *, Deog-Yoon Kim2) *, Mi Kyung Kwak3), Seong Hee Ahn4), Hyeonmok Kim5), Beom‑Jun Kim3), Jung-Min Koh3), Yumie Rhee6), Chong Hwa Kim7), Ki Hyun Baek8), Yong-Ki Min9), Seung Hun Lee3) † and Moo-Il Kang10) †
1) Asan Institute for Life Sciences, Seoul 05505, Korea
2) Department of Nuclear Medicine, Kyung Hee University School of Medicine, Seoul 02447, Korea
3) Division of Endocrinology and Metabolism, Asan Medical Center, University of Ulsan College of Medicine, Songpa, Seoul 05505, Korea 4) Department of Endocrinology, Inha University School of Medicine, Incheon 22332, Korea
5) Division of Endocrinology and Metabolism, Department of Internal Medicine, Seoul Medical Center, Seoul 02053, Korea
6) Department of Internal Medicine, Severance Hospital, Endocrine Research Institute, Yonsei University College of Medicine, Seoul 03722, Korea 7) Department of Internal Medicine, Sejong General Hospital, Bucheon 14754, Korea
8) Division of Endocrinology and Metabolism, Department of Internal Medicine, Yeouido St. Mary’s Hospital, The Catholic University of Korea College
of Medicine, Seoul 07345, Korea
9) Division of Endocrinology and Metabolism, Department of Internal Medicine, Sungkyunkwan University School of Medicine, Seoul 06351, Korea 10) Division of Endocrinology and Metabolism, Department of Internal Medicine, Seoul St. Mary’s Hospital, The Catholic University of Korea College
of Medicine, Seoul 06591, Korea
Abstract. The inflammatory biomarkers that fully characterize the metabolically unhealthy (MU) state—which is a risk factor for cardiovascular disease (CVD)—remain unclear. Recent studies suggest follistatin-like protein 1 (FSTL1) could be used as a biomarker for inflammation and CVD, however there is little information on FSTL1 levels in the MU state. We aimed to evaluate the associations between FSTL1, the presence of MU state and subclinical coronary atherosclerosis. In a cross-sectional study, we evaluated FSTL1 levels and their relationship with the presence of MU state and coronary artery plaques in 230 Korean patients. Significant increase in FSTL1 levels was observed in subjects with MU state (p = 0.020), but not those with obesity state according to body mass index criteria (p = 0.790). After adjusting for confounders, the odd ratio (OR) for the MU state among patients in the highest FSTL1 tertile (T3) was higher in comparison with the lowest tertile (T1) (OR = 3.60, 95% confidence interval [95% CI] = 1.20–10.83). In a subgroup (n = 66), FSTL1 levels were also marginally higher in patients with plaques (p = 0.098). The OR for plaque presence in patients with T3 was significantly higher in comparison with T1 after adjusting for confounders (OR = 12.51, 95% CI = 1.15–135.73). Plasma FSTL1 may be a useful biomarker for the risk of MU state and CVD.
Key words: Follistatin-like protein 1, Metabolic unhealth, Subclinical atherosclerosis
Submitted Sep. 17, 2018; Accepted Dec. 27, 2018 as EJ18-0352 Released online in J-STAGE as advance publication Feb. 8, 2019 Correspondence to: Seung Hun Lee, MD, PhD, Division of Endo‐ crinology and Metabolism, Asan Medical Center, University of Ulsan College of Medicine, 88 Olympic-ro 43 Gil, Songpa-Gu, Seoul 05505, Republic of Korea.
E-mail: [email protected]
Correspondence to: Moo-Il Kang, MD, PhD, Department of Endo‐ crinology and Metabolism, Seoul St. Mary's Hospital, The Catholic University of Korea College of Medicine, 222 Banpo-daero, Seocho-gu, Seoul 06591, Korea.
E-mail: [email protected]
*These authors contributed equally to this work as first authors.
† These authors contributed equally to this work as corresponding
authors.
Abbreviations; AMC, Asan Medical Center; BMI, body mass index; BP, blood pressure; CHF, chronic heart failure; 95% CI, 95% confidence interval; CT, computed tomography; CV, coeffi‐ cients of variations; CVD, cardiovascular disease; DBP, diastolic
METABOLIC SYNDROME (MetS) is associated with
an elevated risk of cardiovascular disease (CVD), as well
blood pressure; ELISA, enzyme-linked immunosorbent assay; FPF, fasting plasma glucose; FSTL1, follistatin-like protein 1; HbA1c, glycated hemoglobin; HDL-C, high-density lipoprotein-cholesterol; hsCRP, high-sensitivity C-reactive protein; HTN, hypertension; LDL-C, low-density lipoprotein-cholesterol; MAP, mean arterial pressure; MetS, Metabolic syndrome; MH, metabol‐ ically healthy; MHNO, metabolically healthy nonobese; MHO, metabolically healthy obesity; MU, metabolically unhealthy; MUNO, metabolically unhealthy nonobesity; MUO, metabolically unhealthy obesity; NCEP ATP III, National Cholesterol Education Program Adult Treatment Panel III; NLPR3, NLR family pyrin domain containing-3; OR, odds ratio; RR, relative risk; SBP, sys‐ tolic blood pressure; SD, standard deviation; T, tertile; T1, the low‐ est tertile; T-CHOL, total cholesterol; T2DM, type 2 diabetes mellitus; T3, the highest tertile; TG, triglycerides; VAT, visceral adipose tissue; WC, waist circumference
as other diseases such as type 2 diabetes mellitus (T2DM), fatty liver, and all-cause mortality [1-4]. The clinical criteria for MetS include visceral adiposity, glu‐ cose intolerance, dyslipidemia, and hypertension (HTN). Although obesity is a fundamental component of MetS [5], unique subgroups may exist, e.g., metabolically healthy obesity (MHO) and metabolically unhealthy non‐ obesity (MUNO) [6-8]. A recent meta-analysis revealed that all metabolically unhealthy (MU) patients, including those with MUNO and metabolically unhealthy obesity (MUO), demonstrate a similar elevated risk in compari‐ son with metabolically healthy nonobese (MHNO) indi‐ viduals. Interestingly, this finding was noted regardless of weight: normal weight (relative risk [RR] = 3.14, 95% confidence interval [CI] = 2.36–3.93), overweight (RR = 2.70, 95% CI = 2.08–3.30), and obese (RR = 2.65, 95% CI = 2.18–3.12). Thus, MU status may be clinically more important than obesity itself [9].
Low-grade inflammation has been proposed as a key factor that determines MU status [10]. Several studies have reported a more adverse inflammatory status in MUO patients than MHO patients [11, 12], although inconsistent results have been also reported [13, 14]. Therefore, additional research on inflammatory bio‐ markers is needed to discriminate MU status, perform personalized risk assessments, and determine the most appropriate strategies.
Follistatin-like protein 1 (FSTL1) contains 308 amino acids and is an extracellular glycoprotein that is mainly produced by cells with a mesenchymal origin [15]. Recent studies have suggested that FSTL1 could be a biomarker of inflammation [15, 16] and CVD [17-19]. These findings suggest that FSTL1 can serve as an inflammatory biomarker for differentiating metabolically healthy (MH) and MU state in order to predict CVD risk. However, there is little information on circulating FSTL1 levels in the MU state. Here, our aim is to evaluate plasma FSTL1 levels and the relationship with the pres‐ ence of MU state.
Methods
Study population
This study was retrospectively performed. All study patients were >20 years old and visited the endocrinol‐ ogy clinic at Asan Medical Center (AMC; Seoul, Korea) between January 2011 and June 2012 after a routine examination at the health promotion center of AMC. We also excluded patients with fever (oral temperature ≥38.0°C), abnormal leukocyte (<4.0 or >10.0 × 10⁹/L) or
platelet counts (<150 or >350 × 109/L) on their complete
blood counts, or abnormal liver, kidney, or thyroid func‐ tion. Patients with >10 mg/L hsCRP were omitted to
exclude occult infection or other systemic inflammatory processes [20]. Patients with chronic inflammatory dis‐ eases and autoimmune diseases were also excluded. His‐ tory of CVD was based on each patient’s history of angina, myocardial infarction, and/or cerebrovascular accidents. DM was defined as fasting plasma glucose (FPG) ≥7.0 mmol/L, or glycated hemoglobin (HbA1c) ≥6.5% [21]. In addition, patients who reported the use of antidiabetic medications on a self-reported questionnaire were considered to have DM [22]. HTN was defined using a self-reported history of antihypertensive medica‐ tion or blood pressure (BP) ≥140/90mm Hg.
All patients provided written informed consent. This study was approved by the institutional review board of AMC. All patients completed a questionnaire on their previous medical and/or surgical diseases, medications, and drinking and smoking habits. Drinking habits were categorized in terms of frequency per week (i.e., ≤1 time/ week or ≥2 times/week [i.e., moderate drinker]); smok‐ ing habits as noncurrent or current; and exercise habits in terms of frequency per week (i.e., ≤2 times/week or ≥3 times/week [i.e., physically active]).
Definitions of MU states and obesity states
To define the metabolically healthy state, we measured the five components of MetS according to the 2005 revised criteria of the National Cholesterol Education Program (NCEP) Adult Treatment Panel III (ATP III) [23]: abdominal obesity (waist circumference [WC] ≥80 cm in women or ≥90 cm for men); hypertriglyceridemia (high TG) ≥150 mg/dL (1.7 mmol/L); low high-density lipoprotein-cholesterol (HDL-C) (<50 mg/dL [1.3 mmol/L] in women or <40 mg/dL [1.0 mmol/L] in men); high BP (≥130/85 mmHg) or the use of antihypertensive medica‐ tion; or high FPG (≥100 mg/dL [5.6 mmol/L]) or the use of antidiabetic medications (e.g., insulin or oral agents). Abdominal obesity was redefined using an Asian-specific cut-off point, as recommended by the NCEP-ATP III criteria. For definition of MU state, the WC criterion was not used because of its collinearity with BMI. Participants who met ≥2 of the 4 components of MetS except for WC were considered MU. Obesity phe‐ notypes were defined according to the Asia-Pacific body mass index (BMI) criteria (non-obese <25 kg/m2 or
obese ≥25 kg/m2), which were defined by the World
Health Organization Western Pacific Region [24]. Study participants were accordingly categorized into 1 of 4 groups: MHNO, BMI <25 kg/m2 and <2 metabolic risk
factors; MUNO, BMI <25 kg/m2 and ≥2 metabolic risk
factors; MHO, BMI ≥25 kg/m2 and <2 metabolic risk
factors; and MUO, BMI ≥25 kg/m2 and ≥2 metabolic
Clinical and laboratory measurements
Height and weight were obtained while the patient wore light clothing without shoes. BMI was calculated as weight in kilograms divided by the square of the height in meters. The WC (measured in cm) was measured mid‐ way between the costal margin and the iliac crest at the end of normal expiration. BP was measured on the right arm after resting for ≥5 minutes using an automatic ma‐ nometer with an appropriate cuff size. Mean arterial pressure (MAP) was calculated as MAP = (2 × diastolic BP + systolic BP)/3. After overnight fasting, early-morning blood samples were drawn from the antecubital vein into vacuum tubes and subsequently analyzed by the central, certified laboratory at AMC.
Fasting total cholesterol, HDL-C, low-density lipopro‐ tein cholesterol (LDL-C), and triglycerides (TG) were measured using the enzymatic colorimetric method on a Toshiba 200 FR Neo autoanalyzer (Toshiba Medical System Co., Ltd., Tokyo, Japan). FPG was measured using the enzymatic colorimetric method using a Toshiba 200 FR autoanalyzer (Toshiba). Ion-exchange high-performance liquid chromatography (Bio-Rad Laborato‐ ries, Inc., Hercules, CA) was used to measure HbA1c levels. The intra- and inter-assay coefficients of varia‐ tions (CVs) of these analyses were consistently <3.5%. All enzyme activities were measured at 37°C.
Fat mass was measured using a direct segmental multi-frequency bioelectrical impedance analysis (BIA) (In-Body720; Biospace Co., Ltd, Seoul, Korea) in the morning after an overnight fast per the manufacturer’s instructions.
Coronary multi-detector computed tomography for assessing coronary artery plaques
MDCT examinations were performed using a VCT XT 64-slice MDCT scanner (GE Healthcare, Milwaukee, WI). Patients with a heart rate >70 beats/minute were given a beta-blocking agent before MDCT. A standard scanning protocol was used according to patient’s body habitus, as follows: 64 × 0.624-mm slice collimation; 350-ms rotation time; 100–120 kVp tube voltage; and 500–800 mA tube current. All scans were performed using electrocardiogram-gated dose modulation. A bolus of 80 mL iomeprol (Iomeron 400; Bracco, Milan, Italy) was intravenously injected (4 mL/seconds), followed by flushing with 50 mL saline. A region of interest was defined on the ascending thoracic aorta, and bolus track‐ ing and image acquisition was automatically initiated after the selected threshold (120 Hounsfield units [HU]) was reached. Each patient ’ s electrocardiogram was simultaneously recorded to allow for retrospective seg‐ mental data reconstruction. Images were initially recon‐ structed at the mid-diastolic or end-systolic phase of the
cardiac cycle. The average radiation dose for MDCT was 4.7 ± 1.6 mSv.
All data were evaluated on a remote workstation (Advantage Workstation; GE Healthcare). Each lesion was identified using the multiplanar reconstruction tech‐ nique and the maximal intensity projection of the short-axis, 2-chamber, and 4-chamber views. Plaques were defined as structures >1 mm2 within and/or adjacent to
the vessel lumen. Plaques consisting of calcified tissue occupying >50% of the plaque area (density >130 HU on native scans) were classified as calcified (calcified plaque; CAP), plaques with <50% calcium were classi‐ fied as mixed (mixed plaque; MCAP), and plaques with‐ out any calcium were classified as noncalcified lesions (noncalcified plaque; NCAP) [25].
Measuring plasma FSTL1 concentration
Fasting venous blood samples were obtained. After centrifuging, we carefully collected their supernatants without any cellular components, and all samples show‐ ing hemolysis or clotting were discarded. All plasma samples were stored at –80°C prior to assaying the FSTL1 levels. FSTL1 levels were assayed using a FSTL1 competitive, enzyme-linked immunosorbent assay (ELISA) kit (USCN Life Science, Cologne, Germany) according to the manufacturer’s instructions. The lower limit of detection was 0.43 ng/mL, and the intra- and interassay CVs were 10% and 12%, respectively. Duplicate samples were assayed, and all results are reported as the mean values.
Statistical analysis
Continuous variables with normal distributions are expressed as the mean ± standard deviation (SD), and categorical variables are expressed as proportions (%). The FSTL1 levels with skewed distributions were log-transformed. One-way ANOVA was used to compare lin‐ ear trends in the FSTL1 levels between the 4 groups of patients classified by their metabolic health and obesity states and between the 3 groups of patients that were subdivided based on the number of MetS components. The demographic and biochemical characteristics of the study population were compared using one-way ANOVA for continuous variables (with Scheffe’s method as the
post-hoc analysis) or the chi-square test for categorical
variables (with the Kruskal-Wallis test with the Dunn procedure as the post-hoc analysis). The distribution of FSTL1 levels and their associations with 4 components of MU state according to MU and obesity status were investigated through simple scatter plot. Serum FSTL1 levels according to the obesity or MU state were compared using Mann–Whitney U-test by median [interquartile range (IQR)]. The associations of FSTl1 levels with the
numbers of components of MU status, BMI, or fat mass were investigated through Spearman’s test after adjust‐ ment for age and sex. Logistic regression analysis was used to assess the association between FSTL1 levels (continuous variable), the tertile (T) group for FSTL1 level (categorical variable), and the presence of obesity, MU state, and plaques in coronary artery before and after adjusting for confounding variables. To assess the associ‐ ation of T group for FSTL1 levels with the presence of plaques in coronary artery after adjusting for the obesity or MU state, we performed the logistic regression analy‐ sis. Furthermore, we performed interaction analysis to assess whether associations between tertile groups of FSTL1 levels (expressed as a categorical variable) and presence of plaques in the coronary artery were modified by obesity or MU state (expressed as a categorical varia‐ ble). All statistical analyses were performed using SPSS for Windows (version 18.0; SPSS, Chicago, IL). Here, p < 0.05 is considered statistically significant.
Results
Association between plasma FSTL1 levels, metabolic health, and obesity
We divided the study patients into 4 groups according to their metabolic health and obesity states (Table 1). Overall, 9.1% (21 of 230) of patients were MUO. Of the obese patients, 55.3% (21 of 38) were MU. MUNO group had higher risk profiles than MHNO group (higher SBP, DBP, MAP, FPG, HbA1c, and TG levels, higher HTN prevalence, and lower HDL-C). MUO group had higher risk profiles than MHO group (higher SBP, DBP, and MAP levels, higher HTN prevalence, and lower HDL-C). MUO group also had higher SBP and HTN prevalence than MUNO group. There were similar risk profiles between MHO and MHNO groups (SBP, DBP, MAP, FPG, HbA1c, TG, and HDL-C). In general, MU groups (i.e., MUO and MUNO) had higher risk profiles than MH groups (i.e., MHO and MHNO).
Serum FSTL1 levels were significantly higher in sub‐ jects with a MU state than in those without a MU state (median [IQR]: 8.9 [6.7; 15.8] vs. 7.7 [5.0; 12.9], p = 0.020). However, there was no significant difference in serum FSTL1 levels between subjects with obesity and those without obesity according to BMI criteria (median [IQR]: 7.9 [5.9; 14.6] vs. 8.0 [5.3; 14.1], p = 0.790). Serum FSTL1 levels were positively correlated with numbers of components of MU state (γ = 0.154, p = 0.031) and fat mass (γ = 0.143, p = 0.045), but not with BMI (γ = 0.065, p = 0.362), after adjustment for age and sex (data not shown).
MUNO groups (median [IQR]: 10.5 [7.7; 13.2] ng/dL,
p = 0.066) had marginally and MUO groups (median
[IQR]: 11.8 [9.4; 18.6] ng/dL; p = 0.049) had signifi‐ cantly higher FSTL1 levels than MHNO groups (median [IQR]: 7.0 [5.0; 8.3] ng/dL) (Table 1, Fig. 1). Both MUNO (p = 0.085) and MUO (p = 0.051) groups had marginally higher FSTL1 levels than MHO groups (median [IQR]: 8.5 [5.3; 9.3] ng/dL). There was no sig‐ nificant difference in FSTL1 concentrations between MHNO and MHO groups (p = 0.477) or MUNO and MUO patients (p = 0.550). Subjects with high TG (median [IQR]: 9.5 [7.0; 11.8]), low HDL-C (median [IQR]: 10.3 [7.7; 14.3]), high BP or the use of antihyper‐ tensive medication (median [IQR]: 9.5 [7.8; 13.2]), and high FPG or use of antidiabetic medication (median [IQR]: 8.4 [6.5; 11.5]) had significantly higher FSTL1 levels than those without (7.8 [5.5; 9.2], p = 0.002; 7.8 [6.0; 9.4], p = 0.001; 7.4 [5.3; 9.0], p = 0.002; and 7.7 [5.8; 9.4], p = 0.003 respectively) (Fig. 1).
When we divided the patients according to MetS and explored them, the mean FSTL1 levels were significantly higher in the patients with MetS than patients without MetS (11.7 [8.9; 15.1] vs. 7.7 [5.7; 9.2] ng/dL; p = 0.007). And interestingly, FSTL1 levels significantly increased along with an increase in the number of MetS components (7.1 [5.2; 8.2] ng/dL for 0 components, 7.9 [6.2; 9.5] ng/dL for 1–2 components, and 11.7 [8.9; 15.1] ng/dL for ≥3 components; p for trend = 0.020) (data not shown).
We next evaluated the association between FSTL1 and the presence of MU or obesity (Table 2). The T3 of log-transformed FSTL1 levels was more MU than T1 (OR = 2.43, 95% CI = 1.23–4.80 for Model I). After adjusting for confounders, statistical significance was strengthened (OR = 2.30, 95% CI = 1.07–4.91 for Model II; OR = 3.12, 95% CI = 1.07–9.07 for Model III). However, log-transformed FSTL1 levels were not associated with the presence of obesity. Collectively, the high FSTL1 level may be associated with a MU state, but not obesity state according to BMI criteria.
Association between FSTL1 levels and plaques in the coronary artery
The presence of plaques in the coronary artery was evaluated in a subgroup of patients (66 of 230 patients; 28.7%) using CT angiography; thus, we next evaluated the association between FSTL1 levels and the presence of plaques. Table 3 showed the characteristics of the sub‐ group according to the presence or absence of plaque. The FSTL1 levels were marginally higher in the patients with plaques than patients without plaques (7.3 [6.3; 12.0] vs. 5.9 [5.4; 8.0] ng/dL; p = 0.098). The T3 of log-transformed FSTL1 levels had more plaques than T1 (OR = 4.09, 95% CI = 1.02–16.40 for Model I) (Table 4). After adjusting for confounders, statistical significance
was strengthened. After further adjustment for the his‐ tory of CVD, treatment for HTN and DM, and the use of statins and aspirin (Model IV), the T3 of log-transformed FSTL1 levels had more plaques than T1 (OR = 12.51, 95% CI = 1.15–135.73).
Furthermore, we evaluated the association between FSTL1 levels and the presence of plaques after adjusting
for the obesity or MU state. The significant association of the T3 group for FSTL1 levels (OR = 4.09, 95% CI = 1.02–16.46) with the presence of plaques in the coronary artery remained after adjusting for obesity state (OR = 1.32, 95% CI = 0.43–4.02) (data not shown). However, statistically significance in the association of the T3 group for FSTL1 levels with the presence of plaques in
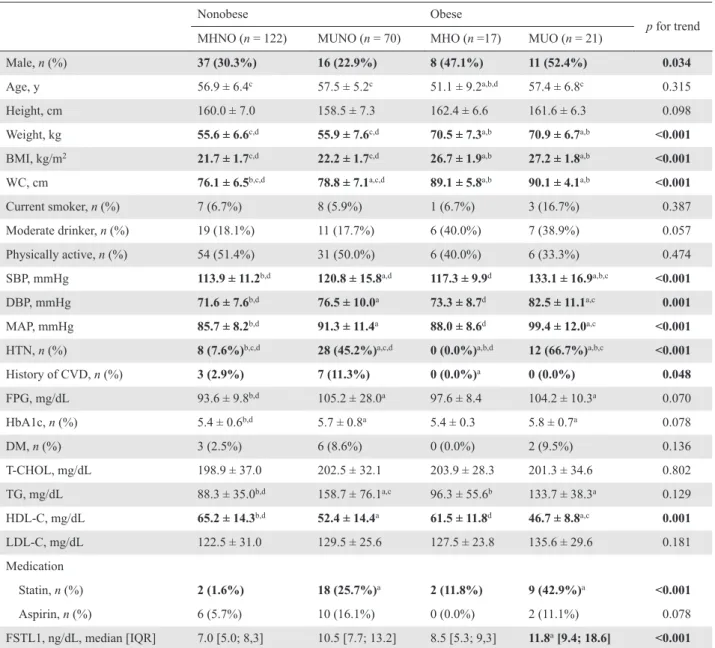
Table 1 Characteristics of the study population according to metabolic heath and obesity
Nonobese Obese
p for trend
MHNO (n = 122) MUNO (n = 70) MHO (n =17) MUO (n = 21)
Male, n (%) 37 (30.3%) 16 (22.9%) 8 (47.1%) 11 (52.4%) 0.034
Age, y 56.9 ± 6.4c 57.5 ± 5.2c 51.1 ± 9.2a,b,d 57.4 ± 6.8c 0.315
Height, cm 160.0 ± 7.0 158.5 ± 7.3 162.4 ± 6.6 161.6 ± 6.3 0.098
Weight, kg 55.6 ± 6.6c,d 55.9 ± 7.6c,d 70.5 ± 7.3a,b 70.9 ± 6.7a,b <0.001
BMI, kg/m2 21.7 ± 1.7c,d 22.2 ± 1.7c,d 26.7 ± 1.9a,b 27.2 ± 1.8a,b <0.001
WC, cm 76.1 ± 6.5b,c,d 78.8 ± 7.1a,c,d 89.1 ± 5.8a,b 90.1 ± 4.1a,b <0.001
Current smoker, n (%) 7 (6.7%) 8 (5.9%) 1 (6.7%) 3 (16.7%) 0.387 Moderate drinker, n (%) 19 (18.1%) 11 (17.7%) 6 (40.0%) 7 (38.9%) 0.057 Physically active, n (%) 54 (51.4%) 31 (50.0%) 6 (40.0%) 6 (33.3%) 0.474 SBP, mmHg 113.9 ± 11.2b,d 120.8 ± 15.8a,d 117.3 ± 9.9d 133.1 ± 16.9a,b,c <0.001 DBP, mmHg 71.6 ± 7.6b,d 76.5 ± 10.0a 73.3 ± 8.7d 82.5 ± 11.1a,c 0.001 MAP, mmHg 85.7 ± 8.2b,d 91.3 ± 11.4a 88.0 ± 8.6d 99.4 ± 12.0a,c <0.001
HTN, n (%) 8 (7.6%)b,c,d 28 (45.2%)a,c,d 0 (0.0%)a,b,d 12 (66.7%)a,b,c <0.001
History of CVD, n (%) 3 (2.9%) 7 (11.3%) 0 (0.0%)a 0 (0.0%) 0.048 FPG, mg/dL 93.6 ± 9.8b,d 105.2 ± 28.0a 97.6 ± 8.4 104.2 ± 10.3a 0.070 HbA1c, n (%) 5.4 ± 0.6b,d 5.7 ± 0.8a 5.4 ± 0.3 5.8 ± 0.7a 0.078 DM, n (%) 3 (2.5%) 6 (8.6%) 0 (0.0%) 2 (9.5%) 0.136 T-CHOL, mg/dL 198.9 ± 37.0 202.5 ± 32.1 203.9 ± 28.3 201.3 ± 34.6 0.802 TG, mg/dL 88.3 ± 35.0b,d 158.7 ± 76.1a,c 96.3 ± 55.6b 133.7 ± 38.3a 0.129 HDL-C, mg/dL 65.2 ± 14.3b,d 52.4 ± 14.4a 61.5 ± 11.8d 46.7 ± 8.8a,c 0.001 LDL-C, mg/dL 122.5 ± 31.0 129.5 ± 25.6 127.5 ± 23.8 135.6 ± 29.6 0.181 Medication Statin, n (%) 2 (1.6%) 18 (25.7%)a 2 (11.8%) 9 (42.9%)a <0.001 Aspirin, n (%) 6 (5.7%) 10 (16.1%) 0 (0.0%) 2 (11.1%) 0.078 FSTL1, ng/dL, median [IQR] 7.0 [5.0; 8,3] 10.5 [7.7; 13.2] 8.5 [5.3; 9,3] 11.8a [9.4; 18.6] <0.001
Data are expressed as the mean ± standard deviation or numbers with percentages, unless indicated otherwise. Significant results (p < 0.05) are in bold.
MHNO, metabolically healthy nonobese; MUNO, metabolically unhealthy nonobese; MHO, metabolically healthy obese; MUO,
metabolically unhealthy obese; BMI, body mass index; WC, waist circumference; SBP, systolic blood pressure; DBP, diastolic blood pressure; MAP, mean arterial pressure; HTN, hypertension; history of CVD, history of cardiovascular disease (angina, myocardial infarction, or stroke); FPG, fasting plasma glucose; HbA1c, glycated hemoglobin; DM, diabetes mellitus; T-CHOL, total cholesterol; TG, triglyceride; HDL-C, high-density lipoprotein cholesterol; LDL-C, low-density lipoprotein cholesterol; FSTL1, follistatin-like protein 1;
IQR, interquartile range.
a p value was statistically significant vs. MHNO according to post-hoc analysis. b p value was statistically significant vs. MUNO according to post-hoc analysis. c p value was statistically significant vs. MHO according to post-hoc analysis. d p value was statistically significant vs. MUO according to post-hoc analysis.
Fig. 1 Distributions of follistatin-like protein 1 (FSTL1) levels and associations of FSTL1 levels with 4 components of metabolically unhealthy (MU) state according to MU and obesity status.
the coronary artery (OR = 2.65, 95% CI = 0.60–11.72) disappeared after adjustment for MU state (OR = 3.80, 95% CI = 1.19–12.12) (data not shown). Therefore, we performed interaction analysis to assess whether associa‐ tions between tertile groups of FSTL1 levels and the presence of plaques in the coronary artery were modified by obesity or MU state. We observed interactions of ter‐ tile groups of FSTL1 levels with MU state (p for tests of interaction = 0.043), but not those with obesity state (p for tests of interaction = 0.852) for the presence of plaques in the coronary artery.
Discussion
The main finding of our present study was that higher circulating FSTL1 levels are associated with the MU state and coronary artery plaques, but not with the obe‐ sity according to BMI criteria. In addition, FSTL1 levels were significantly increased in subjects with MU state, but not in those with obesity. To the best of our knowl‐ edge, our current study is the first to assess the associa‐ tion between circulating FSTL1 levels, MU state, and subclinical coronary atherosclerosis.
Obesity-associated inflammation and insulin resist‐ ance are characterized by a low-grade but chronic inflammatory state [10]. ATP III recognizes a pro-inflammatory state as an important MetS characteristic, and accumulating evidence identifies inflammation as a potential mechanism that links adipose tissue expansion and cardiometabolic risk [26]. Several studies have also investigated differences in inflammatory markers between MHO and MUO adults [11-14]. Some of these studies report adverse inflammatory profiles in MUO patients [11, 12]. In contrast, other studies report comparable adverse inflammatory profiles between MHO and MUO patients [13, 14]. Therefore, more precise inflammatory biomarkers are needed to fully characterize MU status. In the present study, FSTL1 level showed the positive associations with fat mass suggesting adipose tissue expansion and with the numbers of compartments of MU or MetS suggesting cardiometabolic risk. Subjects with MU state, but not those with obesity state had higher FSTL1 levels. Subjects with compartment of MU charac‐ teristic had higher FSTL1 levels than those without MU characteristic. Furthermore, MUO groups had higher FSTL1 levels than MHO groups despite the marginal significance. These results suggested that circulating FSTL1 might be another biomarker to characterize MU status.
FSTL1 is a secreted glycoprotein that is mainly pro‐ duced by cells of mesenchymal lineage, including car‐ diomyocytes, osteocytes, adipocytes, chondrocytes, and fibroblasts [15]. Recent studies suggest that FSTL1 could
be a biomarker of inflammation and CVD [15]. FSTL1 appears to be an important endogenous mediator of inflammation and is involved in many chronic inflamma‐ tory diseases, such as rheumatoid arthritis, ulcerative colitis, and systemic lupus erythematosus [27]. FSTL1 may also provide a link between adipocytes and macro‐ phages in the adipose tissue and mediate chronic low-grade inflammation and insulin resistance in obesity [28]. FSTL1 is elevated in various inflammatory condi‐ tions and decreases during treatment. FSTL1 may there‐ fore be a valuable biomarker of such diseases [15]. FSTL1 levels also increase in acute coronary syndrome [18] and chronic heart failure (CHF) [17]. FSTL1 levels are associated with left ventricular (LV) hypertrophy, which is a measure of LV remodeling and an indepen‐ dent predictor of incident CHF unrelated to prevalent or incident myocardial infarction [17]. Based on these find‐ ings, we hypothesized that circulating FSTL1 might be an inflammatory biomarker or underdiagnosed mediator of cardiometabolic risk in the MU state. In support of our hypothesis, patients in the MU groups (i.e., MUO and MUNO) in our current study demonstrated higher FSTL1 levels than patients in the MH group (i.e., MHO and MHNO). Furthermore, higher FSTL1 levels were also associated with subclinical coronary atherosclerosis, independent of conventional CVD risk factors including components of MetS. There were positive correlations of serum FSTL1 levels with numbers of components of MU, but not with BMI and statistically significant interactions
of tertile groups of FSTL1 with MU state, but not with obesity state for presence of plaques in the coronary artery. Our findings thus suggest that FSTL1 could be used as a biomarker for differentiating the MH and MU states to predict cardiometbolic risk. From the viewpoint of clinical practice, the measuring FSTL1 in the subjects with MU state might result in improvement in cardiometbolic risk discrimination.
It remains unclear whether FSTL1 simply reflects the underlying MU state or is an underdiagnosed mediator of increasing metabolic risk. One earlier study has reported that the MUO phenotype seems to be associated with the increased activation of the NLR family pyrin domain containing-3 (NLPR3) inflammasome in macrophages infiltrating the visceral adipose tissue (VAT), which is more frequently associated with metabolic dysfunction than subcutaneous adipose tissue and more adverse inflammatory profiles such as caspase-1 activity and interleukin-1β (IL-1β) levels in comparison with the MHO phenotype [10]. Another previous study also showed that FSTL1 promotes the activation of the NLRP3 inflammasome, resulting in the increased secre‐ tion of IL-1β from monocytes/macrophages [29]. Thus, it is conceivable that FSTL1 levels may not only reflect the MU state, but may also activate the NLRP3 inflamma‐ some in macrophages infiltrating VAT, thereby resulting in an MU state with more adverse inflammatory profiles as mediators of increasing metabolic risk. Furthermore, low levels of adiponectin from adipocyte showing the
Table 2 Odd ratios (ORs) and 95% confidence intervals for the presence of obesity and a metabolic unhealthy state according to follistatin-like protein 1 (FSTL1) levels (continuous variables) and their respective tertile (T) groups (categorical variable)
OR (95% CI) pa OR (95% CI) pb for trends
T1 (1.43–6.35 ng/dL) T2 (6.36–11.37 ng/dL) T3 (11.38–61.63 ng/dL) 1) Metabolic unhealthy (defined using ATP-III criteria)
Model I 2.07 (0.96–4.49) 0.065 Ref 2.40 (1.20–4.80) 2.43 (1.23–4.80) 0.011
Model II 1.83 (0.82–4.06) 0.128 Ref 2.34 (1.06–5.17) 2.30 (1.07–4.91) 0.040
Model III 1.90 (0.83–4.36) 0.133 Ref 2.47 (0.90–6.80) 3.12 (1.07–9.07) 0.035
2) Obese
Model I 1.11 (0.42–2.97) 0.834 Ref 0.79 (0.33–1.93) 1.09 (0.47–2.50) 0.854
Model II c 1.46 (0.53–4.07) 0.467 Ref 1.27 (0.44–3.70) 1.79 (0.67–4.81) 0.243
Model III c 1.48 (0.45–4.90) 0.518 Ref 0.91 (0.26–3.03) 1.70 (0.56–5.13) 0.329
Data presented with log-transformed FSTL1 levels. Significant results (p < 0.05) are in bold. Model I: Unadjusted.
Model II: Adjusted for sex, age, body mass index (BMI), current smoker, moderate drinker, and physically active.
Model III: Adjusted for sex, age, body mass index (BMI), current smoker, moderate drinker, physically active, mean arterial pressure, fasting plasma glucose, total cholesterol, triglyceride, high-density lipoprotein cholesterol, and low-density lipoprotein cholesterol. The pa value for the presence of obesity and a metabolic unhealthy state according to FSTL1 levels (continuous variables).
The pb value for the presence of obesity and a metabolic unhealthy state according to the respective tertile (T) groups of FSTL1 levels
(categorical variable)
inverse correlation with the cardiovascular disease [30] also induced activation of the NLRP3 inflammasome [31, 32]. Taken altogether, these findings indicate that additional investigations to identify the relationships between adiponectin and FSTL1 are necessary.
Fan et al. [28] reported that serum FSTL1 levels were significantly higher in overweight/obese subjects than in control subjects and were significantly and positively correlated with BMI, after adjustment for age and sex. In contrast, we reported a significant increase in FSTL1
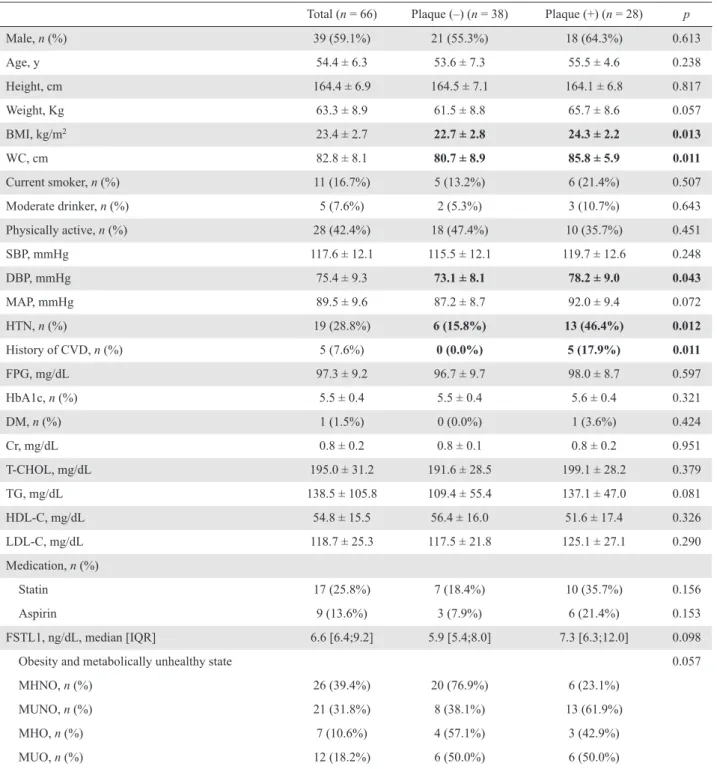
Table 3 Characteristics of the study population according to presence or absence of plaques in the coronary artery
Total (n = 66) Plaque (–) (n = 38) Plaque (+) (n = 28) p
Male, n (%) 39 (59.1%) 21 (55.3%) 18 (64.3%) 0.613 Age, y 54.4 ± 6.3 53.6 ± 7.3 55.5 ± 4.6 0.238 Height, cm 164.4 ± 6.9 164.5 ± 7.1 164.1 ± 6.8 0.817 Weight, Kg 63.3 ± 8.9 61.5 ± 8.8 65.7 ± 8.6 0.057 BMI, kg/m2 23.4 ± 2.7 22.7 ± 2.8 24.3 ± 2.2 0.013 WC, cm 82.8 ± 8.1 80.7 ± 8.9 85.8 ± 5.9 0.011 Current smoker, n (%) 11 (16.7%) 5 (13.2%) 6 (21.4%) 0.507 Moderate drinker, n (%) 5 (7.6%) 2 (5.3%) 3 (10.7%) 0.643 Physically active, n (%) 28 (42.4%) 18 (47.4%) 10 (35.7%) 0.451 SBP, mmHg 117.6 ± 12.1 115.5 ± 12.1 119.7 ± 12.6 0.248 DBP, mmHg 75.4 ± 9.3 73.1 ± 8.1 78.2 ± 9.0 0.043 MAP, mmHg 89.5 ± 9.6 87.2 ± 8.7 92.0 ± 9.4 0.072 HTN, n (%) 19 (28.8%) 6 (15.8%) 13 (46.4%) 0.012 History of CVD, n (%) 5 (7.6%) 0 (0.0%) 5 (17.9%) 0.011 FPG, mg/dL 97.3 ± 9.2 96.7 ± 9.7 98.0 ± 8.7 0.597 HbA1c, n (%) 5.5 ± 0.4 5.5 ± 0.4 5.6 ± 0.4 0.321 DM, n (%) 1 (1.5%) 0 (0.0%) 1 (3.6%) 0.424 Cr, mg/dL 0.8 ± 0.2 0.8 ± 0.1 0.8 ± 0.2 0.951 T-CHOL, mg/dL 195.0 ± 31.2 191.6 ± 28.5 199.1 ± 28.2 0.379 TG, mg/dL 138.5 ± 105.8 109.4 ± 55.4 137.1 ± 47.0 0.081 HDL-C, mg/dL 54.8 ± 15.5 56.4 ± 16.0 51.6 ± 17.4 0.326 LDL-C, mg/dL 118.7 ± 25.3 117.5 ± 21.8 125.1 ± 27.1 0.290 Medication, n (%) Statin 17 (25.8%) 7 (18.4%) 10 (35.7%) 0.156 Aspirin 9 (13.6%) 3 (7.9%) 6 (21.4%) 0.153 FSTL1, ng/dL, median [IQR] 6.6 [6.4;9.2] 5.9 [5.4;8.0] 7.3 [6.3;12.0] 0.098
Obesity and metabolically unhealthy state 0.057
MHNO, n (%) 26 (39.4%) 20 (76.9%) 6 (23.1%)
MUNO, n (%) 21 (31.8%) 8 (38.1%) 13 (61.9%)
MHO, n (%) 7 (10.6%) 4 (57.1%) 3 (42.9%)
MUO, n (%) 12 (18.2%) 6 (50.0%) 6 (50.0%)
Data are expressed as the mean ± standard deviation or as the median (interquartile range) or numbers with percentages, unless indicated otherwise. Significant results (p < 0.05) are in bold.
MHNO, metabolically healthy nonobese; MUNO, metabolically unhealthy nonobese; MHO, metabolically healthy obese; MUO,
metabolically unhealthy obese; BMI, body mass index; WC, waist circumference; SBP, systolic blood pressure; DBP, diastolic blood pressure; MAP, mean arterial pressure; HTN, hypertension; history of CVD, history of cardiovascular disease (angina, myocardial infarction, or stroke); FPG, fasting plasma glucose; HbA1c, glycated hemoglobin; DM, diabetes mellitus; T-CHOL, total cholesterol; TG, triglyceride; HDL-C, high-density lipoprotein cholesterol; LDL-C, low-density lipoprotein cholesterol; FSTL1, follistatin-like protein 1.
levels in subjects with MU state, but not in those with obesity according to BMI criteria and a significantly pos‐ itive association of FSTL1 levels with the numbers of components of MU state, but not with BMI. Although we could not explain the discrepancy between our results and those of Fan et al. [28], differences in age, BMI, the proportion of sex and MU state in obese subjects between two studies and the limitation of BMI as a measure of adiposity such as Y-Y paradox [33] might induce discrepancy. There is growing evidence that chronic low-grade inflammation due to adipocyte dys‐ function, such as increased VAT, increased VAT inflam‐ mation, and increased adipocyte size, is the potential mechanism underlying the MU state, independent of obesity [10, 34]. In the present study, FSTL1 levels were significantly and positively correlated with the fat mass, but not with BMI, so our current results might suggest that FSTL1 levels reflect inflammation from adipocyte dysfunction, but not obesity which was reflected by BMI. Our current results indicate that inflammation, but not obesity, explains the metabolic differences observed between MH and MU patients. Hypothesizing that pro‐ moted activation of the NLRP3 inflammasome in macro‐ phages infiltrating VAT by secreted FSTL1 from adipocyte might result in the increasing metabolic risk, FSTL1 may be a useful biomarker that not only reflect but may also mediate cardiometabolic risk in MU state.
This study had several notable limitations. First, we could not determine if our patients were representative of the general Korean population since they were volun‐ tarily recruited. Thus, selection bias remained a possibil‐ ity during the analysis. Second, because we included only Korean patients, our results may not be applicable to other ethnic populations. Third, the presence of coro‐ nary artery plaques was not examined in all of our patients. Finally, because of the cross-sectional design of
our study and small number of patients analyzed, a large, longitudinal follow-up study is needed in the future to confirm our findings.
Conclusions
In conclusion, circulating FTSL1 may be a useful bio‐ marker for the risk of an MU state, regardless of obesity according to BMI criteria. More studies, including large-scaled prospective studies, are needed to validate this possibility.
Disclosure
Ethics approval and consent to participate
All patients provided written informed consent. This study was approved by the institutional review board of Asan Medical Center.
Competing interests
The authors declare that they have no competing inter‐ ests that could be perceived as prejudicing the impartial‐ ity of the research reported.
Funding
This study was supported by grants from the Asan Institute for Life Sciences, Seoul, Republic of Korea (Project No. 2016–568) and from the Takeda Pharma‐ ceuticals Korea Co., Ltd., Seoul, Republic of Korea.
The funding organization had no role in the design and conduct of the study; collection, management, analysis, and interpretation of the data; preparation, review, or approval of the manuscript; and decision to submit the manuscript for publication.
Table 4 Odd ratios (ORs) and 95% confidence intervals for the presence of plaques in the coronary artery according to tertile (T) groups and follistatin-like protein 1 (FSTL1) levels
OR (95% CI)
p for trends
T1 (1.43–6.35 ng/dL) T2 (6.36–11.37 ng/dL) T3 (11.38–61.63 ng/dL)
Model I Ref 1.04 (0.33–3.24) 4.09 (1.02–16.40) 0.073
Model II Ref 0.79 (0.22–2.88) 6.32 (1.19–33.48) 0.070
Model III Ref 1.16 (0.26–5.20) 10.18 (1.48–69.86) 0.032
Model IV Ref 0.34 (0.04–3.15) 12.51 (1.15–135.73) 0.045
Data presented with log-transformed FSTL1 levels. Significant results (p < 0.05) are in bold. Model I: Unadjusted.
Model II: Adjusted for sex, age, body mass index (BMI), current smoker, moderate drinker, and physically active.
Model III: Adjusted for sex, age, body mass index (BMI), current smoking, moderate drinker, physically active, mean arterial pressure, fasting plasma glucose, total cholesterol, triglyceride, high-density lipoprotein cholesterol, and low-density lipoprotein cholesterol. Model IV: Further adjustments for history of cardiovascular disease (angina, myocardial infarction, or stroke), treatment of hypertension and diabetes mellitus, and use of statins and aspirin
Authors’ Contributions
MI Kang and SH Lee contributed equally to this study. MI Kang and SH Lee had full access to all of the data in the study and take responsibility for the integrity of the data and the accuracy of the data analysis.
1) Conception or design of the work: S-Y Lee, D-Y Kim, SH Lee, and M-I Kang
2) Analysis, or interpretation of data for the work: S-Y Lee and D-Y Kim
3) Acquisition of data for the work: MK Kwak, SH Ahn, H Kim, B-J Kim, J-M Koh, Y Rhee, CH Kim, KH Baek, and Y-K Min
4) Drafting of the work or revising it critically for important intellectual content: SH Lee, E-H Cho, MI Kang, and J-M Koh.
5) Final approval of the version to be published: All authors (S-Y Lee, D-Y Kim, MK Kwak, SH Ahn, H Kim, B-J Kim, J-M Koh, Y Rhee, CH Kim, KH Baek, Y-K Min, SH Lee, and M-I Y-Kang).
References
1. Beltran-Sanchez H, Harhay MO, Harhay MM, McElligottS (2013) Prevalence and trends of metabolic syndrome in the adult U.S. population, 1999–2010. J Am Coll Cardiol 62: 697–703.
2. Grundy SM, Brewer HB Jr, Cleeman JI, Smith SC Jr, Lenfant C (2004) Definition of metabolic syndrome: report of the National Heart, Lung, and Blood Institute/ American Heart Association conference on scientific issues related to definition. Arterioscler Thromb Vasc Biol 24: e13–e18.
3. Wilson PW, D’Agostino RB, Parise H, Sullivan L, Meigs JB (2005) Metabolic syndrome as a precursor of cardio‐ vascular disease and type 2 diabetes mellitus. Circulation 112: 3066–3072.
4. National Cholesterol Education Program Expert Panel on Detection, Evaluation Treatment of High Blood Cholesterol in Adults (2002) Third report of the national cholesterol education program (NCEP) expert panel on detection, evaluation, and treatment of high blood choles‐ terol in adults (Adult Treatment Panel III) final report. Circulation 106: 3143–3421.
5. Bray GA, Bellanger T (2006) Epidemiology, trends, and morbidities of obesity and the metabolic syndrome. Endo‐ crine 29: 109–117.
6. Phillips CM (2013) Metabolically healthy obesity: defini‐ tions, determinants and clinical implications. Rev Endocr Metab Disord 14: 219–227.
7. Primeau V, Coderre L, Karelis AD, Brochu M, Lavoie ME, et al. (2011) Characterizing the profile of obese patients who are metabolically healthy. Int J Obes (Lond) 35: 971–981.
8. Ruderman NB, Schneider SH, Berchtold P (1981) The “metabolically-obese,” normal-weight individual. Am J Clin Nutr 34: 1617–1621.
9. Kramer CK, Zinman B, Retnakaran R (2013) Are meta‐ bolically healthy overweight and obesity benign condi‐ tions?: a systematic review and meta-analysis. Ann Intern Med 159: 758–769.
10. Esser N, L’Homme L, De Roover A, Kohnen L, Scheen AJ, et al. (2013) Obesity phenotype is related to NLRP3 inflammasome activity and immunological profile of vis‐ ceral adipose tissue. Diabetologia 56: 2487–2497. 11. Karelis AD, Faraj M, Bastard JP, St-Pierre DH, Brochu
M, et al. (2005) The metabolically healthy but obese indi‐
vidual presents a favorable inflammation profile. J Clin Endocrinol Metab 90: 4145–4150.
12. Phillips CM, Perry IJ (2013) Does inflammation deter‐ mine metabolic health status in obese and nonobese adults? J Clin Endocrinol Metab 98: E1610–E1619. 13. Gómez-Ambrosi J, Catalán V, Rodríguez A, Andrada P,
Ramírez B, et al. (2014) Increased cardiometabolic risk factors and inflammation in adipose tissue in obese sub‐ jects classified as metabolically healthy. Diabetes Care 37: 2813–2821.
14. Wildman RP, Kaplan R, Manson JE, Rajkovic A, Connelly SA, et al. (2011) Body size phenotypes and inflammation in the women’s health initiative observatio‐ nal study. Obesity (Silver Spring) 19: 1482–1491. 15. Chaly Y, Hostager B, Smith S, Hirsch R (2014)
Follistatin-like protein 1 and its role in inflammation and inflammatory diseases. Immunol Res 59: 266–272. 16. Hayakawa S, Ohashi K, Shibata R, Takahashi R, Otaka N,
et al. (2016) Association of circulating follistatin-like 1 levels with inflammatory and oxidative stress markers in healthy men. PLoS One 11: e0153619.
17. El-Armouche A, Ouchi N, Tanaka K, Doros G, Wittköpper K, et al. (2011) Follistatin-like 1 in chronic systolic heart failure: a marker of left ventricular remodel‐ ing. Circ Heart Fail 4: 621–627.
18. Widera C, Horn-Wichmann R, Kempf T, Bethmann K, Fiedler B, et al. (2009) Circulating concentrations of follistatin-like 1 in healthy individuals and patients with acute coronary syndrome as assessed by an immunolumi‐ nometric sandwich assay. Clin Chem 55: 1794–1800. 19. Seki M, Powers JC, Maruyama S, Zuriaga MA, Wu CL, et
al. (2018) Acute and chronic increases of circulating FSTL1 normalize energy substrate metabolism in pacing-induced heart failure. Circ Heart Fail 11: e004486. 20. Yeh ET, Willerson JT (2003) Coming of age of C-reactive
protein: using inflammation markers in cardiology. Circu‐ lation 107: 370–371.
21. American Diabetes Association (2013) Standards of medi‐ cal care in diabetes 2013. Diabetes Care 36 Suppl 1: S11– S66.
22. Furusyo N, Koga T, Ai M, Otokozawa S, Kohzuma T, et al. (2011) Utility of glycated albumin for the diagnosis of diabetes mellitus in a Japanese population study: results from the Kyushu and Okinawa population study (KOPS).
Diabetologia 54: 3028–3036.
23. Grundy SM, Cleeman JI, Daniels SR, Donato KA, Eckel RH, et al. (2005) Diagnosis and management of the meta‐ bolic syndrome: an American Heart Association/National Heart, Lung, and Blood Institute Scientific Statement. Cir‐ culation 112: 2735–2752.
24. WHO expert consultation (2004) Appropriate body-mass index for Asian populations and its implications for policy and intervention strategies. Lancet 363: 157–163.
25. Leber AW, Becker A, Knez A, von Ziegler F, Sirol M, et al. (2006) Accuracy of 64-slice computed tomography to classify and quantify plaque volumes in the proximal cor‐ onary system: a comparative study using intravascular ultrasound. J Am Coll Cardiol 47: 672–677.
26. Hotamisligil GS (2006) Inflammation and metabolic dis‐ orders. Nature 444: 860–867.
27. Li D, Wang Y, Xu N, Wei Q, Wu M, et al. (2011) Follistatin-like protein 1 is elevated in systemic autoim‐ mune diseases and correlated with disease activity in patients with rheumatoid arthritis. Arthritis Res Ther 13: R17.
28. Fan N, Sun H, Wang Y, Wang Y, Zhang L, et al. (2013) Follistatin-like 1: a potential mediator of inflammation in
obesity. Mediators Inflamm 2013: 752519.
29. Chaly Y, Fu Y, Marinov A, Hostager B, Yan W, et al. (2014) Follistatin-like protein 1 enhances NLRP3 inflammasome-mediated IL-1beta secretion from mono‐ cytes and macrophages. Eur J Immunol 44: 1467–1479. 30. Takemura Y, Walsh K, Ouchi N (2007) Adiponectin and
cardiovascular inflammatory responses. Curr Atheroscler Rep 9: 238–243.
31. Bando S, Fukuda D, Soeki T, Nishimoto S, Uematsu E, et al. (2015) Expression of NLRP3 in subcutaneous adipose tissue is associated with coronary atherosclerosis. Athero‐ sclerosis 242: 407–414.
32. Zhang J, Xia L, Zhang F, Zhu D, Xin C, et al. (2017) A novel mechanism of diabetic vascular endothelial dysfunc‐ tion: Hypoadiponectinemia-induced NLRP3 inflamma‐ some activation. Biochim Biophys Acta Mol Basis Dis 1863: 1556–1567.
33. Yajnik CS, Yudkin JS (2004) The Y-Y paradox. Lancet 363: 163.
34. Klöting N, Fasshauer M, Dietrich A, Kovacs P, Schön MR, et al. (2010) Insulin-sensitive obesity. Am J Physiol Endocrinol Metab 299: E506–E515.