Dense Thermal 3D Point Cloud Generation of Building Envelope by
Drone-based Photogrammetry
Jo, Hyeon Jeong
1)·Jang, Yeong Jae
2)·Lee, Jae Wang
3)·Oh, Jae Hong
4)Abstract
Recently there are growing interests on the energy conservation and emission reduction. In the fields of architecture and civil engineering, the energy monitoring of structures is required to response the energy issues. In perspective of thermal monitoring, thermal images gains popularity for their rich visual information. With the rapid development of the drone platform, aerial thermal images acquired using drone can be used to monitor not only a part of structure, but wider coverage. In addition, the stereo photogrammetric process is expected to generate 3D point cloud with thermal information. However thermal images show very poor in resolution with narrow field of view that limit the use of drone-based thermal photogrammety. In the study, we aimed to generate 3D thermal point cloud using visible and thermal images. The visible images show high spatial resolution being able to generate precise and dense point clouds. Then we extract thermal information from thermal images to assign them onto the point clouds by precisely establishing photogrammetric collinearity between the point clouds and thermal images. From the experiment, we successfully generate dense 3D thermal point cloud showing 3D thermal distribution over the building structure.
Keywords : Thermal Camera, Drone Photogrammetry, Point Cloud, 3D Thermal Information, Bundle Adjustment
1. Introduction
Recently there are growing interests on the energy conservation and emission reduction. In the fields of architecture and civil engineering, the energy monitoring of building and infrastructures is required to response the energy issues. In perspective of thermal energy monitoring, thermal image gains popularity for their rich visual information(Fokaides et al., 2011; O’Grady et al., 2018; Jeong et al., 2020).
Traditionally, handheld thermal sensors are widely used for local detection of thermal anomaly on the object surface. With the development of a drone platform, aerial thermal images acquired using a drone can be used to monitor not only a part of structure, but wider coverage. Therefore thermal camera-equiped drones are used to check facade of buildings based on single thermal image analysis.
The stereo photogrammetric process is expected to generate 3D point cloud with thermal information. When a lot of
Received 2021. 04. 08, Revised 2021. 04. 15, Accepted 2021. 04. 23
1) Interdisciplinary Major of Ocean Renewable Energy Engineering, M.S. student, Korea Maritime and Ocean University (E-mail: [email protected]) 2) Staff, Korea Ocean Satellite Center, Korea Institute of Ocean Science & Technology (E-mail: [email protected])
3) Dept. of Civil Engineering, Undergraduate student, Korea Maritime and Ocean University (E-mail: [email protected])
4) Corresponding Author, Member, Dept. of Civil Engineering, Associate Professor, Korea Maritime and Ocean University (E-mail: [email protected])
https://doi.org/10.7848/ksgpc.2021.39.2.73 Original article
overlapped images are acquired with a gridded drone operation, the images can be processed with photogrammetric technique. However thermal images show very poor in resolution with narrow FOV (Field Of View) that limit the photogrammetric image process. Therefore the use of thermal camera has been focused on 2D applications(Oh, 2018; Lee et al., 2018; Ham et
al., 2019). Oh(2018) used the thermal camera to monitor solar
panels using georeferenced thermal images. Ham et al.(2019) used thermal information for the agriculture site monitoring. But there are few studies on generating 3D thermal point cloud while some studies aimed to generated point clouds in terrestrial data for building facade thermal attribute mapping(Truong et
al., 2017; Lin et al., 2019)
In the study, we aimed to generate 3D thermal point clouds using visible and thermal images from drone surveying. The visible images show high spatial resolution being able to generate precise and dense point clouds in the object space while the thermal images with very low resolution and narrow FOV often fail to produce 3D information. We tried to extract thermal information from thermal images to assign them onto the dense point clouds from visible images by establishing photogrammetric collinearity between the point clouds and thermal images.
Extraction of DNs (Digital Numbers) from thermal images are based on the rigorous collinearity but we should consider the possibility of occlusions in the object space. Therefore we used the distance information between a point and the images to prevent wrong thermal DNs assignment. Finally, there are multiple thermal images available such that a point in the point clouds corresponds to multiple thermal DNs. To this end we tested several strategies including averaging thermal DNs, the maximum, and the minimum respectively
The paper is organized as follows. Section 2 introduces the flowchart with the photogrammetric process used in the study. Section 3 illustrates experimental results and followed by the conclusion in Section 4.
2. Methodology
In the study, we limited the proposed methodology to the case of an integrated camera of visible and thermal sensors such as DJI XT2. Based on the assumption that visible and thermal
images have same EOPs (Exterior Orientation Parameters), the RGB image provide precise and dense 3D point clouds while thermal images are used as thermal information for the points. Firstly, high resolution visible images are processed for the bundle adjustment. If accurate IOPs (Interior Orientation Parameters) of visible camera are known, the bundle adjustment is carried out only for EOPs. But if it is not the case, the self camera calibration should be conducted. Otherwise the EOPs may not be accurate enough because of the high correlation with IOPs. The bundle adjusted visible images are multi-image matched for the dense point clouds.
Next, the thermal images are processed for the self-calibration. In this stage, EOPs of the thermal images are fixed as constants and only IOPs of thermal camera are estimated as unknowns. If the estimation is satisfactory, each point in the clouds is projected into the thermal images to seek thermal DNs using the collinearity equation of thermal camera IOPs and EOPs from the visible image bundle adjustment. Multi thermal images are related to a ground point such that a strategy to select optimal digital number should be considered.
Fig. 1. The flowchart for the study
2.1 Collinearity Equation
The photogrammetric process such as the bundle adjustment and the image projection is basically based on the collinearity equation expressed in Eq. (1) that relates 2D coordinates in the image space to 3D coordinates in the object space. The equation requires IOPs of the camera and lens distortion information such as the focal length, principal points, radial lens distortion,
decentering distortion, and in-plane distortion (Fraser, 1997). For image projection, given a ground coordinates X, Y, Z the corresponding image coordinates are computed through U,
V, W are computation. ∆ ∆ ∆ ∆ ∆
(1)where, are image coordinates, X, Y, Z are ground
coordinates, are perspective center coordinates, is rotation matrix consisting of roll(), pitch(), yaw
() ( ). is focal length, are principal
offset, are radial distortion parameters,
are decentering distortion parameters, are in-plane
distortion parameters.
The bundle adjustment is a process to estimate EOPs of all acquired images with calibrated camera information. If the camera is not calibrated, the calibration is also carried out with the bundle adjustment.
Eq. (2) in the unified least square form shows the later case of bundle adjustment where IOPs, EOPs, and ground controls are all set to unknowns. Eq. (2) in linear form is derived from non-linear Eq. (1). During the linearization, derivatives for each unknown in IOPs, EOPs are derived as Eq. (3) (McGlone et al., 2004; Oh et al., 2006).
(2) where · indicates exterior orientation parameters, ^ is for interior orientation parameters, ‥ is for the ground control points, is coefficient matrices derived from Eq. (1), iscorrection, is identity matrix, is constant, is residual
vector. (3)
where
.2.2 Thermal DN Assignment
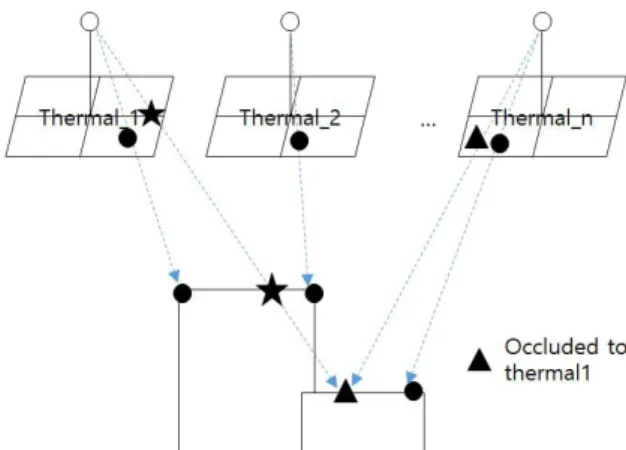
In a drone surveying, a lot of drone images are acquired with overlaps. Therefore a point in the cloud can be projected into a number of thermal images such that multiple DNs are sought. The major problem is that a simple image projection cannot handle the occlusion as shown in Fig. 2 where the occluded point could be assigned with DN of thermal image 1. To handle this issue, we used the strategy that assign only one DN of an image onto a point in the cloud using the distance information computed between the projection center and the 3D point.
In addition, a point in the cloud can have multiple DNs from images. Therefore we tested several approaches to handle the multiple DNs such as averaging or selecting maximum or minimum value.
Fig. 2. Thermal DN assignment considering the occlusion
3. Experiment
3.1 Data acquisition
The experiment was carried out for a building in Korea Maritime and Ocean University. DJI matrice 200 drone with XT2 camera was used for the data acquisition. XT2 camera that includes visible and thermal sensors is shown in Fig. 3. The test target and the camera specification of visible and thermal are shown in Fig. 3 and Table 1. The visible camera of RGB acquires high resolution 4,000 x 3,000 pixels images while the thermal camera show very poor spatial resolution of 336 x 256 pixels. In addition, the thermal camera has relatively narrow FOV compared to the visible camera such that the quality stereo model creation by overlapping between images is quite limited.
Fig. 3. Test area
Fig. 4. XT2 camera of visible and thermal sensors Table 1. XT2 camera specification
RGB camera Thermal
Focal length 8 mm 13 mm
FOV 57.12°×42.44° 25°×19°
Pixel pitch 2 micron 17 micron
Sensor size 4000×3000 336×256
3.2 Visible and Thermal Image Processing
Total 255 RGB images and 255 thermal images were acquired as some of acquired images are shown in Fig. 5. Note that thermal images are originally in 16 bits. In this study we applied a linear image stretch using the minimum and maximum DNs of the entire images to convert 16 bits data into a 8 bits pseudo-color computer display. The visible and thermal image numbers are in even and odd numbers, respectively. For example, visible image 362 correspond to thermal image 361.
Fig. 6 shows an example image of visible and thermal. Note that the thermal image area is very narrow compared to the visible image.
(a)
(b)
Fig. 5. Some of acquired drone images (a) visible (b) thermal
Fig. 6. An example image of visible and thermal
The visible images of RGB were processed with the bundle image adjustment. We assumed that the IOPs of the camera are not available so the self-calibration was carried out. The mean reprojection error of visible image bundle adjustment was 0.350 pixels as shown in Table 2 and the calibrated camera parameters including the distortions are presented in Table 3.
Table 2. XT2 camera bundle adjustment precision RGB camera Thermal Mean reprojection error
Table 3. XT2 camera calibration results RGB camera Thermal Focal length ( in mm) 8.5133 mm 13.0643 mm Principal point offset ( in mm) 0.0996, 0.1267 0.1273, 0.2829 Radial distortion ( ) -6.9537×10⁻⁴ 6.2188×10⁻⁶ -4.4962×10⁻⁸ -1.2602×10⁻⁴ 1.1305×10⁻⁵ -9.7223×10⁻⁷ Decentering distortion ( ) 8.8385×10⁻⁶ -2.5725×10⁻⁶ -5.4095×10⁻⁶ 1.7841×10⁻⁵
The bundle adjustment result was decent so the EOPs of bundle adjusted visible images are imported into the thermal image project. In thermal image project, the EOPs are fixed as constant and the bundle adjustment was carried out only for IOPs of the thermal camera. The mean reprojection error of thermal image bundle adjustment was 0.914 pixels as shown in Table 2 and the estimated IOPs are presented in Table 3.
To check the consistency between the visible and thermal images, we selected 79 ground points from the visible image project and used them as controls in the thermal project. The mean squared error of 79 points was 0.208 m.
3.3 3D Point Cloud Generation
The visible images with estimated EOPs were used for dense image matching. The dense point cloud generated is shown in Fig. 7. The quality of the point cloud was decent even for the glass part in the upper face of the building. Note that glasses often show poor 3D reconstruction from photogrammetry.
Fig. 7. Dense point cloud from visible images
Next we projected each point cloud into thermal images to retrieve thermal DN values. In the image projection, we used the estimated IOPs of thermal camera including the distortions and estimated EOPs of visible camera. For the DN resampling, we used simple nearest neighbor approach.
Fig 8 show the resulted 3D thermal point cloud. Figs. 8(a), (b), and (c) show the cases of averaging thermal DN, the maximum, and the minimum respectively. The left side figures in Fig. 8 present the cases of no occlusion consideration and the right sides are for the occlusion consideration. Note that the geometry of the 3D model was derived from visible images while DNs are extracted from thermal images.
(a)
(b)
(c)
Fig. 8. Generated 3D thermal point cloud, (left) without occlusion consideration (right) with occlusion
consideration (a) Mean (b) Max (c) Min
Apparently the cases when the occlusion was considered, less noisy results can be obtained. In Fig. 8(a), the left
figure are more smoother than the right figure especially lower right part of windows in the building. It is because more noise DN from the occlusion area are included for the averaging DNs. Also, maximum or minimum DN selection approach produced very noisy results for no occlusion consideration.
4. Conclusion
In the study we generated 3D thermal point clouds using visible and thermal images from drone surveying. There are four essential data for 3D thermal point cloud generation such as the dense point clouds, thermal DN, IOPs, and EOPs. We extracted the dense point clouds and EOPs from the visible image bundle adjustment. It was because the visible images show high spatial resolution being able to generate precise and dense point cloud. IOPs of thermal camera were estimated from thermal image bundle adjustment with visible band-supported EOPs.
We tried to extract thermal information from thermal images to assign them onto the point clouds by establishing photogrammetric collinearity between the point clouds and thermal images. We tested the several cases including occlusion consideration in the object space and DN value selections. From the experiment, we successfully generate dense 3D thermal point clouds showing decent 3D thermal distribution over the building structure with consideration of occlusion in the object space. When the occlusion was considered, much less noisy 3D thermal information could be obtained for all cases of mean, maximum, and minimum DN selection approaches. Note that thermal images with very low resolution were not able to produce decent 3D information with the conventional photogrammetric process.
Future study will include the calibration of thermal DN values for reliable transformation of DN to temperatures using the ground truth temperature values.
Acknowledgment
This work was supported by the Ministry of Education of the Republic of Korea and the National Research Foundation
of Korea (NRF-2019R1I1A3A01062109).
References
Fokaides, P.A. and Kalogirou, S.A. (2011), Application of infrared thermography for the determination of the overall heat transfer coecient (U-Value) in building envelopes, Applied Energy, Vol. 88, No. 12, pp.4358– 4365.
Fraser, C.S. (1997), Digital camera self calibration, ISPRS
Journal of Photogrammetry & Remote Sensing, Vol. 52,
pp. 149-159.
Ham, G.W., Lee, J.M., Bae, K.H., and Park, H.G. (2019), A study on agricultural drought monitoring using drone thermal and hyperspectral sensor, Journal of the Korean
Association of Geographic Information Studies, Vol. 22,
No. 3, pp.107–119. (in Korean with English abstract) Jeong, H., Kwon, G.R., and Lee, S.W. (2020), Deterioration
diagnosis of solar module using thermal and visible image processing, Energies, Vol. 13, No. 11, p.2856 Lee, J.G., Ryu, Y.C., Kim, Y.H., Choi, W., and Kim, H.J.
(2018), Drone infrared thermography method for leakage inspection of reservoir embankment, Journal of the
Korean Society of Agricultural Engineers, Vol. 60, No. 6,
pp.21-31. (in Korean with English abstract)
Lin, D., Jarzabek-Rychardb, M., Tong, X., and Maas, H.G. (2019), Fusion of thermal imagery with point clouds for building facade thermal attribute mapping, ISPRS
Journal of Photogrammetry and Remote Sensing, Vol.
151, pp.162-175.
Mcglone, C., Mikhail E., and Bethel, J. (2004), Manual of
Photogrammetry, Fifth ed, ASPRS. pp.870-879.
Oh, J.H., Lee, C.N., and Eo, Y.D. (2006), A photogrammetric network and object field design for efficient self-calibration of non-metric digital Cameras, Korean
Journal of Geomatics, Vol. 24, No. 3, pp. 281-288. (in
Korean with English abstract)
Oh, Y.G. (2018), Solar Panel Detection and Monitoring
Using a Multi-sensor Drone, Master’s thesis, University
of Seoul, Seoul, Korea, 79p. (in Korean with English abstract)
Application of infrared thermography technique to the thermal assessment of multiple thermal bridges and windows, Energy and Building. Vol. 168, pp.347–362. Truong, T.P., Yamaguchi, M., Mori, S., Nozick, V., and
Saito, H. (2017), Registration of RGB and thermal point clouds generated by structure from motion, 2017 IEEE
International Conference on Computer Vision Workshops