Journal of the Korean School Mathematics Society Volume 24, Number 1, 1-18, March 2021 http://doi.org/10.30807/ksms.2021.24.1.001
A Psychometric Analysis and Revision of the Mathematics
Teaching Efficacy Beliefs Instrument Using the Rasch Model:
Focusing on Personal Teaching Efficacy
Hwang, Sunghwan1)The purpose of the study was to examine the psychometric properties of the personal teaching efficacy of the Mathematics Teaching Efficacy Beliefs Instrument and revise the scale for the use of Korean elementary school teachers. Data were collected from 299 elementary teachers. A Rasch analysis was used to evaluate unidimensionality and appropriateness of category use and item difficulty levels. Moreover, person separation and reliability as well as item separation and reliability were examined using the revised scale. Results suggested that the original personal teaching efficacy scale (13 items with five categories) had several problems in its psychometric properties. Thus, we revised the scale into eight items with four categories. The follow-up analysis results showed the revised scale provided sufficient psychometric properties for measuring Korean elementary school teachers’ self-efficacy beliefs for teaching mathematics. Limitations and implications of the study were also discussed.
Key words: self-efficacy beliefs, Rasch analysis, Mathematics Teaching Efficacy Beliefs Instrument, personal teaching efficacy, elementary teachers
Ⅰ. Introduction
For the past four decades, a significant amount of research has been conducted on teachers’ self-efficacy beliefs. Researchers have documented the positive relationship between teachers’ self-efficacy and their commitment to teaching (Ware & Kitsantas, 2007) and the implementation of innovative instructional practices (Nie, Tan, Liau, Lau, & Chua, 2013). In addition, researchers have reported that teachers’ self-efficacy beliefs are related to students’ self-efficacy (Siegle & McCoach, 2007) and achievement (Woolfolk Hoy, & Davis, 2006). From this perspective, Henson, Kogan, and Vacha-Haase (2001) noted that “perhaps one of the best documented attributes of
effective teachers is a strong sense of efficacy” (p. 4).
In mathematics education, studies have likewise reported that mathematics teachers’ self-efficacy beliefs relate to not only their instructional practices (Bruce & Ross, 2008; Charalambous & Philippou, 2010; Donnell & Gettinger, 2015; Smith, 1996) but also their students’ self-confidence and mathematics achievement (Bagaka, 2011; Hines, 2008; Maguire, 2011). Similarly, Korean scholars have found positive associations between mathematics teachers’ self-efficacy beliefs and their students’ mathematics achievement (Cho, Park, & Hwang, 2014; Han, Park, & Lee, 2013; Heo & Kim, 2013). Thus, it is critical to accurately measure teachers’ self-efficacy beliefs for teaching mathematics to help them develop a high level of self-efficacy beliefs.
Although there are scales for measuring Korean elementary school teachers’ self-efficacy beliefs for teaching mathematics, they do not have conceptual clarity. Although teachers’ efficacy beliefs relate to a judgment of their capability to influence student engagement and learning (Tschannen-Moran & Woolfolk Hoy, 2001), some scales have examined teachers’ perceptions of their pedagogical content knowledge for teaching mathematics and beliefs about their students (Kim & Kang, 2015) and teachers’ problem-solving experiences when they were younger students (Kim & Shin, 2017). In this context, we attempted to revise the Mathematics Teaching Efficacy Beliefs Instrument (MTEBI) developed by Enochs, Smith, and Huinker (2000) for the use of Korean elementary school teachers. We made this revision because the MTEBI was created based on Bandura’s social cognitive theory (1997) and has been the most widely used instrument for measuring teachers’ self-efficacy beliefs for teaching mathematics (McGee & Wang, 2014).
Researchers have used factor analysis to evaluate the psychometric properties of a scale. As a result, none of them examined levels of specificity and difficulty. Bandura (2006) pointed out the importance of examining the difficulty levels of self-efficacy scales, arguing that “efficacy should be measured against levels of task demands that represent gradations of challenges” (p. 311). To address the limitations of previous studies, we conducted a Rasch analysis with the MTEBI to examine the hierarchy of item difficulties. Rasch analysis helps examine whether the items are ordered according to difficulties of endorsement to response or behavior (Bond & Fox, 2001). In sum, the purpose of our study was to evaluate the psychometric properties of the MTEBI with a sample of Korean elementary school teachers and revise the scale for their use.
Ⅱ. Literature Review
1. Self-Efficacy Beliefs
Bandura (1997) defined perceived self-efficacy as “beliefs in one’s capabilities to organize and execute the courses of action required to produce given attainments” (p. 3). Self-efficacy is related to an individual’s judgment of what they can do. Thus, although self-efficacy beliefs are related to a person’s actual ability, they are more closely aligned with that person’s beliefs in their ability to accomplish a certain task. Self-efficacy beliefs influence behavior, effort, endurance, and resilience (Bandura, 1997). For example, an elementary teacher with a low level of self-efficacy for teaching
mathematics is likely to be afraid of teaching the subject. Consequently, the teacher tends to develop a negative attitude toward teaching mathematics and to avoid it in the classroom (Charalambous & Philippou, 2010; Smith, 1996).
Self-efficacy is different from self-concept and self-esteem because as a broader concept, self-concepts (Bandura, 1997) are concerned with self-image created by combining an individual’s various attributes, whereas self-efficacy relates to capability in a certain subject. Furthermore, self-esteem is related to the evaluation of self-worth, not capability. Bandura (1997) also differentiated efficacy expectations from outcome expectancy. The efficacy expectation is concerned with an individual’s belief in their capability to successfully execute a certain behavior. Conversely, outcome expectancy is concerned with their belief that a certain behavior will result in a specific outcome. Because outcome expectancy is likely to be influenced by external factors, Bandura suggested only efficacy expectations should be measured to accurately understand a person’s self-efficacy beliefs. Regarding the construction of a self-efficacy scale, Bandura (2006) emphasized the importance of various levels of items. He argued that a sound self-efficacy scale should reflect the levels of difficulty that individuals believe they can exercise (or endorse) easily or with difficulty. If a scale contains only challenging or only easy items, the outcome of such a scale would not provide accurate information about the participants.
2. Mathematics Teachers’ Self-Efficacy Beliefs
Modern mathematics teachers are expected to implement innovative student-centered instructional practices (Ministry of Education, 2015; National Council of Teachers of Mathematics, 2014). They are asked to implement student investigations and group discussions and to use a variety of educational materials, apps, and technology devices, many of which they rarely encountered when they were students. Moreover, Korean teachers are required not only to teach mathematical content but also to improve students’ six key competencies (i.e., problem-solving, reasoning, communication, creativity and integration, information processing, and attitude and practices) in the mathematics classroom (Ministry of Education, 2015). In this challenging environment, teachers’ self-efficacy can undermine or elevate their implementation of those innovative instructional practices (Donnell & Gettinger, 2015; Nie et al., 2013). Teacher self-efficacy beliefs are defined as a teacher’s “judgment of his or her capabilities to bring about desired outcomes of student engagement and learning” (Tschannen-Moran & Woolfolk Hoy, 2001, p. 783). Note that the desired outcomes refer to positive student learning activities in the classroom rather than mathematics achievement on the standardized tests. Thus, teachers with a high level of efficacy for teaching mathematics tend to easily adapt to innovative instruction and materials, whereas teachers with a low level of efficacy are likely to sustain traditional teaching practices that they learned from their own teachers (Bruce & Ross, 2008; Charalambous & Philippou, 2010; Donnell & Gettinger, 2015; Philippou & Pantziara, 2015; Smith, 1996).
Several scales have been developed to measure teachers’ general self-efficacy beliefs, such as teacher self-efficacy beliefs scales (Tschannen-Moran & Woolfolk Hoy, 2001). However, researchers have doubts about the applicability of such instruments to measure teachers’
subject-specific self-efficacy. Because teachers’ sense of efficacy could vary by subject, instruments should evaluate teachers’ content-specific efficacy rather than their general efficacy (Philippou & Pantziara, 2015). For example, in a study examining an elementary teacher’s professional identity and instructional practices, Spillane (2000) found although the teacher had a high level of self-efficacy in teaching literacy, she was afraid of teaching mathematics. If teachers’ self-efficacy is therefore measured without considering domain-specific teaching self-efficacy, the instrument might be unable to accurately measure the levels of magnitude, generality, and strength of self-efficacy and would lose predictive power (Bandura, 1997, 2006).
Enochs et al. (2000) developed the MTEBI to measure preservice teachers’ self-efficacy beliefs in mathematics teaching. In the MTEBI, teachers’ self-efficacy beliefs are conceptualized as personal mathematics teaching efficacy (13 items) and mathematics teaching outcome expectancy (eight items). All items were measured using a five-point Likert scale, ranging from strongly disagree to strongly agree. For example, a sample item of personal mathematics teaching efficacy was “I will continually find better ways to teach mathematics,” and a sample item of outcome expectancy is that “the teacher is generally responsible for the achievement of student mathematics” (Enochs et al., 2000, p. 201). Several researchers have examined the MTEBI’s validity and reliability with multiple populations, including Arabic (Alkhateeb, 2004), Czech (Dofková & Kvintová, 2018), Greek (Koutsianou & Emvalotis, 2019), Korean (Rang, 2014), and American (Head, 2012; Kieftenbeld, Natesan, & Eddy, 2011). The authors have found the same two-factor structures aligned with the original MTEBI. However, some studies have questioned the psychometric properties of the outcome expectancy because it has a relatively low reliability coefficient alpha, and some items show low factor loading scores. Bandura (2006) explained because outcome expectancies are related to student achievement and are influenced by external factors (e.g., student, school, and parental factors), they have lower accuracy than personal teaching efficacy. Consequently, outcome expectancy adds little to the predictive power for measuring teachers’ efficacy beliefs (Tschannen-Moran & Woolfolk Hoy, 2001).
In Korea, several scales were used for measuring elementary teachers’ self-efficacy beliefs for teaching mathematics. One of the most widely used scales was the Korean version of the MTEBI developed by Rang (2007). Rang translated the MTEBI into Korean and examined the scale’s validity and reliability with factor analyses. However, Rang verified the scale using a sample of preservice teachers. The MTEBI’s psychometric properties have never been examined with data from elementary school teachers.
Other researchers have developed their own scales. For example, Kim and Kang (2015) developed a scale for measuring elementary school teachers’ self-efficacy beliefs for teaching mathematics using data from 183 teachers. The scale consisted of six factors, including efficacy expectation for mathematics teaching, efficacy expectation for the outcome of mathematics teaching, beliefs about mathematical pedagogical content knowledge, beliefs about their students, beliefs about past learning experiences, and beliefs about the influence of social–cultural factors. Because they focused on the relationship between teacher characteristics (e.g., gender, major, and years of experience) and the level of self-efficacy beliefs, they did not implement a psychometric analysis of the scale. Another example is a scale developed by Kim and Shin (2017). Using
exploratory factor analysis, they found two factor structures consisting of self-efficacy beliefs for mathematics teaching and for mathematics. Self-efficacy beliefs for mathematics, which were not contained in the MTEBI, measured teachers’ self-efficacy beliefs about their problem-solving abilities both as current teachers and in the past when they were school students. The authors verified the scale with a sample of 300 teachers. However, none examined the levels of specificity and difficulty on self-efficacy beliefs scale. Moreover, some items of the scales were not closely related to self-efficacy beliefs for teaching mathematics (Tschannen-Moran & Woolfolk Hoy, 2001) Therefore, we need additional studies to develop a scale to accurately measure Korean elementary school teachers’ self-efficacy beliefs for teaching mathematics.
Ⅲ. Methods
1. Participants
This study examined the psychometric property of personal teaching efficacy of the MTEBI and revised the scale for Korean elementary school teachers. The first author of this study has been working as an elementary school teacher for more than 10 years. He asked his colleagues and college alumni to distribute the survey to their schools. The collected survey responses were sent to him with scanned copies. The participant group comprised 299 elementary teachers who currently teach mathematics: 57 men (19.1%), 238 women (79.6%), and four who did not indicate their sex. This is similar with gender ration of male to female Korean elementary school teachers (23% to 77%, Korean Educational Statistics Service, 2019). Participants had varying years of experience: 1 to 5 years (n = 64; 21.4%), 6 to 10 years (n = 76; 25.4%), 11 to 15 years (n = 48; 16.1%), 16 to 20 years (n =56; 18.7%), and more than 20 years (n = 51; 17.1%).
2. Instrument
The original MTEBI focused on both personal teaching efficacy and outcome expectancy. However, given that (a) Bandura (2006) suggested focusing on personal teaching efficacy and (b) empirical studies have found low validity and reliability of outcome expectancies (Alkhateeb, 2004; Head, 2012; Kieftenbeld et al., 2011), the current study examined only the psychometric properties of personal teaching efficacy. The MTEBI was developed to examine preservice teachers’ mathematics teaching self-efficacy. Thus, some future tenses of the scale were changed into present tense. We translated items, and three doctoral students who have more than 5 years of teaching experience as elementary school teachers examined the items. Based on their recommendation, we modified the wording of some items. Aligned with the MTEBI, Korean version of the personal teaching efficacy scale consisted of a five-point Likert scale (from strongly disagree to strongly agree) and had eight negatively worded and five positively worded items. The negatively worded items were reverse coded for data analysis.
3. Data Analysis
We used the Rasch model to examine our data. The Rasch model is regarded as in the domain of item response theory (IRT), which is equivalent to the one-parameter logistic IRT model (Bond & Fox, 2001; Hong, Kim, & Wolfe, 2005). In the classical test theory (CTT), the difficulty of each item is ignored, and the scale assumes all items to be equal (Crocker & Algina, 2008). However, the Rasch model converts raw scores to a logarithm and estimates the probability of success between items and person (Linacre, 2012). Because the Rasch model converts raw data into interval measures, it allows researchers to obtain item difficulty and personal ability estimates that are independent of any specific sample. Moreover, it provides a variable map that displays the locations of items and persons on the same scale. The map can be used to examine the item-ordered structures (e.g., item difficulty) and underlying constructs in a scale (Bond & Fox, 2001). Equations 1 and 2 show basic Rasch model equations for dichotomous data (Hong et al., 2005; Wright & Masters, 1982). refers to the ability of person n; is the difficulty of one
step in item
. refers to the probability of person n correctly answering on item i. Hence,a positive logit score indicates the item is easy to agree with, whereas a negative logit score indicates the item is difficult to agree with. For example, when is greater than , the
probability of answering “yes” is greater than 50%.
ln Equation 1. exp exp Equation 2.
The partial credit model (PCM) is an extension of the dichotomous Rasch model (Hong et al., 2005; Wright & Masters, 1982). It allows the analysis of items with ordered categories, such as Likert scales. The PCM can be expressed as Equation 3. refers to item step difficulty related
to category j of item i. The indicates the count of the completed item steps. The PCM allows representation of the difficulty of each step. Hence, a higher indicates a greater difficulty
level for a certain step compared to other steps within an item. The rating scale model (RSM) is a subgroup of the PCM. Unlike the PCM, the RSM assumes the step structure of all items is the same—all items have the same number of response options (or categories). Thus, the RSM increases the interpretability of the model more than the PCM. We used the RSM for the current study because the steps of the personal teaching efficacy scale are uniform across all items, and the results of the RSM and the PCM are fairly similar for the analysis of Likert-scale items (Hong et al., 2005).
exp
exp
Equation 3.We first examined the unidimensionality and appropriateness of category use and the item difficulty level of personal teaching efficacy of the MTEBI using the RSM. Based on the results of the first analysis, we revised the number of categories and deleted items to improve the scale’s psychometric properties. We then reexamined the scale with the remaining items. Additionally, personal separation and reliability as well as item separation and reliability were examined using the revised scale.
Ⅳ. Results
1. Psychometric Properties of the Original Personal Teaching Efficacy Scale
(with 13 Items)
1) Dimensionality
Principal components analysis (PCA) of Rasch residuals was performed to examine dimensionality. The Rasch dimension explained 49.4% of the variance in the data. The eigenvalue for the unexplained variance in the first contrast was 1.99. If the first contrast has a strength greater than 2, multidimensionality can be assumed. Because the first contrast of our analysis was almost 2.0, the existence of a second dimension in the items seemed likely (Linacre, 2012). Moreover, we examined the mean square (MNSQ) statistical values of each item. Infit and outfit MNSQ values of 1.0 are ideal, and values between 0.6 and 1.4 are acceptable for the Likert scale items (Bond & Fox, 2001). Values greater than 1.4 indicate a misfit of items (a lack of construct homogeneity with other items), whereas items with less than 0.6 are regarded as redundancy items. Infit (weighted) is sensitive to “unexpected behavior affecting responses to items near the person's measure level,” whereas outfit is sensitive to “unexpected behavior by persons on items far from the person’s measure level [outliers]” (Linacre, 2012, p. 316). Eleven items indicated good data fit values within a 0.6 and 1.4 range; however, the MNSQs of two items (SE_2 and SE_10) were larger than 1.4 (see Table Ⅳ-1). The two items might be related to another construct, which supports the existence of the second dimension.
<Table Ⅳ-1> Parameter Values for a Personal Teaching Efficacy Scale with 13 Items
Item Statement Difficulty Infit Outfit
SE_1 I will continually find better ways to teach mathematics. -1.22 0.89 0.9 SE_2 Even if I try very hard, I will not teach mathematics as
well as I will most subjects. -0.16 1.64 1.8 SE_3 I know how to teach mathematics concepts effectively. 0.12 0.63 0.69 SE_4 I will not be very effective in monitoring mathematics
activities. 0.5 0.75 0.82
SE_5 I will generally teach mathematics ineffectively. -0.37 0.63 0.6 SE_6 I understand mathematics concepts well enough to be
effective in teaching elementary mathematics. -0.82 0.79 0.8 SE_7 I will find it difficult to use manipulatives to explain to
students why mathematics works. -0.1 0.75 0.77 SE_8 I will typically be able to answer students’ questions. -1.3 0.98 0.96 SE_9 I wonder if I will have the necessary skills to teach
mathematics. 0.68 0.87 0.96
SE_10 Given a choice, I will not invite the principal to evaluate
my mathematics teaching. 2.14 2.16 2.3
SE_11
When a student has difficulty understanding a mathematical concept, I will usually be at a loss as to
know how to help the student understand it better.
0.45 0.73 0.71
SE_12 When teaching mathematics, I will usually welcome
student questions. -0.61 1.19 1.25
SE_13 I do not know what to do to turn students on to
mathematics. 0.7 0.89 0.93
Note. The two bolded items indicate items with infit and outfit statistics larger than 1.4.
2) Category use
The optimal number of response categories was determined using four criteria: category frequencies, average measure, category fit, and threshold (Bond & Fox, 2001). First, for the category frequencies, each category should have at least 10 responses, and responses should be distributed across the categories. As indicated in Table Ⅳ-2, each category frequency was greater than the minimum number of 10 responses. However, the lowest category frequency was 107 responses (category 1, at 3%), which indicated category 1 was rarely used by the participants. Second, for the average measures, numbers should increase monotonically from the lowest category to the highest category. The term “average measures” refers to the “average of the ability estimates for all persons in the sample who chose that particular response category” (Bond & Fox, 2001, p. 162). The analysis result revealed the average measures increased monotonically according to the scale category label; the average measures were -0.71, -0.39, 0.35, 1.35, and 2.53
for categories 1 to 5, respectively. Third, for the category fit, the infit and outfit MNSQs should be less than 2.0 logits. The analysis of each category satisfied the criterion of the MNSQ, except in category 1. The outfit MNSQ of category 1 was 2.13 logits, indicating category 1 did not contribute to measuring the latent trait and diminishing precision (Van Zile-Tamsen, 2017). Fourth, the threshold (or step calibration) was examined. Threshold refers to the estimated difficulty of choosing one response category over other categories (Bond & Fox, 2001), and each threshold should increase monotonically from the lowest category to the highest category. Moreover, it is recommended that the threshold distance between adjacent categories is greater than 1.4 and less than 5.0 logits. Although the threshold estimates of our data were monotonically ordered (with logits -2.16, -0.52, 0.1, and 2.57 for categories 2 through 4, respectively), the threshold distance between categories 3 and 4 was too small (0.42 logits). Thus, the use of the five-category of original scale should be revised to make an appropriate distinction between categories.
<Table Ⅳ-2> Response Category Fit Statistics with 13 Items
Category Observed Count
Average
Measure Infit Outfit Threshold
Threshold Distance 1 107 (3%) -0.71 1.6 2.13 NONE -2 428 (11%) -0.39 0.94 0.96 -2.16 2.16 3 771 (20%) 0.35 0.81 0.79 -0.52 1.64 4 1693 (44%) 1.35 0.92 0.96 0.1 0.42 5 874 (23%) 2.53 1.03 1.02 2.57 2.47
Note. The bolded numbers indicated inappropriate category use of the original scale.
3) Difficulty level
To examine the appropriateness of the difficulty level for the sample, personal trait and item difficulty parameters were placed on the same metric using logits. Figure Ⅳ-1 (variable map) shows the item location of all 13 items and personal locations for individual participants. If sufficient overlap existed between a distribution of personal traits and item difficulty levels, we could conclude the scale is appropriate for measuring the sample (Bond & Fox, 2001; Hong et al., 2005). The left and right sides of the axis illustrate personal trait levels and item difficulty levels, respectively. Each “#” refers to four teachers, and each “.” refers to a range of one to three teachers. The higher numbers on the logit scale indicate difficult items for teachers to endorse, and the lower numbers indicate easy items for teachers to endorse. For example, item SE_10 was the most difficult item for teachers to endorse, with a score of 2.14 logits. Item 8 was the easiest item to endorse, with a score of -1.3 logits. However, most items in the sample were easy to endorse. The mean of personal trait levels was significantly higher than the mean of item difficulty levels (see M in Figure Ⅳ-1). In particular, the logits of two items (SE_1 and SE_8) were lower than the lowest logits of personal trait levels, which indicated the items could not contribute to differentiating mathematics teachers’ personal teaching efficacy.
[Figure Ⅳ-1]. Person–Item Variable Map with 13 Items.
Note. Each “#” represents four teachers, and each “.” represents one to three teachers. M, S, and T refer to mean, 1 standard deviation (SD), and 2 SD, respectively.
2. Psychometric Properties of the Revised Personal Teaching Efficacy Scale
(with Eight Items)
Based on the Rasch analysis of the original personal teaching efficacy scale, we combined categories 1 and 2 and rescored values from “12345” to “11234,” which consisted of four response options (Bond & Fox, 2001). Moreover, we deleted items SE_2 and SE_10, which had larger infit and outfit logits than the cutoff value of 1.4, and items SE_1 and SE_8, which had lower logits than the lowest logits of personal trait levels. However, the results of the following analysis show the infit and outfit MNSQs of item SE_12 were greater than 1.4 logits (1.5 for infit and 1.74 for outfit). Thus, we also deleted item SE_12 and implemented the second follow-up Rasch analysis with the remaining eight items.
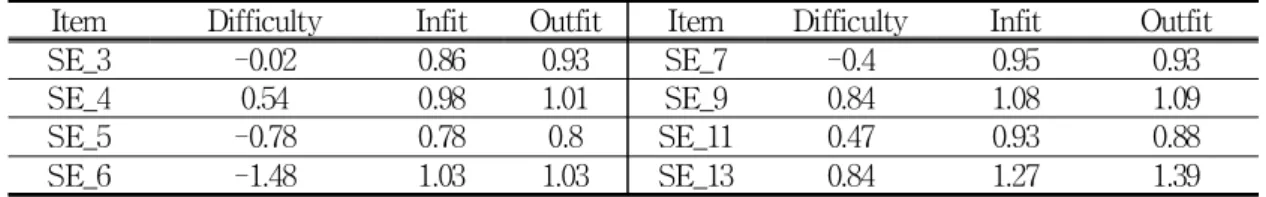
The PCA results showed the revised scale had unidimensionality. The eigenvalue for the unexplained variance in the first contrast was 1.52, which met the cutoff value of 2.0 (Linacre, 2012). Moreover, the infit and outfit MNSQ values of all items were between 0.6 and 1.4 (see Table Ⅳ-3).
<Table Ⅳ-3> Parameter Values for a Personal Teaching Efficacy Scale with Eight Items
Item Difficulty Infit Outfit Item Difficulty Infit Outfit
SE_3 -0.02 0.86 0.93 SE_7 -0.4 0.95 0.93
SE_4 0.54 0.98 1.01 SE_9 0.84 1.08 1.09
SE_5 -0.78 0.78 0.8 SE_11 0.47 0.93 0.88
SE_6 -1.48 1.03 1.03 SE_13 0.84 1.27 1.39
Regarding the analysis of category use, average measures and thresholds monotonically increased according to the order of categories (see Table Ⅳ-4). Furthermore, infit and outfit MNSQ values of each category were less than 2.0. The highest infit and outfit MNSQs were 1.18 and 1.29, respectively. The threshold distance ranged from 1.35 to 3.45, which almost met the suggested criteria of values between 1.4 and 5.0 (Bond & Fox, 2001). Aligned with these results, the corresponding probability curves represented that each curve formed a peak above the other curves at some point along the x-axis (see Figure Ⅳ-2).
<Table Ⅳ-4> Response Category Fit Statistics with Eight Items
Category Observed Count
Average
Measure Infit Outfit Threshold
Threshold Distance 1 304(13%) -1.97 1.18 1.29 NONE – 2 576(24%) -0.92 0.81 0.77 -2.05 2.05 3 1064(45%) 0.73 0.87 0.94 -0.7 1.35 4 438(18%) 2.64 1.09 1.04 2.75 3.45
[Figure Ⅳ-2]. Probability Curves of Response Categories. Note. Each curve represented a category from 1 to 4.
respondent. Most samples were clustered between -2 and 2 logits. Moreover, seven out of eight items were located between -1 and 1 logits. That is, considerable overlap occurred between personal trait and item difficulty levels compared to the previous person–item variable map (see Figure Ⅳ-1). However, it would be better to include more challenging items in the scale to capture a wider range of teachers’ personal teaching efficacy.
[Figure Ⅳ-3]. Person–Item Variable Map with Eight Items. Note. Each “#” represents three teachers, and each “.” represents one or two teachers.
The reliability of the revised scale was examined using item separation and reliability as well as person separation and reliability of Rasch model (Bond & Fox, 2001; Linacre, 2012). Item separation and reliability estimates represent how well the item estimates are remaining stable in a new sample. An item separation index of at least 3.0 coupled with at least 0.90 reliability indicates the items’ hierarchical structure would be stable in a new sample. Person separation and reliability indicate how well a new sample can be classified (or differentiated) according to the latent trait being measured. A separation index of at least 2.0 coupled with at least 0.80 reliability indicates the stability of the classification (Linacre, 2012). From the Rasch analysis with the
current data, an item separation index of 7.64 coupled with 0.98 reliability and person separation index of 2.41 coupled with 0.85 reliability met the suggested cutoff values.
Ⅴ. Conclusion and Discussion
Researchers have emphasized the influence of teachers’ self-efficacy beliefs on teacher and student outcomes (Bandura, 1997; Tschannen-Moran & Woolfolk Hoy, 2001). It is imperative to accurately measure teachers’ self-efficacy beliefs for teaching mathematics to help teachers develop a high level of self-efficacy beliefs. Previous scales for measuring Korean elementary school teachers’ self-efficacy beliefs for teaching mathematics did not have conceptual clarity and lacked information about item difficulties (e.g., Kim & Kang, 2015). Therefore, our study verified the psychometric properties of personal teaching efficacy of the MTEBI and revised the scale for the use of Korean elementary school teachers. Specifically, we used a Rasch analysis to achieve this goal. Rasch analysis has been widely used to evaluate the psychometric properties of the scale (Linacre, 2012). Because Rasch analysis converts raw scores into a logarithm, it helps researchers examine item difficulty and personal ability estimates on the same metric by using logits. This process is impossible in CTT (Bond & Fox, 2001).
We examined personal teaching efficacy scales by focusing on dimensionality, category use, and item difficulty. The Rasch analysis using the original personal teaching efficacy scale (with 13 items) revealed several problems in its psychometric properties. First, the results showed the existence of a second dimension. The eigenvalue for the unexplained variance in the first contrast was almost 2.0, and infit and outfit MNSQs of two items (SE_2 and SE_10) were larger than 1.4 (Linacre, 2012). Second, the five-category format was insufficient to distinguish responses from the sample. Category 1 was rarely used by the sample participants (3%), and the outfit MNSQ of category 1 was higher than the cutoff value of 2.0 (2.13 logits). Moreover, the threshold distance between categories 3 and 4 was too small (0.42 logits). Third, the item difficulty level was not appropriate for the sample. The mean of the personal trait levels was significantly higher than the mean of the item difficulty levels, and the logits of two items (SE_1 and SE_8) were lower than the lowest logits of the personal trait levels.
Based on these results, we combined categories 1 and 2 and deleted four items (SE_1, SE_2, SE_8, and SE_10). Then, we implemented a follow-up analysis. However, because the infit and outfit MNSQs of item SE_12 were greater than 1.4 logits, we deleted that item and implemented a second follow-up analysis. The revised scale with eight items had appropriate psychometric properties. The scale had a unidimensionality, and the four categories were sufficient to differentiate the responses from the sample. Moreover, there was sufficient overlap between the distribution of personal trait and item difficulty levels, and the infit and outfit MNSQs of all eight items had values between 0.6 and 1.4. Finally, item separation and reliability as well as personal separation and reliability all satisfied the suggested cutoffs (Bond & Fox, 2001; Linacre, 2012).
of the Korean version of MTEBI (Enochs et al., 2000) using the Rasch analysis model. Inspection of the scale revealed that the scale is skewed and could not accurately discriminate Korean elementary teachers’ efficacy beliefs for teaching mathematics. Although the original personal teaching efficacy scale of MTEBI contained 13 items, some of them were too easy to use for Korean elementary school teachers. This difference might be explained by two reasons: examining different participants and using different statistical methods. Because Enochs et al. examined preservice teachers who have minimal teaching experience, likely, their participants could not accurately report their mathematics teaching efficacy beliefs.
Furthermore, we used the Rasch model analysis to examine the psychometric properties of the instrument, whereas Enochs et al. used factor analysis, thereby ignoring the difficulty of each item and assuming all items to be equal. Based on these findings, in the current study we claim that additional revisions should be made to more accurately capture Korean elementary school teachers’ self-efficacy beliefs for teaching mathematics. In particular, it would be better to include additional, more challenging items in the scale to capture a broader range of teachers’ personal teaching efficacy beliefs. Furthermore, the item order might be revised from the MTEBI to represent the increase in item difficulty that teachers believe they can endorse easily or with difficulty (Bandura, 2006). For example, given the higher item difficulty of item SE_4 than items SE_5, SE_6, and SE_7, item SE_4 might be moved to the latter part of the scale.
Previous scholars measuring Korean elementary teachers’ mathematics teaching efficacy scale developed their own scales and included items related to student outcome expectancy and mathematics problem-solving efficacy beliefs. Thus, some researchers reported two factors (e.g., Kim & Shin, 2017) and others reported more than five factors (e.g., Kim & Kang, 2015) concerning elementary teachers’ efficacy beliefs for teaching mathematics. Because we only examined personal teaching efficacy beliefs of MTEBI, we cannot directly compare the findings of the present study with them. On the surface, our results appear to be in contrast with those previous studies because we only found one factor. However, other authors also report one factor of personal teaching efficacy beliefs. For example, Kim and Shin (2017) found two factors of teachers’ mathematics teaching efficacy beliefs: efficacy beliefs about personal mathematics teaching and mathematics problem-solving. That is, though researchers have used different factor structures to develop a scale of elementary teachers’ mathematics teaching efficacy scale, they also found that personal teaching efficacy beliefs are a distinctive one factor. In sum, it seems reasonable to view that teachers’ beliefs in their capability to successfully execute a specific behavior in mathematics classrooms (i.e., personal teaching efficacy beliefs) is one factor.
Meanwhile, in contrast to previous scholars who used factor analysis, the value of the current study is in using the Rasch model analysis to identify the factor structure of a mathematics teaching efficacy scale. In this process, we could consider misfit items, item difficulty, and personal ability, which were ignored in the previous studies and reduced weight of the items in the test to better estimate the latent construct of the scale. Given that many researchers have used survey methods to collect data and analyze educational phenomena, it is critical to developing an accurate scale to increase our understanding of them. As described in our study, using the Rasch model analysis might provide new insight into the previously used scale. Therefore,
researchers should reexamine the validity and reliability of previous scales using the Rasch model analysis before administering the survey to participants. Moreover, researchers who develop a new scale may use the Rasch model to examine the psychometric properties of the scale.
The present study has several limitations. First, participants of the study numbered fewer than 300 teachers and were selected using convenience sampling. That is, the participants were selected from a group of teachers easy to contact, this study’s findings cannot be generalized to represent the self-efficacy beliefs of all Korean elementary school teachers. Second, it is possible that participant responses were influenced by social desirability factors because each participant self-reported their self-efficacy. Additional research is needed with new samples to verify the study’s findings using a revised personal teaching efficacy scale.
Despite these limitations, this study contributes to our understanding of the personal teaching efficacy of the MTEBI and helps us revise the scale for measuring Korean elementary school teachers’ self-efficacy beliefs for teaching mathematics. The examination of the construct with the Rasch model strengthened the validity and reliability of the revised scale. Researchers could use the revised scale to understand and measure elementary teachers’ self-efficacy beliefs for teaching mathematics.
References
Alkhateeb, H. M. (2004). Internal consistency reliability and validity of the Arabic translation of the mathematics teaching efficacy beliefs instrument. Psychological Reports, 94(3), 833-838. Bagaka, J. G. (2011). The role of teacher characteristics and practices on upper secondary school
students’ mathematics self-efficacy in Nyanza province of Kenya: A multilevel analysis. International Journal of Science and Mathematics Education, 9(4), 817-842.
Bandura, A. (1997). Self-efficacy: The exercise of control. New York, NY: W. H. Freeman & Company.
Bandura, A. (2006). Guide for constructing self-efficacy scales. In F. Pajares & T. Urdan (Eds.), Self-efficacy beliefs of adolescents (pp. 307-337). Charlotte, NC: Information Age.
Bond, T. G., & Fox, C. M. (2001). Applying the Rasch model: Fundamental measurement in the human sciences. Mahwah, NJ: Lawrence Erlbaum Associates Publishers.
Bruce, C. D., & Ross, J. A. (2008). A model for increasing reform implementation and teacher efficacy: Teacher peer coaching in grades 3 and 6 mathematics. Canadian Journal of Education, 31, 346–370.
Cho, S. H., Park, S. W., & Hwang, H. Y. (2014). Analysis of the current situation of affective characteristics of Korean students based on the results of PISA and TIMSS. Journal of the Korean School Mathematics Society, 17(1), 23-43.
Charalambous, C. Y., & Philippou, G. N. (2010). Teachers’ concerns and efficacy beliefs about implementing a mathematics curriculum reform: Integrating two lines of inquiry. Educational Studies in Mathematics, 75(1), 1-21.
Crocker, L., & Algina, J. (2008). Introduction to classical and modern test theory. Mason, OH: Cengage Learning.
Dofková, R., & Kvintová, J. (2018). Self-efficacy in pre-service teachers of mathematics: the development of a new testing instrument in the Czech Republic. In L. G. Chova, A. L. Martinez, & I. C. Torres (Eds.) 11th annual International Conference on Education and New Learning Technologies Conference Proceedings (pp. 3-12). Valencia.
Donnell, L. A., & Gettinger, M. (2015). Elementary school teachers' acceptability of school reform: Contribution of belief congruence, self-efficacy, and professional development. Teaching and Teacher Education, 51, 47-57.
Enochs, L. G., Smith, P. L., & Huinker, D. (2000). Establishing factorial validity of the mathematics teaching efficacy beliefs instrument. School Science and Mathematics, 100(4), 194-202.
Han, J. S., Park, H. B., & Lee, H. S. (2013). A Study on the effect of gifted students' self-efficacy, achievement motivation and academic achievement for mathematics prerequisite learning: Focused on the science education institute for the gifted, university. Journal of the Korean School Mathematics Society, 16(1), 87-112.
Head, C. F. (2012). Comparative analyses of mathematics teachers' efficacy using factor analysis and the Rasch Model. (Unpublished doctoral dissertation), Kennesaw State University.
Henson, R. K., Kogan, L. R., & Vacha-Haase, T. (2001). A reliability generalization study of the teacher efficacy scale and related instruments. Educational and Psychological Measurement, 61(3), 404-420.
Heo, Y. W., & Kim, S. Y. (2013). The effects of students’ mathematics learning achievements on elementary school teachers’ self-efficiency in math. School Mathematics. 15(2), 337-352. Hines, M. T. (2008). The interactive effects of race and teacher self-efficacy on the achievement
gap in school. International Electronic Journal for Leadership in Learning, 12(11), 1-11. Hong, S., Kim, B. S., & Wolfe, M. M. (2005). A psychometric revision of the European American
Values Scale for Asian Americans using the Rasch model. Measurement and Evaluation in Counseling and Development, 37(4), 194-207.
Kieftenbeld, V., Natesan, P., & Eddy, C. (2011). An item response theory analysis of the mathematics teaching efficacy beliefs instrument. Journal of Psychoeducational Assessment, 29(5), 443-454.
Kim, J. H., & Kang, M. B. (2015). Analysis of elementary school teachers’ efficacy on mathematics teaching. Journal of Educational Research in Mathematics, 25(1), 75-93.
Kim, R. N., & Shin, H. G. (2017). Development and validation of mathematics teaching efficacy scale for South Korean elementary teachers. Journal of Elementary Mathematics Education in Korea, 21(3), 443-460.
Korean Educational Statistics Service. (2019). Statistical yearbook of education. Retrieved Sep. 14, from https://kess.kedi.re.kr/eng/
Koutsianou, A., & Emvalotis, A. (2019). Greek pre-service primary teachers' efficacy beliefs in science and mathematics teaching: Initial adaptation of the STEBI-B and MTEBI instruments. International Journal of Educational Methodology, 5(3), 375-385.
Linacre, J. M. (2012). Winsteps: Rasch measurement computer program user’s guide. Beaverton, Oregon: Winsteps.com.
Maguire, K. (2011). The role of teacher efficacy in student academic achievement in mathematics. (Unpublished doctoral dissertation), Walden University.
McGee, J. R., & Wang, C. (2014). Validity-supporting evidence of the self-efficacy for teaching mathematics instrument. Journal of Psychoeducational Assessment, 32(5), 390-403.
Ministry of Education. (2015). Mathematics curriculum: Ministry of Education Notice [supplement 8]. Seoul: Author.
National Council of Teachers of Mathematics. (2014). Principles to actions: Ensuring mathematical success for all. Reston, VA: Author.
Nie, Y., Tan, G. H., Liau, A. K., Lau, S., & Chua, B. L. (2013). The roles of teacher efficacy in instructional innovation: Its predictive relations to constructivist and didactic instruction. Educational Research for Policy and Practice, 12(1), 67-77.
Philippou, G. N., & Pantziara, M. (2015). Developments in mathematics teachers’ efficacy beliefs. In B. Pepin & B. Roesken-Winter (Eds.), From beliefs to dynamic affect systems in mathematics education (pp. 95–117). Cham: Springer International Publisher
Rang, D. H. (2007). Reliability and validity of Korean translated mathematics teaching efficacy beliefs inventory. The Mathematics Education, 46(3), 263-272.
Siegle, D., & McCoach, D. B. (2007). Increasing student mathematics self-efficacy through teacher training. Journal of Advanced Academics, 18(2), 278-312.
Smith, J. P., III. (1996). Efficacy and teaching mathematics by telling: A challenge for reform. Journal for Research in Mathematics Education, 27(4), 387-402.
Spillane, J. P. (2000). A fifth-grade teacher's reconstruction of mathematics and literacy teaching: Exploring interactions among identity, learning, and subject matter. The elementary school Journal, 100(4), 307-330.
Tschannen-Moran, M., & Woolfolk Hoy, A. (2001). Teacher efficacy: Capturing an elusive construct. Teaching and Teacher Education, 17(7), 783-805.
Van Zile-Tamsen, C. (2017). Using Rasch analysis to inform rating scale development. Research in Higher Education, 58(8), 922-933.
Ware, H., & Kitsantas, A. (2007). Teacher and collective efficacy beliefs as predictors of professional commitment. The Journal of Educational Research, 100(5), 303-310.
Woolfolk Hoy, A., & Davis, H. A. (2006). Teacher self-efficacy and its influence on the achievement of adolescents. In F. Pajares & T. Urdan (Eds.), Adolescence and education, Vol. 5: Self-efficacy and adolescence (pp. 117–137). Greenwich, CT: Information Age Publishing. Wright, B. D., & Masters, G. N. (1982). Raring scale analysis. Chicago, IL: MESA Press.