© Korean Powder Metallurgy Institute 808 -The decrease of the distance between particle centers due to the growth of the sinter necks can be explained by the well known two-particle model. Unfortunately this model fails to provide a comprehensive description of the processes for 3D specimens. Furthermore, there is a significant discrepancy between the calculated and the measured shrinkage because particle rearrangements are not considered. Only the recently developed analysis of the particle movements inside of 3D specimens using micro focus computed tomography (µCT), combined with photogrammetric image analysis, can deliver the necessary experimental data to improve existing sintering theories.
In this work, µCT analysis was applied to spherical copper powders. The specimens used consisted of air atomized copper powder (ECKA Granulate AK 0.1…0.125 mm). Specimens of 9,000…10,000 particles were prepared by filling the copper powder into aluminum oxide crucibles. Both a temperature series specimen (1) and a time series specimen (2) were analyzed with µCT. To fix the particles in their positions, the specimens were subjected to a pre-sintering step in a hydrogen atmosphere prior to the first analysis by micro focus computer tomography. The subsequently prepared sintering stages were frozen by cooling down the samples to room temperature. In addition a quasi in-situ temperature series was measured by synchrotron tomography. A furnace was attached to the tomography setup and the specimen temperature was
reduced by 100 K during the acquisition of the tomographic images to avoid blurring inflicted by the progressive particle movements.
In the first step of the image analysis, all particles in the specimen were identified. With the rough estimation of the position of the particle positions, accurate locations of surface points of the respective particle could be obtained, and by fitting a sphere function through the surface points, the accurate position of the particle center was determined. Furthermore, all particles could be easily tracked throughout the entire sintering process (0.5 % unidentified or not tracked particles), and all inter particle contacts could be determined.
In this study, we focus mainly on particle rotation. The rotation was determined by calculating the changes of angles in all particle triplets, which were connected after the pre-sintering step and after the sintering step of interest (i.e. the cumulative rotation was determined). To measure the contribution of the particle center approach to the sintering process as described by the two particle model, we calculated the distance between contacting particles. To exclude the edge effects all edge particles and 4 additional particle layers were excluded from the data analysis. To determine the local density within the neighborhood of a particle the volume of the Voronoii cells within the respective specimen region was divided by the volume of the particles within the region.
2006 POWDER METALLURGY World Congress
B06-07-1
*Invited
Analysis of Particle Rearrangement during Sintering by Micro Focus Computed
Tomography (µCT)
M. Nöthe1,a, M. Schulze2,b, R. Grupp1,c, B. Kieback1,d, A. Haibel3,e, and J. Banhart3,f 1
Institute of Material Science, Technische Universität Dresden, Germany
2
Institute of Photogrammetry and Remote Sensing, Technische Universität Dresden, Germany
3
Structural Research, Hahn-Meitner-Institut Berlin, Germany
a
michael.noethe@tu-dresden.de, bmatthias.schulze@tu-dresden.de, crainer.grupp@hmi.de,
d
bernd.kieback@ifam-dd.fraunhofer.de, ehaibel@hmi.de, fbanhart@hmi.de Abstract
The decrease of the distance between particle centers due to the growth of the sinter necks can be explained by the well known two-particle model. Unfortunately this model fails to provide a comprehensive description of the processes for 3D specimens. Furthermore, there is a significant discrepancy between the calculated and the measured shrinkage because particle rearrangements are not considered. Only the recently developed analysis of the particle movements inside of 3D specimens using micro focus computed tomography (µCT), combined with photogrammetric image analysis, can deliver the necessary experimental data to improve existing sintering theories. In this work, µCT analysis was applied to spherical copper powders. Based on photogrammetric image analysis, it is possible to determine the positions of all particle centers for tracking the particles over the entire sintering process and to follow the formation and breaking of the particle bonds. In this paper, we present an in-depth analysis of the obtained data. In the future, high resolution synchrotron radiation tomography will be utilized to obtain in-situ data and images of higher resolution.
© Korean Powder Metallurgy Institute 809
-The analysis of the average distance between next coordination partners and the sample density proved, that a continuous densification of the specimens occurs. Looking at the temperature series specimen, no particle center approach is observed below 900 °C. Thus, the observed densification below 900 °C is believed to be attributed to the cooperative material transport processes and the densification due to particle center approach as described by the two particle model can be ruled out. At higher temperatures, the contribution of the particle center approach can always be detected. In addition to the directly measured densification, the coordination number increases over the entire sintering process. This observation, along with the verification of new and broken contacts, means that particle rearrangements must occur.
Figure 1 shows the differential rotation (i.e. the change of angles in connected particle triplets between two subsequent sintering stages) in the temperature series specimen during the first and third sintering steps. In almost all stages of the sintering process, the differential rotation is smaller than the detection threshold for rotations. The differential rotation computed for the sintering step at 900 °C is plotted as a representative graph of the detection threshold of the measured rotations with respect to the local density. In regions with low local density, the detection threshold is roughly 0.9 °. It increases to values above 1.5 ° for regions with high density as in these regions the number of surface points applicable for the fit of the sphere model is much reduced. This results in less accurate determination of the particle center positions.
The first two sintering steps (600 °C and 700 °C) are the only sintering steps where rotations exceed the detection threshold for low local densities (However, the rotation during sintering at 700 °C is only marginally larger than the detection threshold). This means that during the first stages of sintering, extensive rotations occur and the driving force is significantly reduced. In regions with higher densities, the rotation is significantly inhibited by the need to push away particles in the optimal path of rotation (i.e. is effectively a counteracting force).
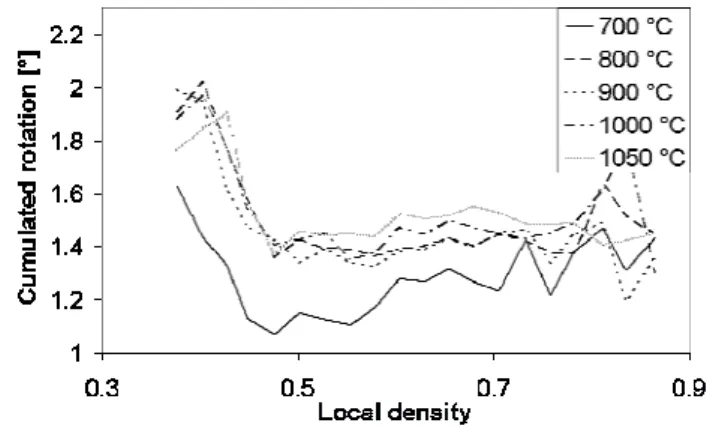
The high detection threshold can be overcome by the measurement of the cumulated rotations (i.e. the change of angles in connected particle triplets between the pre-sintered stage and the respective sintering stage). Figure 2 shows the particle rotation plotted versus the local density for the temperature series specimen. The observed cumulated rotation increases with the progress of the sintering process. In regions of low local density the cumulated rotation stagnates after the sintering step at 900 °C. This stagnation of the cumulated rotation coincides with the first detectable particle center approach. At this temperature, a diversification of the interparticle contact diameters can occur which can tip the balance of the forces inflicted by all coordination partners of a particle. The most extensive cumulated rotations are observed in regions with low local densities (below 50 %) as the counteracting inhibiting force (see above) is very low. In regions with
higher density the driving force is not reduced. So it is only natural to see a slight increase in rotations in regions with higher densities during the last sintering steps. In the time series specimen a continuous rotation was observed. The largest rotations were observed in regions with low local densities as there were inhibiting forces in regions with high local density.
We recently performed our first successful quasi in-situ synchrotron tomography measurements. It is possible to see particle movements and we expect to complete the image analysis in time to present the data on PM2006.
Fig. 1. Differential rotation of the temperature series sample vs. the local density.
Fig. 2. Cumulated rotations in specimen 1 vs. local density.