A Study on the Evaluation of Valve Leak Rates Using Acoustic Emission Technique
Sang-Guk Lee,a Jun-Shin Lee,a Sun-Ki Lee,a Seok-Man Shon,a Wook-Ryun Lee,a Tae-Ryong Kim,a Yong-JaeLim,b Kee-Young Choo b
a Korea Electric Power Research Institute, Nuclear Power Research Lab., 103-16 Munji-Dong, Yuseong-Gu, Daejeon, 305-380, Korea
b Hana Evertech Co., Research Lab., 907 Sunil Technopia Bld., 440 Sangdaewon-Dong, Jungwon-Gu, Seongnam-Shi,Gyeonggi-Do, 462-120, Korea
1. Introduction
The objective of this study is to estimate the feasibility of acoustic emission method for the internal leak from the valves. In this study, two types of valve(a 3 1/2 inch glove valve for 600 psi steam and a 4 inch ball valve water ) leak tests using three different leak path and numerous leak rates were performed in order to analyze acoustic emission properties when leaks arise in valve seat. As a result of leak test for specimens simulated valve seat, we conformed that leak sound amplitude increased in proportion to the increase of leak rate, and leak rates were plotted versus peak acoustic amplitudes recorded within those two narrow frequency bands on each spectral plot. The resulting plots of leak rate versus peak acoustic amplitude were the primary basis for determining the feasibility of quantifying leak acoustically. The large amount of data collected also allowed a grief investigation of the effects of different leak paths, leakage rates, pressure differentials and transducers on the acoustic amplitude spectra. From the experimental results, it was suggested that the acoustic emission method for monitoring of leak was feasible.
2. Methods and Results
2.1 Steam Valve Investigation
A used 3 in. globe valve was procured and installed in a test stand. The valve was found to be leaking and was not modified internally. Flexible hoses were added to isolate the test stand from external structure-borne sources.
The test stand was supplied with saturated steam at a nominal pressure of 600 psi, through a flexible hose which isolated the test stand from noise in the supply line, A comparison of acoustic signatures immediately upstream and downstream from the flexible hoses confirmed the effectiveness of the hoses in isolating the steam valve test stand from noise in the steam supply line, which had high steam flow rates, valving, etc., for other tests, Without the hoses, it was impossible to detect an acoustic signal from a leak of less than 37ml per min of condensate but with the hoses installed, leak rates as low as 0.03ml per min of condensate were observed acoustically. A 6ft length of pipe, terminating at a blank flange, was attached to the downstream side
of the test valve to more closely model the acoustic characteristics of the valve installed in a piping system.
A graph of leak rate versus the peak acoustic emission amplitude of the averaged spectra is shown in Figure 4. The highest acoustic emission amplitudes occurring in the frequency band of 45 to 50 kHz were used in this plot. All of the data were recorded with the transducer located at the top of the upstream valve flange. Temperatures and pressures shown adjacent to the data points to which they pertain refer to upstream temperatures and pressures.
Curves of the general form
log y = a + b log x
where x equals acoustic amplitude, and y equals leak rate, were fitted to the data points plotted in Figure 1. it shows 35 to 45 kHz in a frequency range .
Compared to similar curves fitted to high pressure air valve data, the standard deviations of the steam valve data are fairly large. The number of steam valve data points is smaller by at least an order of magnitude than the number of comparable high pressure air valve data points, principally because of the difficulty, as previously noted, in controlling the leakage rate, Also, the data were not all recorded at the same temperatures and pressures. The attainable precision of any instrument to be developed is difficult to determine at present. Some factors yet to be considered include pressure and temperature effects, valve construction, leak path variations(i.e., valve defects or damage such as warped or wire-draw seats, etc.), and multiple measurements at similar leak rates.
2.2 Water Valve Investigation
A used, 4 in. ball valve of the type found in Naval shipboard seawater systems was procured and installed in a test stand. the test stand was normally operated in an open loop configuration with a tap water source, however for some tests (e.g., with degassed water) it was necessary to recirculate the water in a closed loop. For some tests, a clear plastic blank flange was used to replace the pipe downstream of the test valve to permit visual observation of the flow, bubble entrainment, air pocket formation, and so on. Tests were run on a variety of valve ball and seat combinations and conditions.
Transactions of the Korean Nuclear Society Autumn Meeting Busan, Korea, October 27-28, 2005
The differential pressures across the valve were in the range of 5 to 8 psi. It was noted that there were several types of acoustic emission that were apparently unrelated to leakage rate.
Figure 1. Acoustic emission amplitude versus leak rate in steam globe valve
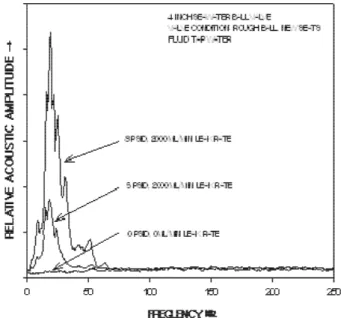
it was hypothesized and tentatively confirmed that some of the observed acoustic emission was due to air coming out of solution and that some was related to the existence of air pockets in the leakage flow path immediately downstream from the ball of the test valve. Other acoustic emission resembled random whistles and periodic clicks. Figure 2 is a plot of acoustic amplitude versus frequency for three differential pressures across the test valve. Leakage of approximately 2000 ml per min was obtained using the rough ball with new seats in the test valve. The transducer was attached to the valve flange and data were collected with the signal averager and x-y plotter. The data show that under the test conditions there is an adequate signal-to-noise ratio only below frequencies of about 75 kHz.
The figure also shows a strong increase of acoustic emission amplitude with increasing differential pressure at similar leak rates. This suggests that the use of higher differential pressures might produce acoustic signals related to leak rate that are stronger than the observed signal fluctuations not related to leak rate. This corresponds to a previous observation that the 5 to 7 psi range is threshold of differential pressure for acoustic leak detection. Most of the investigation was restricted to low differential pressures across the valve because in practical applications higher differential pressures are difficult and costly to obtain.
The data in figure 2 are typical of the acoustic emission signature associated with leakage through large ball valves. There was found to be a poor correlation between the amplitude of this signature and leakage rate at constant pressure even for a single valve. When the valve was cycled (opened and then re-shut) the leakage rate and the signature both changed, but the changes were not consistent with each other.
Figure 2. Typical spectra of acoustic emission amplitude from leakage through a 4 in. seawater ball valve, showing strong dependence of amplitude on pressure.
3. Conclusion
Experimental data reported herein show that there are detectable acoustic signals associated with hydraulic, steam, and high-pressure air valve leakage, and that the signals increase with increasing leakage rate. Some evidence exists to suggest that acoustic measurement of hydraulic valve leak rates of less than 10 ml per min might be feasible. This will require a better understanding of the air release upon depressurization of hydraulic fluid. The detection of hydraulic leaks above the 10 ml per min threshold is immediately attainable, and the acoustic emission seems to be localized well enough that it is feasible to acoustically identify the leaking valve in a manifold of several hydraulic valves mounted together.
REFERENCES
[1] Morse, P. M., and K. U. Ingard., Theoretical Acoustics. McGraw Hill, 1968.
[2] Boguslavski, Y. Y.; Ioffee, A. I. and Naugol'nykh, K. A., Sound Radiation by a Cavitation Zone, Sov. Physics, Acoustics, 16, No.1, p17-20, 1970.
[3] Harrison, M., An Experimental Study of Single Bubble Cavitation Noise, J. Acoust. Soc. Am. 24, No.6, p 776-82, 1952.
[4] Fitzpatrick, H. M., and Strassberg, M., Hydrodynamic Sources of Sound, Proc. Symposium on Naval Hydrodynamics, U.S. Natl. Acad. Sci. Natl. Research Council Pub. 515, 1957.
[5] Flynn, H. G., Physics of Acoustic Cavitation in Liquids, Physical Acoustics. Vol IB, Ed. by W. P. Mason. New York: Academic Press, 1964.