1. 서 론
일반적으로 경사식호안, 중력식 케이슨 호안, 강관시트
파일, 셀식 등이 해상폐기물매립장 건설에 이용되고 있는
데 각 방식에 따라 적용되는 차수방법도 서로 다르다(Park
et al., 2016; Hwang et al., 2018, 2019a).
경사식호안의
경우 사석을 사용하여 비교적 경제적으로 시공이 가능하
지만, 해상폐기물매립장의 사석 마운드의 투수 조건을 확
보하기 위하여 중간보호층과 2중 차수시트(HDPE sheet)
를 측면차수에 적용이 필수적 요건이다.
경사식호안 해상폐기물매립장에 대한 몇몇 연구가 지금
까지 진행되었다. 대표적으로 Oh et al.(2016)는 차수관련
비정상류 조건에서 경사식호안매립장에 대한 침투이류 분산해석
Seepage-Advection-Dispersion Numerical Analysis of Offshore
Rubble Mound Revetment Landfill Under Transient Flow
황웅기
1, 김향은
2, 김태형
3*
Woong-Ki Hwang
1, Hyang-Eun Kim
2, Tae-Hyung Kim
3*
1Nonmember, Manager, Geo R&D Co., Ltd., 60 Centum jungang-ro, Haeundae-gu, Busan 48059, Republic of Korea 2Nonmember, Director, Geo R&D Co., Ltd., 60 Centum jungang-ro, Haeundae-gu, Busan 48059, Republic of Korea
3Member, Professor, Dept. of Civil Engrg., Korea Maritime and Ocean Univ., 727 Taejoung-ro, Yeongdo-gu, Busan 49112, Republic of Korea
ABSTRACT
This study analyzes contaminant movement under transient flow in a rubble mound revetment offshore waste landfill barrier system that prevents contaminant runoff. The barrier system consists of bottom layer and side barrier. For the bottom layer system, impermeable clay layer is used. For the side barrier system, the HDPE barrier sheet (primary element) plays the main role, and the intermediate protection layer (supplementary element) is responsible for the barrier. Seepage, advection, dispersion numerical analysis was carried out using SEEP / W and CTRAN / W programs. As a result, under abnormal conditions considering the fluctuation in tidal range, the volume and direction of the flow velocity vector of the pore water change with time and the dispersion concentration of the contaminant changes. When comparing the case of 2 m tidal range and 8 m tidal range, the larger the tide value, the higher the concentration of contaminant under abnormal conditions. It was found that the rate of change of the concentration of the contaminant changed depending on the change in the tidal range, and as a result, the outflow of the pollutant was smaller than that in the steady flow state.
요 지
본 연구는 비정상류 조건에서 오염원 유출을 방지하기 위한 경사식호안 해상폐기물매립장 차수시스템에서 오염원의 이동을 알아보기 위하여 해석을 수행하였다. 차수시스템은 바닥과 측면으로 구성하였다. 바닥차수시스템은 불투수 점토층이 측면차수 시스템은 HDPE 차수시트가 주 역할을 하고 부수적으로 중간보호층이 차수를 담당한다. SEEP/W와 CTRAN/W 프로그램을 이용하여 침투・이류 분산 해석을 실시하였다. 해석결과, 조석에 따른 수위변동을 고려한 비정상류 조건 하 에서의 전수두, 간극수의 유속벡터가 시간에 따라 크기 및 방향이 바뀌고 오염원 분산 농도가 변화하였다. 조석차 2m일 경우와 8m일 경우를 비교하면 조차가 클수록 비정상류조건에서의 오염물의 농도가 증가하였다. 오염원 농도 변화율이 조석의 변화에 따라 오염원 농도 변화율 기울기의 변화되어 결과적으로 오염원 유출이 정상류 상태에 비하여 작은 것으로 나타났다.
Keywords : Offshore landfill, Bottom layer, HDPE sheet, Transient flow, Tidal range
한국지반신소재학회논문집 제19권 4호 2020년 12월 pp. 1 ∼ 9 J. Korean Geosynthetics Society Vol.19 No.4 December 2020 pp. 1 ~ 9
DOI: https://doi.org/10.12814/jkgss.2020.19.4.001 ISSN: 2508-2876(Print) ISSN: 2287-9528(Online)
Received 9 Aug. 2020, Revised 27 Sep. 2020, Accepted 9 Oct. 2020
*Corresponding author
Tel: +82-51-410-4465; Fax: +82-51-410-4460 E-mail address: [email protected] (T.-H. Kim)
경사식호안 해상폐기물매립장에 사용되는 차수시트 설치
길이에 따른 침투거동을 정상류 조건에서 분석하여 적정 차
수시트 연장 길이를 제시하였다. Hwang et al.(2019b) 연구
에서 정상류 조건에서 침투뿐만 아니라 이류 분산해석을 실
시하여 50년 경과에 대하여 사석마운드 경사식호안 해상폐
기물매립장의 차수시스템의 성능에 대하여 평가하였다.
Hwang et al.(2019b)
연구 결과에서 제시된 가장 합리
적인 바닥차수시스템의 최소투수계수는 1×10
-6cm/s,
이때
필요한 최소 바닥의 두께는 384cm 이상 이라 하였다. 차
수시트의 바닥차수시스템의 두께를 500cm, 투수계수를
1×10
-6cm/s,
차수시트의 투수계수를 1×10
-11cm/s
로 고정
하고 해석한 결과, 차수시트 연장 길이는 1m 이상에서 변
화 차이가 미비하여 1m 이상만 설치되면 차수시트의 역할
이 충분함을 밝혔다. 그리고 중간보호층 재료의 투수계수
가 1×10
-4cm/s
인 경우, 오염원이동이 거의 없는 것으로 나
타나 차수시트에 어떤 손상이 생긴 경우라도 오염원의 침
투・이류 분산 정도를 감소시킬 수 있음을 언급하였다.
Oh et al.(2016)
과 Hwang et al.(2019b)의 기존 연구는
정상류 조건으로 해상폐기물매립장의 차수와 관련된 검토
를 실시하였는데, 사실 해상폐기물매립장은 그 입지적 특
성상 조석의 영향을 받으므로 폐기물매립장 주변 지층 내
의 흐름은 비정상류 흐름이 발생되고 그에 따라 차수시스
템내의 오염물 농도가 시간에 따라 변화한다. 해상폐기물
매립장내의 경우 오염원 유출을 방지하고자 관리수위를
일반적으로 해역의 평균 수위보다 낮게 유지하는 게 원칙
이나, 조석차가 큰 해역의 경우 해역의 평균수위가 매립장
의 관리수위보다 낮게 형성되는 현상이 발생된다. 또한 조
석 운동의 특성 상 반복되므로 영향을 받게 된다. 그러므
로 해상 폐기물매립장의 경우 육상 폐기물매립장과 달리
폐기물 내 오염물의 이동을 분석할 때 조석차의 영향을 반
영할 필요가 있다(Hwang et al., 2019a; Park et al., 2006).
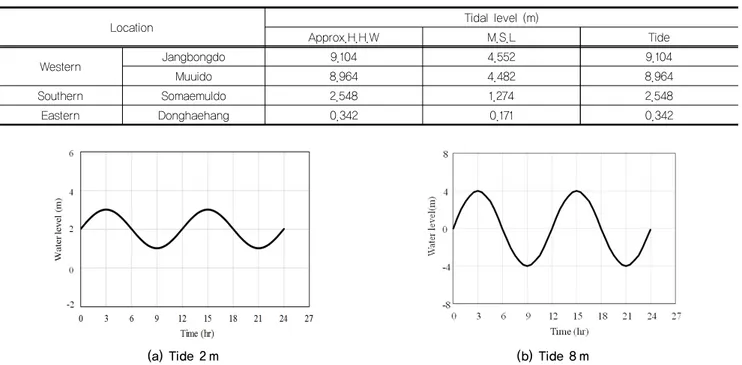
Table 1
은 우리나라의 조석변동에 대한 일부 자료로 Oh
et al.(2012)
이 해상폐기물매립장의 건설입지 분석을 위하여
조사한 것이다. 수도권 폐기물을 처리하기에 가장 적합한
서해안 지역은 장봉도과 무의도 전면이 언급되었다. 참고로
남해안과 동해안은 경남 통영의 소매물도와 동해항의 조석
을 표에 같이 나타내었다. 우리나라의 경우 조석차는 서해
9.0m
내외, 남해 2.6m 내외, 동해 0.4m 내외로 지역별로 편
차가 매우 크다. 만약 해상폐기물 매립장이 조석의 영향권
내에 있는 경우 오염원의 이동은 중요한 문제가 될 수 있다.
본 연구는 Hwang et al.(2019b)연구의 연장으로 조석차
를 고려한 비정상류 조건에서 침투이류 분산을 고려한 해
석을 수행하였다. 연구 결과 조석차에 의한 오염원 이동과
정상류조건과 비교 분석되었다. Table 1의 자료를 참고하
여 조석에 의한 해역의 수위 변동은 2.0m와 8.0m 두 가지
경우(1m와 4m인 sin파로 가정)에 대하여 검토하였다(Fig. 1).
폐기물매립장 내부는 관리수위는 평균해수면과 동일한 것
으로 가정하고 해석하였다.
Table 1. Representative tidal level at the western, southern and eastern coast of Korea (Oh et al., 2012)
Location Approx.H.H.W Tidal level (m)M.S.L Tide
Western JangbongdoMuuido 8.9649.104 4.4824.552 8.9649.104
Southern Somaemuldo 2.548 1.274 2.548
Eastern Donghaehang 0.342 0.171 0.342
(a) Tide 2 m(b) Tide 8 m Fig. 1. Hypothetical sinusoidal tide level with two tidal range of 2 m and 8 m
2. 침투・이류 분산 기본 개념 및 해석
2.1 기본 개념
침투는 동수구배에 의해 물이 지반 내 간극을 통해 이동
하는 현상으로 전수두가 높은 곳에서 낮은 곳으로 발생하
는 물의 이동이다. 이류란 물에 녹은 오염물이 물과 함께
이동하는 현상이다. 즉 이류는 침투와 함께 발생된다. 분
산에 의한 오염물 이동은 유속의 불균질성에 의하여 오염
물이 퍼져 나가는 현상이다. 침투와 이류 및 분산은 복합
적으로 발생되는 현상으로 차수 부분의 투수성이 높은 경
우에는 이류의 영향이 상대적으로 크고, 투수성이 낮아 침
투유속이 느린 경우 분산의 영향이 상대적으로 큰 영향을
미치는 것으로 알려져 있다(Devlin and Parker, 1996;
Neville and Andrews, 2006).
2.2 해석프로그램
본 해석에서는 SEEP/W 및 CTRAN/W를 사용하였다.
SEEP/W
는 정상상태해석(steady-state analysis) 및 비정상
상태해석(transient-state analysis)을 수행 할 수 있다.
SEEP/W
에 이용된 2차원 연속체로 가정한 포화・불포화
지반에서의 간극수 흐름 및 간극수압 분포에 대한 지배방
정식은 식 (1)과 같다(GEO-SLOPE, 2012a).
(1)
여기서,
는 전수두[L],
는 수평방향 투수계수[LT-1],
는 연직방향 투수계수[LT-1],
는 단위체적, 단위시간 당
소스항[T-1],
는 체적함수비[-],
는 시간[T]을 각각 나타
낸다.
CTRAN/W
는 다공질 지반을 통한 오염물의 이동을 모
사하기 위한 프로그램으로 침투에 의한 이류, 오염물 농도
차 및 지반의 역학적 특성에 따른 분산을 고려할 수 있다.
CTRAN/W
는 간극수 내에 녹아있는 오염물의 이동을 계
산하기 위하여 SEEP/W로부터 계산된 지반내 유속장을
이용하였다(Hwang et al., 2018). CTRAN/W에 이용된 지
반내 오염물 이동에 대한 지배방정식은 식 (2)와 같다
(GEO-SLOPE, 2012b).
(2)
여기서,
는 체적함수비[-],
는 오염물의 농도[ML-3],
는 흙의 건조단위밀도[ML-3],
는 흡착비[-],
는 시간[T],
는 분자확산계수[L2T-1],
는 Darcy의 유속[LT-1],
는 방사능 물질의 붕괴계수[T-1]를 각각 나타낸다.
식 (2)의 좌변은 오염물의 농도 변화에 따른 유체 및 흙
입자 내에 저장된 오염물의 양을 나타낸다. 우변의 첫 번
째 항은 분산에 의한 오염물 이동을, 두 번째 항은 이류에
의한 오염물 이동을, 세 번째 항과 네 번째 항은 각각 유체
및 흙입자 내에서 붕괴된 오염물의 질량손실을 각각 나타
낸다.
2.3 해석 모델
해석단면 Fig. 2(b)는 일본 다치바나만 해상폐기물매립
장에 적용된 경사식호안 단면인 Fig. 3(a)를 참고하여 모
델화한 것이다(Chae et al., 2011; Kwon et al., 2012; Oh
et al., 2016; Osaka Bay Regional Offshore Environmental
Improvement Center, 2018).
검토단면으로 참고한 다치바
나만 해상매립장은 경사식호안의 법면에 2중의 차수시트
를 설치하고 각 시트 사이에 중간보호층(Mid-protection
layer)
을 두어 차수시트의 손상을 최소화시킨 사례이다.
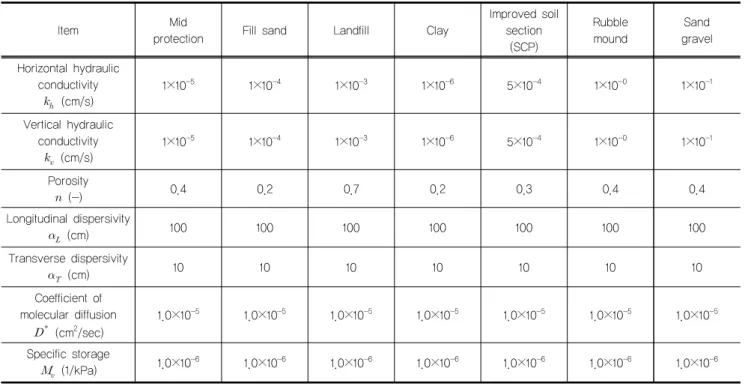
2.4 물성치 및 해석 조건
경사식호안 폐기물매립장 해석 모델의 침투・이류 분산
해석에 이용된 각 재료 물성치는 Table 2와 같다. 비정상
류 해석에서는 파라메타 조정이 무의미하므로 정상류 해
석에서 변수 조정을 통해 산정된 값을 적용하였다. 점토
(
바닥차수재)의 투수계수 정상류 해석에서 산정된 최적성
능에 해당되는 정수인 1×10
-6cm/s
를 적용하였다. 중간보
호층 역시 차수시트 손상시 파라메타를 조정하여 산정된
1×10
-5cm/s
값을 사용하였다. 기타 재료 물성치는 해상 폐
기물매립장의 침투・이류 분산 해석에 대한 연구문헌에 제
시된 값을 반영하였다(Kwon et al., 2012). 분자확산계수
는 1.0×10
-5cm
2/s
를 적용하였다. 유해물질의 상대농도는
폐기물층은 C = 1.0, 해역은 C = 0으로 자유 유출경계로
하였다. 건전한 차수시트의 투수계수는 1.6×10
-11cm/s
로
하였다(Kwon et al., 2012).
(a) Cross section at Tachabana Bay Offshore waste landfill
(b) Numerical model
Fig. 2. (a) Cross section at Tachabana Bay Offshore waste landfill and (b) Numerical model of contaminant transport analysis in rubble mound revetment waste landfill (Hwang et al., 2019b)
Table 2. Material properties of each soil and structure element (Kwon et al., 2012)
Item protectionMid Fill sand Landfill Clay Improved soil section (SCP)
Rubble
mound gravelSand Horizontal hydraulic conductivity (cm/s) 1×10⁻⁵ 1×10⁻⁴ 1×10⁻³ 1×10⁻⁶ 5×10⁻⁴ 1×10-0 1×10⁻¹ Vertical hydraulic conductivity (cm/s) 1×10⁻⁵ 1×10⁻⁴ 1×10⁻³ 1×10⁻⁶ 5×10⁻⁴ 1×10-0 1×10⁻¹ Porosity (-) 0.4 0.2 0.7 0.2 0.3 0.4 0.4 Longitudinal dispersivity (cm) 100 100 100 100 100 100 100 Transverse dispersivity (cm) 1 0 1 0 1 0 1 0 1 0 1 0 1 0 Coefficient of molecular diffusion (cm2/sec) 1.0×10 -5 1.0×10⁻⁵ 1.0×10⁻⁵ 1.0×10⁻⁵ 1.0×10⁻⁵ 1.0×10⁻⁵ 1.0×10⁻⁵ Specific storage (1/kPa) 1.0×10 -6 1.0×10⁻⁶ 1.0×10⁻⁶ 1.0×10⁻⁶ 1.0×10⁻⁶ 1.0×10⁻⁶ 1.0×10⁻⁶
해석 시 폐기물매립장 내부는 관리수위는 평균수위와
동일한 것으로 간주하였고, 계산간격은 초기 5일은 1시간
간격으로 하고, 이후에는 3시간 간격으로 360일 총 1년 동
안에 대하여 해석을 수행하였다.
3. 해석 결과 및 분석
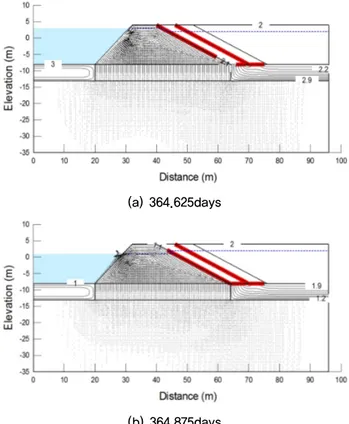
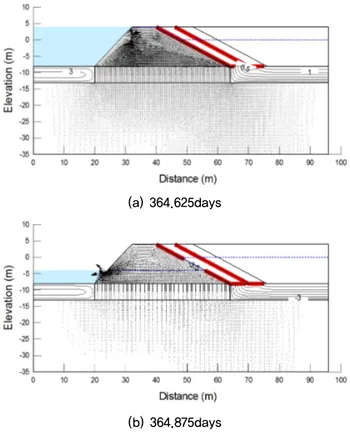
3.1 전수두분포와 유속벡터
Figs. 3
∼6은 각각 조석에 따른 수위변동을 고려한 비정
상류 조건 하에서의 전수두 분포 및 간극수의 유속벡터를
나타낸다. 수위 변동에 따라 지반내 간극수 흐름이 시간에
따라 크기 및 방향이 바뀐다. 해역의 수위가 폐기물매립장
의 관리수위보다 높은 경우 해역에서 폐기물매립장 내부
로의 간극수 흐름이 발생하였다.
예상한 바와 같이 최고고조위시 조석차 2m인 경우보다
8m
인 경우 해역에서 폐기물매립장 내부로의 유속벡터 및
간극수 흐름차이가 더욱 큰 것으로 나타났다. 최저저조위
시에는 폐기물매립장 내부에서 해역으로의 간극수 흐름이
발생하는데, 8m인 경우 흐름이 더욱 크게 나타났다. 해역
(a) 364.625days (b) 364.875daysFig. 4. Predicted plots of flow vectors at the last two specific times under transient flow in rubble mound revetment landfill (case of maximal tidal range of 2 m)
(a) 364.625days
(b) 364.875days
Fig. 5. Predicted plots of total head at the last two specific times under transient flow in rubble mound revetment landfill (case of maximal tidal range of 8 m)
(a) 364.625days
(b) 364.875days
Fig. 3. Predicted plots of total head at the last two specific times under transient flow in rubble mound revetment landfill (case of maximal tidal range of 2 m)
과 폐기물매립장 내부 수위가 동일할 경우에는 조석차 2m
인 경우 유속벡터 및 간극수 흐름 차이가 크지 않았으나,
8m
인 경우에는 최고고조위에서 수위가 낮아질 경우 내부
에서 해역으로의 간극수 흐름 차이가 큰 것으로 나타났고,
최저저조위에서 수위가 높아져 같아지면 유속벡터 및 간
극수 흐름 차이가 거의 나지 않았다. 그러므로 조석차 8m
인 경우 해역 수두차이가 크게 되므로 간극수 흐름차이도
크고 이에 따른 유속벡터도 큼을 알 수 있다.
3.2 오염물 농도 변화
Fig. 7
은 차수시트 차수시스템에서 폐기물 지층의 방향
으로 약 1m 떨어진 바닥 차수시스템 상부 표면 부근에서
의 시간에 따른 오염물 농도 변화를 나타내기 위한 각 노
드의 위치를 나타낸다. 각 노드 A, B, C, D는 상부에서
하부로 순서대로 상부가 A 하부가 D를 나타낸다.
Fig. 8
과 Fig. 9는 조석차 2m일 경우의 각각 정상류 조
건과 조석 변동을 고려한 비정상류 조건에서의 각 노드별
시간에 따른 오염물 농도 변화이다. 그림에서처럼 조석 변
동을 고려한 비정상류 조건보다 정상류 조건 하에서 오염
Fig. 7. Four monitoring nodes of contaminant concentration in rubble mound revetment landfill
Fig. 8. Time history of contaminant concentration at four monitoring nodes under steady flow considering water level difference of 2m between sea and landfill sides
Fig. 9. Time history of contaminant concentration at four monitoring nodes under transient flow considering maximal tidal range of 2 m
(a) 364.625days
(b) 364.875days
Fig. 6. Predicted plots of flow vectors at the last two specific times under transient flow in rubble mound revetment landfill (case of maximal tidal range of 8 m)
물의 농도가 증가된다.
Fig. 10
과 Fig. 11은 조석차 8m일 경우의 각각 정상류
조건과 조석 변동을 고려한 비정상류 조건에서의 각 노드
별 시간에 따른 오염물 농도 변화이다. 조석차 8m일 경우
에도 2m와 동일하게 비정상류 조건보다 정상류 조건 하에
서 오염물의 농도가 증가한다. 이것은 일정한 수두차를 가
지고 흐름이 형성되는 정상류상태가 주기적으로 변화되는
조석에 의한 비정상류 상태보다 매립장에서 오염원 이동
성능평가에서 불리한 조건임을 알 수 있다.
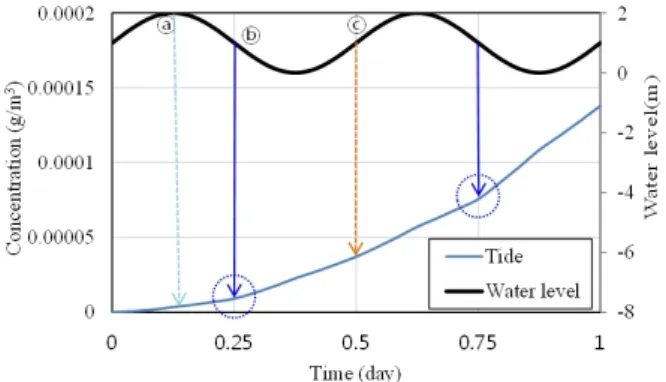
Fig. 12
와 Fig. 13에서는 오염물 농도 증가량 변동이 큰
초기 1.0일 기간만 확대하여 정상류 및 비정상류 조건을
좀 더 자세히 비교하였다. ⓐ는 약최고고조위(Approx.H.H.W),
ⓑ는 약최고고조위에서 약최저저조위로 수위가 내려갈 때
의 평균해수면(M.S.L)이며, ⓒ의 경우 약최저저조위에서
약최고고조위로 수위가 상승할때의 평균해수면(M.S.L)이
다. 정상류 상태에서는 변동없이 동일한 기울기로 증가하
는 것으로 나타났다(Hwang et al., 2019b). 하지만 비정상
류 상태에서는 기울기의 변화가 있다. 그리고 비정상류 상
태에서 오염물 농도가 확산이 더디게 나타나는 구간은 약
최저저조위로 수위가 하강할 때(ⓑ 상태)로 나타났고, 약
최저저조위에서 약최고고조위로 수위가 상승할 때(ⓒ 상
태)는 오염물 농도가 증가한다.
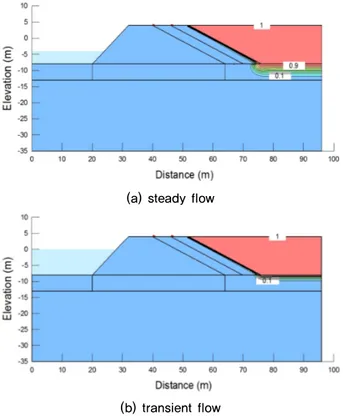
Fig. 14
와 Fig. 15는 정상류 조건 및 비정상류 조건에서
의 1년 후 오염물 농도 분포이다. 조석차 2m일 경우와 8m
일 경우를 비교하면 조차가 클수록 정상류뿐만 아니라 비
정상류 조건에서의 오염물의 농도가 증가한다. 그리고 비
정상류 조건 하에서보다 정상류 조건에서 차수시스템의
차수성능을 평가하는 것이 더욱 보수적인 결과로 보인다.
이것은 Rubin and Rabideau(2000)과 Foose(2010)의 연구
결과와 일치하는 것으로 일반적으로 정상류상태를 가정한
매립장 차수시스템의 성능 평가가 보수적이다. 더욱이 해
상최종처리장내의 경우 관리수위를 해역의 평균 수위보다
낮게 유지하는 게 원칙이므로 실제 현장에서의 오염물 이
동은 정상류 조건 하에서의 해석된 결과보다 훨씬 작게 발
생할 것으로 판단된다.
Fig. 10. Time history of contaminant concentration at four monitoring nodes under steady flow considering water level difference of 8m between sea and landfill sides
Fig. 11. Time history of contaminant concentration at four monitoring nodes under transient flow considering maximal tidal range of 8 m
Fig. 12. Comparison of time history of contaminant concentration between steady and transient flow during initial 1 day at Node A (case of maximal tidal range of 2 m)
Fig. 13. Comparison of time history of contaminant concentration between steady and transient flow during initial 1 day at Node A (case of maximal tidal range of 8 m)
4. 결 론
본 연구에서는 경사식호안 해상 폐기물매립장에서의
비정상류 조건에서(조석 2m 및 8m)에서 오염물의 누출을
알아보기 위하여 매립장의 측면 및 바닥차수시스템에 대
하여 1년 경과에 대한 침투・이류 분산 수치해석을 수행하
였다. 그 결과를 정리하면 다음과 같다.
(1)
조석에 따른 수위변동을 고려한 비정상류 조건 하 에
서의 전수두, 간극수의 유속벡터가 시간에 따라 크기
및 방향이 바뀌고 오염원 분산 농도도 변화된다.
(2)
조석차 2m일 경우와 8m일 경우를 비교하면 조석차가
클수록 비정상류조건에서의 오염물의 농도가 증가한다.
(3)
오염원 농도 변화율이 정상류 상태에서는 일정하게
동일한 기울기로 증가하나 비정상류 상태에서는 조석
의 변화에 따라 농도 변화율 기울기가 변화하여 오염
원 유출이 정상류 상태에 비하여 작다.
(4)
정상류 조건 하에서 차수시스템의 차수성능을 평가하
는 것이 비정상류 조건 보다 오염원 이동이 큰 것으로
나타나 정상류 조건에서 산정된 기준을 적용하는 것
이 타당하다.
References
1. Chae, K. S., Lee, S. P. and Oh, M. H. (2011), “Design and construction technology of marine waste landfill sites”, Journal of the Korean Civil Engineering and Textile Society, Vol.10, No.4, pp.16-24.
2. Devlin, J. F. and Parker, B. L. (1996), “Optimum hydraulic conductivity to limit contaminant flux through cutoff walls”, Groundwater, Vol.34, No.4, pp.719-726.
3. Foose, G.J. 2010. A steady-state approach for evaluating the impact of solute transport through composite liners on groundwater quality. Waste Management, Vol.30, No.8-9, pp.1577-1586.
4. GEO-SLOPE (2012a), Seepage modeling with SEEP/W, GEOSLOPE International Ltd.
5. GEO-SLOPE (2012b), Contaminant modeling with CTRAN/W, GEO-SLOPE International Ltd.
6. Hwang, W. K., Kim, H. E. Choi, H. adn Kim, H. E. (2019b), “Seepage-advection-dispersion numerical analysis of barrier system of offshore rubble mound revetment landfill Under Steady Flow”, Journal of Korean Geosynthetics Society, Vol.18, No.4, pp.1-10.
7. Hwang, W. K., Kim, H. E. Choi, H. and Kim, H. E. (2019a), “Proper regulation of the cutoff system in offshore landfill built on clay ground with double walls”, Journal of the Korean Geotechnical Society, Vol.35, No.8, pp.5-15. (a) steady flow
(b) transient flow
Fig. 14. Contour plots of contaminant concentration after 1 yr. (case of maximal tidal range of 2 m)
(a) steady flow
(b) transient flow
Fig. 15. Contour plots of contaminant concentration after 1 yr. (case of maximal tidal range of 8 m)
8. Hwang, W. K., Oh, M. H., Kim, T. H. and Kim, H. E. (2018), “Evaluation of optimal performance of hydraulic barriers in offshore landfill using seepage-advection-dispersion analysis under steady state flow”, Journal of Korean Society of Coastal and Ocean Engineers, Vol.30, No.2, pp.61-68 9. Kwon, O. S., Oh, M. H. and Chae, K. S. (2012), Guidelines
for the design, construction, and management of managed wastes reclaimed embankment, CIR publishing, Seoul, Korea. 10. Neville, C. J. and Andrews, C. B. (2006), “Containment
criterion for contaminant isolation by cutoff Walls”, Ground-water, Vol.44, No.5, pp.682-686.
11. Oh, M. H., Kwon, O. S., Kim, G. H. and Chae, K. S. (2012), “Introduction on offshore waste landfill and potential sites”, Journal of the Korean Civil Engineering Society, Vol.160, No.11, pp.40-48.
12. Oh, M. H., Park, H. Y., and Kwon, O. S. (2016), “Analysis on Seepage Behavior According to Extended length of HDPE
Sheet of Rubble Mound Revetment at Offshore Landfill”, Journal of the Korean Geosynthetics Society, Vol.15, No.3, pp.39-47.
13. Osaka Bay Regional Offshore Environmental Improvement Center (2018), Osaka Bay Phoenix Project, Osaka : Osaka Bay Regional Offshore Environmental Improvement Center. 14. Park, H. Y., Oh, M. H. and Kwon, O. S., 2016. Analysis on
Contaminant Transport according to the Embedded Depth of Vertical Barrier of Offshore Landfill. Journal of the Korean Geo-Environmental Society, 78(9); 29-37.
15. Park, J.-O., Song, M.-Y. and Park, C.-H. (2006), “Analyses of Correlation Between Groundwater Movement and Tidal Effect in West Costal Landfill Area”, The Journal of Eng-ineering Geology, Vol.16, No.3, pp.293-300.
16. Rubin, H. & Rabideau, A.J. 2000. Approximate evaluation of contaminant transport through vertical barriers. Journal of Contaminant Hydrology, Vol.40, No.4, pp.311-333.