Informatics Journal of Environmental Informatics 25(2) 99-116 (2015)
www.iseis.org/jei
On the Detection and Monitoring of the Transport of an Asian Dust Storm Using
Multi-sensor Satellite Remote Sensing
H. El-Askary1,2,3, S. K. Park4,5,6,7,*, M. H. Ahn5,6, A. Prasad2, and M. Kafatos1,2
1Schmid College of Science and Technology, Chapman University, Orange, CA 92866, USA 2
Center of Excellence in Earth Observing, Chapman University, Orange, CA 92866, USA 3Department of Environmental Sciences, Alexandria University, Moharem Bek, Alexandria 21522, Egypt 4Department of Environmental Science and Engineering, Ewha Womans University, Seoul 120-750, Korea
5
Department of Atmospheric Science and Engineering, Ewha Womans University, Seoul 120-750, Korea 6Severe Storm Research Center, Ewha Womans University, Seoul 120-750, Korea
7Center for Climate/Environment Change Prediction Research, Ewha Womans University, Seoul 120-750, Korea
Received July 20, 2013; revised November 30, 2014; accepted March 13, 2015; published online May 1, 2015
ABSTRACT. Dynamical and physical features of a long range transported dust event originating in China affecting Korea early March 2008 are examined using an integrative multi-sensor and multi-algorithm approach. Aerosol loadings and their size mode were analyzed over both ocean and land surfaces using the Moderate Resolution Imaging Spectroradiometer (MODIS) aerosol optical depth (AOD), employing standard dark target (DT) and deep blue (DB) algorithms, and the Ångström exponent (AE). Anthropogenic absorbing aerosols and smoke were found to be significant over the Indochina Peninsula, the Philippines and southern China, while a mixture of dust and pollution were predominant over central to northern China, as identified by the AE analysis and the Multi-angle Imaging SpectroRadiometer (MISR) spherecitiy and plume height. Remarkable aerosol absorptions in both the near ultraviolet (UV) and the visible were spread over central, central western and northern China, probably due to aerosol mixtures including desert dust and industrial pollution as well as smoke from biomass burning as evidenced from the Ozone Monitoring Instrument (OMI). Long range transport is validated as dust storm reached up to 4–5 km vertically and a mixed cloud layer was identified over the Yellow Sea as disclosed by the vertical structure of dust aerosols as well as observed aerosols subtypes from Cloud-Aerosol Lidar and Infrared Pathfinder Satellite Observation (CALIPSO). The real time detection and monitoring of the dust outbreak and its subsequent evolution are available through the infrared optical depth index (IODI), developed from the MTSAT-1R geostationary satellite imager.
Keywords: Asian dust storm, anthropogenic aerosols, aerosol optical depth, Ångström exponent, multi-sensor satellite remote sensing
1. Introduction
Sand-dust storm (SDS) refers to a strong windstorm that blows up a large amount of sand particles and dust into the atmosphere (Zhao, 1993). It is a hazardous phenomenon that brings about low visibility, usually less than 1 km, and often serious health problems (Chen et al., 2004; Yang et al., 2005; Hong et al., 2010). Holmes (2001) estimated that 1 million Chinese people died each year from the airborne dust. In re- cent years the Sahara and western China are recognized as the strongest sources of SDSs globally (Goudie, 2009).
SDS also serves as conveyance media of natural mine- rals and anthropogenic pollutants (Liu et al., 2006; Yan et al., 2011; Kim et al., 2012), potentially inducing climate change
*Corresponding author. Tel.: +82 2 32773331 ; fax: +82 2 32773275.
E-mail address: [email protected] (S. K. Park).
ISSN: 1726-2135 print/1684-8799 online
© 2015 ISEIS All rights reserved. doi: 10.3808/jei.201500306
(Miller and Tegen, 1998; Zhuang et al., 2001; Qian et al., 2002) and deteriorating ecosystems (Shinn et al., 2000; Ga- rrison et al., 2003; Tan and Shi, 2012). Dust loadings may affect the global environment in many ways by changing, for example, atmospheric radiation balance (Slingo et al., 2006; Prasad et al., 2007), cloud formation (Toon, 2003; Koehler et al., 2007), convection activity (Stephens et al., 2004; Gong et al., 2010), atmospheric carbon monoxide and sulphur dioxide levels (Adams et al., 2005; Bhattacharjee et al., 2007), bio- geochemical cycles (Zhang et al., 2010), and tropical cyclone activity (Evan et al., 2006; Sun et al., 2008). Whether SDSs bring about cooling or warming largely depends upon the number/size distribution of the mineral particle population (Fouquart et al., 1987), and cloud cover and the albedo of the underlying surface (Nicholson, 2000). SDSs may also affect climate by altering marine primary productivity (Jickells et al., 1998) and by causing ocean cooling (Schollaert and Merrill, 1998). Changes in atmospheric/oceanic temperatures and in concentrations of aerosol that may serve as cloud condensa- tion nuclei can affect convection activity and cloud forma- tion/development; thus changing rainfall amounts (Bryson
and Barreis, 1967; Maley, 1982). Dust deposition over land surfaces may affect soil formation (Yaalon and Ganor, 1973; Vine, 1987) and delivery of sediments to the oceans (Guer- zoni et al., 1999).
In East Asia, most countries encounter serious prob- lems in human health, transportation and industry caused by Asian dust storm (ADS), called Hwangsa in Korea, Huangsha in China and Kosa in Japan – all representing yellow sand (Yamamoto, 2007). Wang et al. (2004) reported that most ADSs in China originate from three geographic areas inclu- ding the Hexi Corridor and western Inner Mongolia Plateau, the Taklimakan Desert, and the central Inner Mongolia Pla- teau. The northeastern plain of China (i.e., Manchuria) is con- sidered to be another important source region of ADS that often affects Korea seriously (Chun et al., 2001; Kim et al., 2010). Dust aerosols and minerals associated with ADS even- ts in East Asia can be transported via long-range transport to downstream regions, including Taiwan, Hong Kong, the Yel- low Sea, the East/South China Sea (Fang et al., 1999; Lin et al., 2004; Lin et al., 2007; Yang et al., 2010), Korea (Chun et al., 2001), Japan and the East Sea/Sea of Japan (Matsuki et al., 2003). The long-range transport even reaches the North Pa- cific and the western coast of North America (Husar et al., 2001).
The ADS events are strongly correlated with spring cy- clones, mean winter temperature and geographic conditions (Wang et al., 2004). Shao and Dong (2006) noted that severe dust storms over the Gobi region were mostly caused by cold air outbreaks associated with intense low-pressure systems, while those in Hexi Corridor were often caused by intense frontal systems induced by large-scale synoptic pattern and topological effects. Based on synoptic analyses of the spring and winter ADSs, originated from the main source regions in China then affected Korea, Chun et al. (2001) inferred that dust emissions tend to favor high surface winds and baroclinic instability at 1.5 km level, with a strong wind belt at 5 km level expediting dust transport. Not only the strong winds but also the land surface condition is strongly related to the ADS outbreaks (Kim and Kai, 2007; Kimura, 2012).
To cope with problems associated with SDSs, it is essen- tial to have routine monitoring and prediction at both global and regional scales. Satellite remote sensing is expedient in monitoring various aspects of dust storms in both space and time (e.g., King et al., 1999; El-Askary et al., 2003, 2004, 2006; Shao and Dong, 2006; Li et al., 2007; Xu et al., 2011). Near-daily global dust aerosol data retrieved from satellite instruments have been used to locate natural sources over arid and semiarid regions. Retrieval methods have been proposed in different ways based on the characteristics of the sensor bands, e.g., infrared (Legrand et al., 2001; Schepanski et al., 2007) or near-ultraviolet (Prospero et al., 2002). However, using a single wavelength aerosol property has some draw- backs (Ginoux et al., 2010): 1) difficulty to detect dust among other aerosols in the areas of complex aerosol composition, especially caused by vigorous human activity; and 2) diffi- culty to distinguish freshly emitted dust from aged dust. Until recently, satellite algorithms have seldom provided near-glo-
bal daily distribution of aerosol properties at multiple wave- lengths with sufficiently high spatial resolution to detect an- thropogenic dust sources. In these days, synergistic methods are applied to detect and monitor SDSs using multi-temporal and/or multi-sensor approaches (e.g., El-Askary et al., 2003, 2006; Huang et al., 2007; Tsolmon et al., 2008; Sanwlani et al., 2011). In some other applications, both satellite and surface observations were combined to analyze extreme smoke and dust events (e.g., Falke et al., 2001; Prasad and Singh, 2007; Marey et al., 2010), to identify dust storm source areas (Washington et al., 2003), and to categorize dust weather ty- pes (Lin et al., 2011).
The multi-sensor approach has been applied to the dete- ction and monitoring of SDSs in various regions, including the Nile delta (El-Askary et al., 2003; Prasad et al., 2010; Marey et al., 2011) and the Indo-Gangetic basin (El-Askary et al., 2006; Prasad et al., 2006; Prasad and Singh, 2007). El- Askary et al. (2003, 2006) investigated the dust particle pro- perties at different wavelengths and found the usefulness of combined optical and microwave sensing in dust storm detec- tion. Huang et al. (2007) integrated visible, infrared and mi- crowave satellite data to detect dust storms over northwestern China. Here visible and infrared measurements were utilized
todescribethecloud-freedustsystems, while microwave mea-
surements were used to detect the dust storm underneath ice clouds. They insisted that using the visible-infrared radiance alone was nearly useless to detect dust storms under cirrus areas, thus providing insufficient information on ADSs which were mostly associated with intense frontal systems including cirrus clouds.
The overall objective of the proposed research is to gain a comprehensive understanding of the aerosol sources, pro- perties, and their transport and impact over Korea. This has been achieved namely by characterizing transport pathways of pollution, smoke and dust aerosols to the region under study and by establishing their relative contributions. The proposed study is important and timely, thanks to the wealth of data from the NASA and other agencies satellites, the ground- based measurements, and a number of currently available so- phisticated global and regional models. Although our app- roach has been tested with just one case of ADS, this study will provide a guidance of operational application of multi- sensor/multi-algorithm remote sensing technique in ADS fore- casts.
We applied an integrated approach discussed in section 2 to a severe ADS case of 1 ~ 3 March 2008, which originated in a desert area in China and was transported to Korea. It is quite common in research to address a single event based on intensity, transport or importance with in-depth analyses. For example, Iwasaka et al. (1983) studied the spatial structure and transport path of a case dust-storm event of 14 ~ 15 April 1979 using simultaneous measurement by lidar and geosyn- chronous meteorological satellite. Fan et al. (1996) analyzed aerosol particles collected in China and Japan in the same spring ADS event in 1991, spanning from 29 April to 1 May, to study the change in composition of mineral aerosol parti- cles during long-range transport. Chan et al. (2005) performed
a modeling study on a large Australian dust storm case of 23 October 2002 to assess the impacts of rural dust upon the air quality of four cities. Tan and Shi (2012) examined biotic res- ponse to natural fertilization caused by dust deposition with an ADS event of 30 ~ 31 March 2007. There had been several other studies that demonstrated usefulness of satellite remote sensing data by employing just a single case of dust storm (e.g., Retails and Nikitopoulou, 2006; Li et al., 2007; San- wlani et al., 2011).
2. Technical Approach and Methodology
In this research we utilized an integrated approach co- llecting aerosol measurements from a number of sensors on low-earth-orbiting satellites to detect dust clouds in a severe ADS, which include: the Moderate-resolution Imaging Spe- ctro-radiometer (MODIS) twin sensors aboard the Terra and Aqua satellites, the Multi-angle Imaging Spectro-radiometer (MISR) instrument on Terra, the Ozone Monitoring Instru- ment (OMI) on the Aura satellite, the Cloud-Aerosol Lidar with Orthogonal Polarization (CALIOP) sensor on the C- loud-Aerosol Lidar and Infrared Pathfinder Satellite Obser- vation (CALIPSO) satellite. Data from a geostationary me- teorological satellite, the Multi-functional Transport Satellite (MTSAT) especially from the MTSAT-1R, are also employ- ed for real time detection and monitoring. Physical proper- ties of the case dust storm derived from each instrument are discussed in terms of detection, quantification and vertical
structure.Wealsousedsynopticandnumerical analyses to dis-
cuss dynamic and synoptic features of weather systems asso- ciated with the case ADS. Such an integrated approach, com- bining multiple sensors/algorithms and synoptic/numerical meteorological analyses may improve the accuracy of opera- tional ADS forecasting.
MODIS provides information on aerosol coverages/loa- dings through aerosol optical depth and on anthropogenic aerosols via Ångström exponent. MISR gives the plume hei- ght and wind information. OMI brings the properties of ab- sorbing aerosols using the aerosol absorption optical depth and the aerosol extinction optical depth. From CALIPSO, the vertical structure of dust and anthropogenic aerosols are dis- played. A real time monitoring of dust outbreak and transport- tation is available through continuous observation by MTSAT- 1R. In the following subsections, the essential attributes of the principal sources of satellite data and products used in this research and the adopted approach are described in details with a summary presented in Table 1.
2.1. MODIS/Terra and MODIS/Aqua
MODIS observes the Earth over both land (Kaufman et al., 1997) and ocean (Tanré et al., 1997). Each instrument sees a 2330 km wide swath, providing daily global coverage, albeit with narrow gaps between swaths in the tropical region. The combination of MODIS on Terra (10:30 am Equator overpass) and Aqua (1:30 pm Equator overpass) provides complete dai- ly coverage with adequate overlaps. The MODIS instruments
provide a number of validated aerosol products that include aerosol optical depth (AOD) over water and over land (Remer et al., 2005; Levy et al., 2010). AOD is a measure of the opa- queness of air, with high values indicating poor visibility. The AOD uncertainty is ±0.05 (±0.15 × AOD) over land and ±0.03 (±0.05 × AOD) over the ocean. Uncertainty in the monthly ave- rage fine fraction aerosol optical depth is ±20% (Remer et al., 2005). Two algorithms are used for aerosol retrieval from MODIS over land. One of them is referred to as the Dark Tar- get (DT) algorithm at near-infrared wavelengths (2.1 and 3.8 µm), applied over dark surfaces such as thickly vegetated land surfaces with global expected uncertainty of ±(0.05 + 0.15) (Remer et al., 2005; Levy et al., 2007, 2010) and thus does not capture the aerosol loading over bright surfaces (e.g., desert). The other, known as the Deep Blue (DB) algorithm, is applied over bright surfaces such as deserts and other arid land sur- faces by incorporating two blue channels (0.412 and 0.470 µm), with uncertainties reported to be around 25 ~ 30% (Hsu et al., 2004, 2006). Ginoux et al. (2010) were able to identify anthropogenic and natural dust sources using the MODIS DB algorithm along with the land use data.
In this study, the MODIS Terra AOD (Level-3 collec-
tion 5.1) at 1 resolution and the MODIS Aqua AOD and DB
AOD (Level-3, collection 5.1) at 1° resolution are utilized. AODs in two adjacent wavelengths can be used to derive another useful parameter, Ångström exponent (AE), which depends on the wavelength of the AOD (Prasad et al., 2007; El-Askary et al., 2009). It is derived from the ratio between
ln(τ1/τ2) and ln(λ2/λ1), for given spectral band wavelengths λ1
and λ2 and their corresponding AODs τ1 and τ2 (Ångström,
1961). AE can be calculated from multiple wavelengths, and describes the mode of aerosol size distribution differentiating between fine and coarse particles (Lin et al., 2011). MISR’s
retrievalsoftencomplementtheMODIS aerosol coverage over
the ocean at view angles where the solar geometry causes sun glint, where MODIS does not currently retrieve aerosols. 2.2. MISR/Terra
MISR swath width is about 380 km and its operational aerosol retrievals are performed at 17.6 km horizontal reso- lution, and particle size, shape and single-scattering albedo are retrieved, in addition to AOD (Martonchik et al., 2002, 2004, 2009). A global comparison of coincident MISR and AERONET sunphotometer data showed that overall about 70 to 75% of MISR AOD retrievals fall within 0.05 or 20% × AOD, and about 50 to 55% are within 0.03 or 10% × AOD, except at sites where dust or mixed dust and smoke are com- monly found (Kahn et al., 2005, 2010). The latest assessment shows that MISR can distinguish aerosol types categorically for components representing about ~20% of the total column AOD, provided the mid-visible AOD is ≥ 0.15 (Kahn et al., 2010).
High-resolution biomass burning plume top height and wind information are derived at a spatial resolution of 1.1 km by analysis of the MISR radiance data using the MISR Inter-
active eXplorer (MINX) tool (Nelson et al., 2008a, 2008b). MINX provides an interface within which a trained user can outline plumes associated with MODIS thermal anomaly data and provide a wind direction. Inclusion of the wind direction reduces the number of free parameters in the simultaneous stereoscopic retrieval of heights and winds, allowing for very precise retrieval of the plume height and wind speed. Uncer- tainties in the plume heights are estimated to be ~200 m, and uncertainties in the wind speed are 1~2 m/s (Nelson et al., 2008b).
2.3. CALIOP/CALIPSO
CALIPSO is a Franco-American mission that supplies a unique dataset of atmospheric vertical profiles measured by CALIOP on-board the satellite with a 30 m vertical resolu- tion to measure aerosol and cloud properties (Winker et al., 2004). The profiles range from the surface to 40 km with a re- solution of 30 ~ 60 m in the vertical and 333 m in the hori- zontal. CALIPSO can detect optical depths of 0.01 or less, so it can observe weak aerosol layers and thin clouds (McGill et al., 2007).
In this study, the CALIOP Level-2 data are employed, which contains calibrated and geolocated single-shot (highest
resolution)lidarprofiles.NighttimeCALIOP profiles are gene-
rally better as they depict dust storms more accurately com- pared to daytime overpass data which are rather more noisy (Labonne et al., 2007). CALIPSO data releases began in mid- June 2006, and include the Level-1 radiances, the Level-2 ver- tical feature mask, and the cloud and aerosol layer products (Winker et al., 2003).
2.4. OMI
OMI was launched in July 2004 on NASA’s EOS-Aura satellite, which is part of the A-train constellation that cro- sses the equator within several minutes of one another in the
afternoon (Levelt et al., 2006). In this study, we analyze the OMI/Aura Near-UV Aerosol Level-2G Global (OMAERUV- G) and Level-3 (OMAERUVd) data products (Torres et al., 2007) to extract Ultra-Violet Aerosol Index (UVAI) and aero- sol absorption optical depth (AAOD) data. OMI’s new near- UV aerosol retrievals, which are accurate in arid environ- ments (Torres et al., 2007), complement and enhance the heri- tage Total Ozone Mapping Spectrometer (TOMS) data, and contribute to dust source mapping and emission/transport stu- dies. However, UV and infrared retrievals are very sensitive to the dust vertical distribution, wind-transport and the dust size distributions (Schepanski et al., 2007). UVAI is a residual
quantitythatindicatesthe departureofthespectraldependence
of the upwelling radiation from that of a pure Rayleigh atmos- phere bounded by a Lambertian surface. Aerosol algorithms are described by Stammes and Noordhoek (2002) and Torres et al. (2005, 2007). Given the large size (13 × 24 km at nadir) of the OMI pixels, subpixel cloud contamination is a persis- tent problem resulting in the overestimation of the extinction optical depth and underestimation of the single scattering co- albedo (Torres et al., 2007). However, in the calculation of the absorption optical depth, a partial cancellation of errors takes place, allowing the retrieval of AAOD even in the presence of small amounts of cloud contamination.
2.5. MTSAT-1R
MTSAT-1R, located at 145° E, is a geostationary sate- llite operated by the Japan Meteorological Agency. The me- teorological instruments onboard MTSAT-1R cover the full disk of the earth which spans about 18 degrees of viewing an- gle at the geostationary orbit. The satellite is equipped with a 5 channel imaging instrument (1 visible and 4 infrared cha- nnels having 1 and 4 km ground sampling resolution, respect- tively, at satellite nadir), which takes the full-disk measure- ment at every 30minutes. Although the instrument is not de- signed to monitor or detect atmospheric aerosols, its special Table 1. The Characteristics and Source of Data over the Study Region
Data name Product Level Spectral resolution Spatial
resolution Temporal resolution Web link MODIS Aqua -Deep
Blue AOD (land)
MYD08_D3 3 36 spectral bands
from 0.4-14.4 m
1 degree 1 day http://www.echo.nasa.gov/
MODIS Terra -AOD MOD08_D3 3 36 spectral bands
from 0.4-14.4 m 1 degree 1 day http://www.echo.nasa.gov/
MODIS Aqua -AOD
(ocean) MYD08_D3 3 36 spectral bands from 0.4-14.4 m 1 degree 1 day http://www.echo.nasa.gov/
MISR Terra Ancillary AGP
product*
1 & 2 9 views** 1 degree 1 day*** http://www-misr.jpl.nasa.gov/get
Data/
CALIPSO Vertical profile 2 - - - http://www-calipso.larc.nasa.gov/
OMI AURA - UV AOD AAOD OMAERUVG 2 - - 0.25 degree 1 day 1 day http://disc.sci.gsfc.nasa.gov http://disc.sci.gsfc.nasa.gov OMAERUVd 3 1 degree
MTSAT Imager AI 2 - 4 km 0.5 hour http://nmsc.kma.go.kr/
*Containing the MISR digital elevation data (DEM), terrain-referenced radiances, geometric parameters, and aerosol. **Four spectral bands centered at 446, 558, 672, and 867 nm.
capability of continuous observation has attracted interest on the real time monitoring of the dust outbreak and its transpor- tation. For derivation of the quantitative information on aero- sols, Kim et al. (2008) utilized data of the infrared split win- dow channels of 11 and 12 µm and their thermal characteri- stics associated with the presence of dust aerosols, and deri- ved the infrared optical depth index (IODI) which has been used in the Korea Meteorological Administration for the ope- rational detection and monitoring of dust outbreak since 2008.
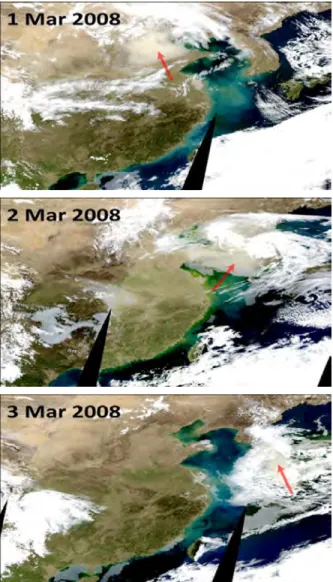
Figure 1. The RGB composition images from MODIS channel 1 (645 nm), 4 (555 nm) and 3 (469 nm) on 1 ~ 3 March 2008, with red arrows indicating the locations of sand-dust storms.
3. Case Description
Figure 1 shows the red, green and blue (RGB) compo- sition images from MODIS on 1 ~ 3 March 2008 in East Asia. A severe SDS, represented by dust cloud in dark yellow, was observed in 1 March over a region between Inner Mongolia
and Shandong in China, covering large cities such as Beijing and Tianjin. It moved over to Yellow Sea and western Korean Peninsula in 2 March, and then overspread most part of South Korea in 3 March.
In constructing a synoptic conceptual model of ADSs, Wang and Fang (2006) concluded that development of ADS was characterized by 1) strong baroclinicity–lagging of the temperature trough behind the geopotential trough which tilts westward from 850 to 500 hPa, 2) cold (warm) advection be- hind (before) the geopotential trough, which brings about inc- rease in pressure gradient and thus strong surface wind excee-
ding 6 ~ 8 ms-1 to generate dust storms in the arid regions, and
3) downwind movement and rise up to 700 ~ 500 hPa of the dust cloud under the influence of the ascending air motion behind the cold front. They also noticed that the upper-level trough is generally located between the surface high and low pressure centers. Meanwhile, Sun et al. (2006) noted that ADSs occur mostly under the strong cold air flows related to Mongolian cyclones.
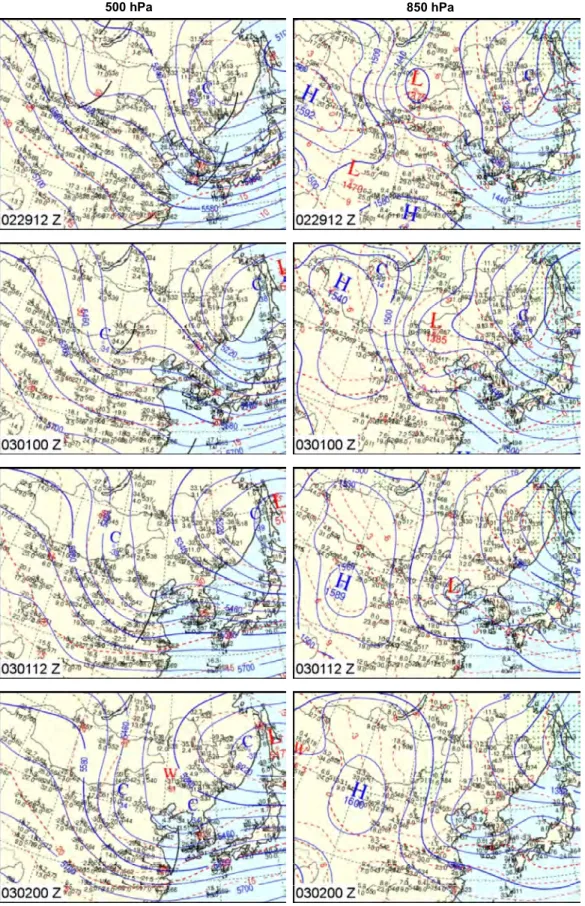
For the case ADS in this study, synoptic analyses of 850 and 500 hPa are provided in Figure 2. At 1200UTC (Coordi- nated Universal Time) 29 February, a shortwave trough at 500 hPa developed over central Mongolia with its corresponding low-level cyclone formed over eastern Mongolia at 850 hPa. Cold (warm) advection behind (before) the low existed at 850 hPa, indicating quite significant baroclinicity though it beca- me weaker later. The 500 hPa trough located between the 850 hPa high and low centers by 0000UTC 01 March, and moved southeastward very rapidly locating over the Yellow Sea in the next 36 hrs (0000UTC 02 March).
Strong northwesterly winds of 7 ~ 13 ms-1 were obser-
ved at sites over western and central Inner Mongolia from 0000UTC 28 to 1200UTC 29 February (not shown), which were associated with the development of a Mongolian cyc- lone and resulted in blowing dust and SDS therein. As the trough aloft propagates southeastward, the cyclone moved to eastern Mongolia, central-eastern Inner Mongolia and Tian- jin/Bohai Sea area. Severe dust activities at surface remained on the western and southwestern sides of the surface low, in agreement with the results of Wang and Fang (2006).
In the Korean Peninsula, based on the PM10 observations,
dust events at the surface were observed during a period of 0500UTC 02 ~ 1300UTC 03 March in the southern part of South Korea, starting at the southwestern coastal area, moving slightly northeastward, and then ending at southeastern coas- tal area (see details in Kang, 2010). Dust particle aloft that covered most of Yellow Sea and the western part of the Ko- rean Peninsula at March 2, as shown in Figure 1, can reach the ground through downward motion. Figure 3 shows down- ward motions at 700 hPa over southern Yellow Sea at 0000UTC 02 March and southeastern part of South Korea at 1200UTC 02 March. In the former, westerly to southwesterly into the Korean Peninsula was predominant at 850 hPa while northwesterly prevailed over the Korean Peninsula in the la- tter. This explains the temporal behavior of dust particles in
500 hPa 850 hPa
Figure 2. Synoptic charts of 500 hPa (left panel) and 850 hPa (right panel) for 1200 UTC 29 February, 0000 UTC 01 March,
vations. That is, the upper-level downdraft carried dust parti- cles aloft to the surface layer and the lower-level winds trans- ported them into or out of the Korean Peninsula.
850 hPa 700 hPa 0302 12 Z 03 0 200 Z
Figure 3. Vertical velocity (in hPa/hr) at 700 hPa (left panel) and streamlines and isotach (> 25 kts; shaded contour) at 850 hPa (right panel) on 0000 UTC (upper panel) and 1200 UTC (lower panel) 02 March 2008.
4. Results
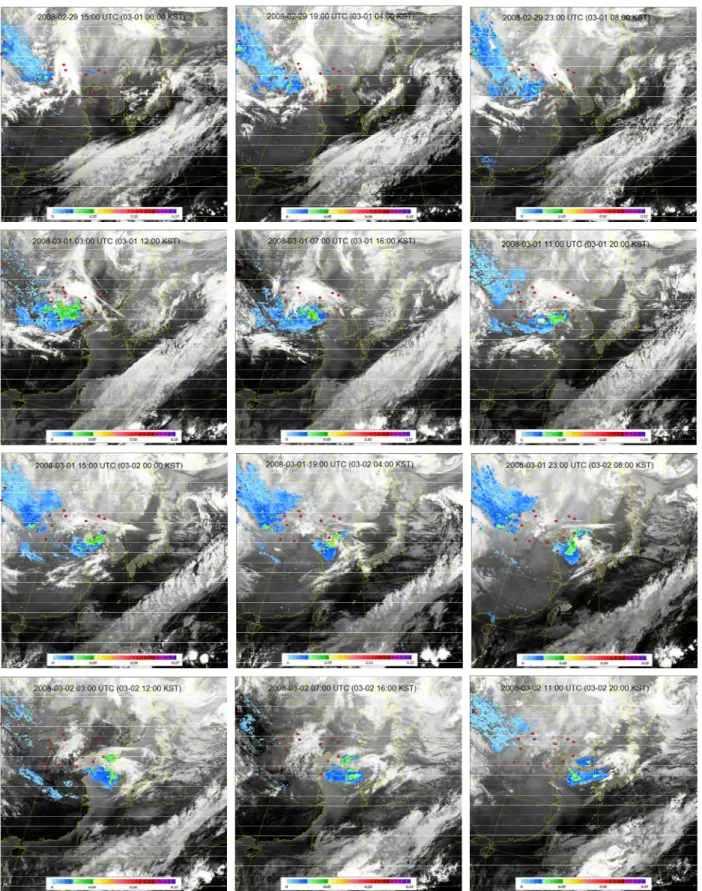
4.1. Detection of Dust Outbreaks – MTSAT-1R IODI Figure 4 shows the time series of IODI, derived from the MTSAT-1R observation, from March 1 to March 2 in every 4 hours (the operational products are produced in every half hour. Here we show the products at every 4hours for brevity), which cover the whole period of current case study. Based on the time series of IODI, the major dust outbreak started at around 1500UTC 29 February (0000KST (Korean Standard Time) 1 March) over the inner Mongolia area just after passa- ge of a frontal system. Overall, the time series of IODI clearly demonstrates the capability of real time monitoring of dust outbreak. However, operational application of IODI has at least two limitations under certain conditions. First, IODI is not accurate over the water/ice cloudy regions. Therefore, the dust outbreaks occurring beneath the cloud layer could intro- duce a significant shortfall in operational monitoring. Second, IODI has a diurnal variation depending on the skin tempe- rature. For example, the IODI signal is notably weak at 0800KST 1 March mainly due to the cooled land surface skin temperature, resulting in a less difference between the two split window channels, and hence weak aerosol signal. 4.2. Aerosol Loadings – MODIS AOD
To compare the anthropogenic to natural air pollution sources over the region under study, the MODIS-Aqua DB
AOD550 (i.e. AOD at 550 nm wavelength) product together with the DT AOD product were used. The DB AOD product over the bright region was used rather than the standard DT AOD product due to the sensitivity of the former over bright surfaces. Retrieved from the Terra/Aqua MODIS, AOD des- cribes scattering/absorption property of solar radiation by at- mospheric particles and measures aerosol loading, with high AOD denoting high concentration of aerosols in the atmos- phere. DB AOD is more suitable for the bright land surface while standard (DT) AOD is used over the ocean. MODIS AOD shows good agreement with ground-based AOD on an annual basis, with an overestimation in the warm period (Ge- rasopoulos et al., 2011). Dust particles can be distinguished from the fine-mode pollution particles based upon the AE (an indicator of size mode) derived by the DB algorithm (Lin et al., 2011).
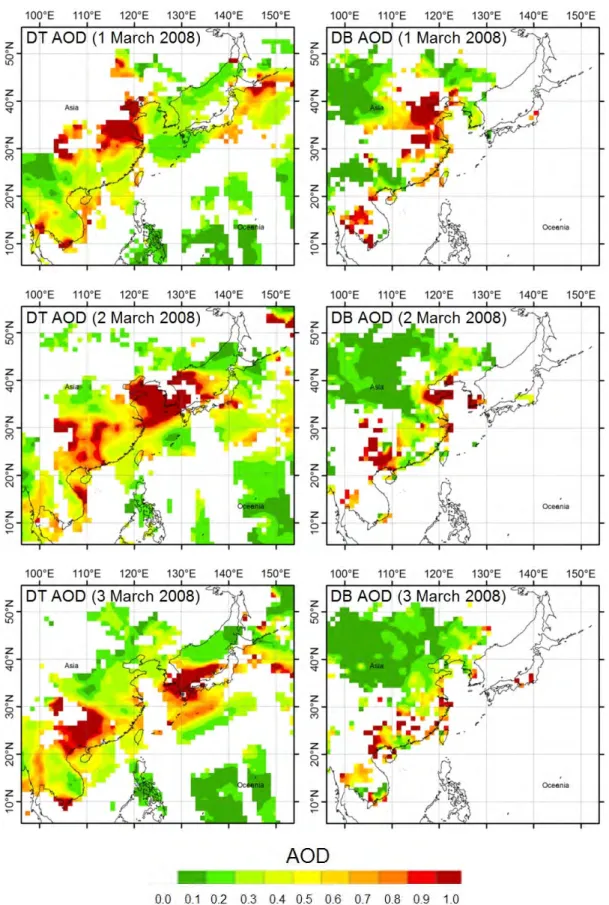
Figure 5 compares AODs based on DT and DB algo- rithms. Overall DT AOD provides sufficient information on dust clouds both over land and ocean while DB AOD fills up some land areas, which have bright surfaces and thus are void from DT AOD. For example, on 1 March, high AODs were observed over central to northern China; however, DT AOD misses data over areas west to northwest of the Shandong Peninsula. These areas, including Zibo, Tianjin, Beijing, Shi- jiazhuang, Handan and Jinan, are covered up by DB AOD. On 2 and 3 March, DT AODs describes well the major dense dust clouds over the ocean areas while DB AOD supplements some other land areas. This indicates that combined aerosol loading information available from other algorithms (and sen- sors) provide more continuous and complete detection of se- vere SDSs (e.g., Prasad et al., 2010).
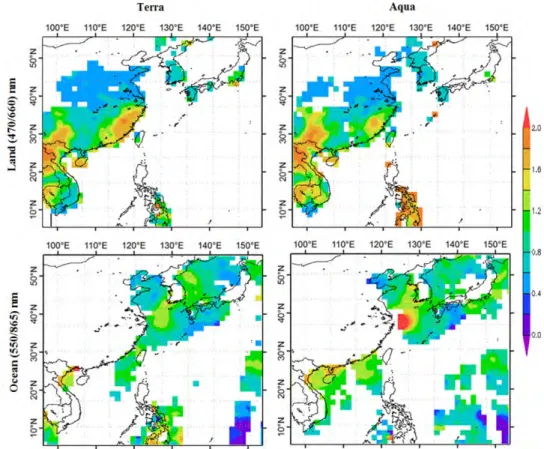
4.3. Fine-Mode Anthropogenic Aerosols – MODIS AE In the solar spectrum, AE is a good indicator of the size range of the atmospheric particles responsible for the AOD: AE > 1 when fine mode (submicron) aerosols are dominant, while AE < 1 for aerosols dominated by coarse or supermic- ron particles (El-Askary et al., 2009). The coarse aerosols are mostly from sea salt and mineral dust, whereas the fine aero- sols are mainly anthropogenic (e.g., carbonaceous aerosols, sulfate, etc.) generated from urban/industrial activities and biomass burning as well as from gas-to-particle conversion (Ramachandran, 2004). Figure 6 shows AE from the Terra/A- qua MODIS over land and ocean, calculated using two wave-
lengths: λ1 = 470 nm and λ2 = 660 nm for land, and λ1 = 550
nm and λ2 = 865 nm for ocean. Over the land, anthropogenic
aerosols (i.e., AE > 1) are significant over the Indochina Pe- ninsula, the Philippines and southern China, with the latter two showing temporal changes. In contrast, areas over central to northern China, with AE in the range of 0.4 ~ 0.6, are co- vered with a mixture of dust and pollution. Most ocean areas in East Asia are covered by a weak-to-moderate amount of anthropogenic aerosols while it significantly increased over the East China Sea, as detected from the Aqua MODIS, po- ssibly due to transport of inland polluted particles. Early dete- ction of such anthropogenic aerosols is very useful and impor-
Note: Higher IODI means thicker aerosol optical depth
Figure 4. Time evolution of aerosol signal (IODI; infrared optical depth index), derived from the MTSAT-1R data, from 0000 KST 01 to 2000 KST 02 March 2008 at every 4 hours.
Figure 5. Aerosol optical depth (AOD) based on standard dark-target (DT) algorithm (left panel) and deep blue (DB) algorithm (right panel) during 1 ~ 3 March 2008.
tant to the adjacent countries, located downstream, in terms of health protection.
4.4. Absorbing Aerosols – OMI
Absorbing aerosols, originated from arid areas (e.g., de- sert dust) and biomass burning and forest fires (e.g., carbona- ceous aerosols), are among the most long-lived aerosol types as they make long-range transport, during which they usually interact with urban/industrial pollutants and other aerosols under various meteorological conditions. This results in com- plex composition of mixed type aerosols that affect the radia- tive balance of the climate system, both directly and indirectly (Ahn et al., 2008). To detect and quantify these aerosols, such as carbonaceous and mineral dust, the near-UV aerosol sen- sing is adequate since they absorb ultra-violet (UV) radiation.
OMI provides the aerosol absorption optical depth (AA- OD) as well as the aerosol extinction optical depth (AOD), at 354, 388 and 500 nm, based on the OMAERUV algorithm. AOD measures the extinction of light by aerosols due to the combined effect of scattering and absorption, while AAOD does that due to aerosol absorption only. Therefore, AAOD is insensitive to clouds and the AAOD retrieval can be exten- ded to pixels with small amount of cloud contamination whe- reas the AOD retrieval is restricted to cloud-free scenes. For this reason, AAOD is useful to track the dust and smoke aero-
sols mixed with clouds as well as those over bright surface. In Figure 7, comparisons of AAOD and AOD are made for di- fferent near-UV channels on 1 March 2008. In general, AAODs provide abundant information on aerosol loadings associated with the dust event while information from AODs is restricted to clear-sky areas only. Remarkable aerosol absor- ptions in both the near UV and the visible with AAOD as high as 0.14 ~ 0.22 are spread over central, central western and northern China. These are probably due to aerosol mixtures including desert dust and industrial pollution as well as smoke from biomass burning, as indicated by Ahn et al. (2008). Compared to AAOD with 500 nm, the 388 nm AAOD shows sharp increase over the area west to northwest of the Shan- dong Peninsula. This is consistent with the bright surface area that includes major cities such as Beijing, Tianjin, Shijia- zhuang and Jinan, as shown in DB AOD (see top right panel of Figure 5). This steep increase in absorbing in the near UV than the visible is possibly due to dust mixed with urban/in- dustrial pollutants. OMI AOD shows highest aerosol loading over the Bohai Sea, similar to MODIS DT AOD (see top left panel of Figure 5); however, AOD values over the whole domain generally present little spectral dependence. These may reflect thin dust aerosol layers transported from the sour- ce regions and/or some aged carbonaceous aerosols (see Ahn et al., 2008).
Figure 6. Angstrom exponent (AE) from MODIS onboard Terra (left panel) and Aqua (right panel) over land with 1 = 470 nm
4.5. Plume Height – MISR
OMI revealed dust aerosols of natural origin mixed with urban/industrial pollutants over the region under study. Hence, smoke plumes height and associated aerosols distributions ex- tracted from MISR satellite data sets will be quite useful in addressing some of the mixed aerosol characteristics. These data also include the location and time of plume observations, plume height measurements (from which injection heights may be deduced), the approximate areas of individual smoke plumes, and aerosol properties and top-of-atmosphere albedo estimates. Figures 8 and 9 show aerosol related histograms as well as the wind height, albedo profiles for a plume observed over the region on 1 March 2008. Optical depth spectral bars (Figure 8a) covered different short wavelength spectral bands as represented by the different colors as a proxy for pollution contribution which is validated by the high single scatter albe- do (Figure 8c). MISR’s Ångström exponent, single scattering albedo and AOD size fraction reveal particle properties over dust plumes as they evolve during transport over the region. Ångström exponent over 1.0 confirms the origination from biomass burning and industrial pollution in agreement with OMI observations (Figure 8b). Over dusty regions such as the Sahara, Gobi and Taklamakan Desert, dusts contribute to a low scattering albedo; however, over industrial regions, such
asEurope, North America and East Asia (our case), the single-
scattering albedo is found to be about 0.98 due to large con- tributions of sulfate and black carbon from biomass burning (Figure 8c). The “Tau Fraction by Particle-Type” histogram depicts the fraction of the green-band optical depth value that is attributable to small (< 0.35 μm), medium (0.35 < 0.7μm) and large (> 0.7 μm) particle sizes and the fraction of the greenband optical depth value attributable to spherical particles (Figure 8d). The 3-dimensional extent of the plume is evidenced from the wind height across and along track his- tograms (Figure 9 top and middle panels) together with the the spectral albedo profile at the top-of-atmosphere made du- ring height retrievals representing the four MISR spectral ban- ds (Figure 9 lower panel). Corrected wind heights are cen- tered on positive values as a result of negative direction of the plume (towards south) seen from the along-track wind com- ponent. The along-track motion of plume can get mixed up with the satellite along-track motion if the wind corrected heights show much greater scatter than the zero-wind heights which is not the case here (Figure 9 top panel).
4.6. Vertical Structure of Dust and Anthropogenic Aero sols – CALIPSO
In Figure 10, the vertical profiles of the atmosphere up to 20 km, represented by total attenuated backscatter at 532 nm, are shown as CALIPSO overpasses the inland China on 1 Figure 7. Aerosol absorption optical depth (AAOD; upper panel) and aerosol extinction optical depth (AOD; lower panel)
March (Figure 10a) and the Yellow Sea on 2 March 2008 (Fi- gure 10b), both during nighttime, while Figures 10c and 10d showed the most abundant aerosol types over selected areas shown in Figures 10a and b. The observed mixing scenario shed more light on the increase in absorbing in the near UV (Figure 7, top panel) than the visible is actually caused pollu- tion mixing with dust rather than caused by pure dust which is another possibility (Giles et al., 2012). Each profile clearly shows the vertical structure of a major SDS over the study regions. On 1 March, high concentration of aerosol reached up to 4 ~ 5 km over the areas from central to northern inland China, including northeastern Inner Mongolia (Figure 10a). Areas in southern China are mostly covered by clouds, which show extremely high backscatter (topped white) and block backscatter from the atmosphere (deep blue) below them. On 2 March, dense dusts are observed over the Yellow Sea, reach- ing up to 4 ~ 5 km. Areas over the East China Sea and Taiwan are covered by clouds. Mixed cloud layers are observed over the Yellow Sea at 34 ~ 38° N following the path of CALIPSO. The major SDS was also identified in other parameters ob-
tainedfromCALIPSO, such as perpendicular attenuated back-
scatter (532 nm), total attenuated backscatter at 1064 nm, attenuated color ratio, and depolarization ratio (not shown).
5. Conclusions
In this study, multi-sensor and multi-algorithm approa- ches from satellite remote sensing are applied to a severe Asian dust strom (ADS) case, which originated in China and affected Korea and Japan, to investigate characteristics of the case storm and to explore the capability of such approaches for its detection and monitoring. For this purpose, we employ several satellite sensors such as an imager on-board the MT- SAT-1R, MODIS, OMI, and the lidar instrument and visible- infrared imagers on-board CALIPSO.
The case ADS originated in the arid areas over eastern Mongolia, in association with the development of a Mongo- lian cyclone. An upper-level shortwave trough developed over central Mongolia, under strong baroclinicity, with its corres- ponding low-level cyclone formed over eastern Mongolia at 1200UTC 29 February 2008, and moved southeastward very rapidly locating over the Yellow Sea in the next 36 hrs (0000UTC 02 March). Strong northwesterly winds were indu- ced by the cyclone and resulted in blowing dust and an ADS over western to central Inner Mongolia. A severe ADS, repre- sented by dust cloud in dark yellow, was observed in 1 March
overaregion betweenInner Mongolia and Shandong in China.
Note: When more than one band occupies the same Tau or SSA interval, bars with largest value are drawn in the back and the ones with the smallest value in the front
Figure 8. Aerosol histograms with no cloud contamination where color indicates band for a) optical depth, b) angstrom exponent, c) SSA, and d) Tau fraction by particle.
It moved over to the Yellow Sea and the western Korean Peninsula in 2 March, and then overspread most part of South
Korea in 3 March. Based on the PM10 observations in South
Korea and synoptic analysis, it turns out that the upper-level downdraft carried dust particles aloft to the surface layer and the lower-level winds transported them into or out of the Korean Peninsula.
Information on aerosol loading of this ADS is provided by aerosol optical depth (AOD) retrieved from the Terra/ Aqua MODIS. For retrieving AOD over bright land surface,
deep blue (DB) algorithm is adopted. For the case dust storm, information on dust clouds were well presented by the stan- dard AOD except over the bright surface areas west to north- west of the Shandong Peninsula, which were covered by DB AOD. This indicates that combined aerosol loading informa- tion available from other algorithms (and sensors) provide more continuous and complete detection of severe SDSs.
Size mode of aerosols is identified using the Ångström exponent (AE), calculated from MODIS AOD of two adja- cent wavelengths. In our analysis domain, during the storm Figure 9. Height and wind histograms and the albedo profile (color indicates band) for the smoke plume.
Note: In (a) and (b), the surface elevation is shown as a thick black line while the inset map shows the path of CALIPSO overpass over the globe (black line) and the study region (red line)
Figure 10. Total attenuated backscatter at 532 nm of a dust storm event as measured by the night-time CALIPSO overpass over a) the inland China (at 1839 to 1847 UTC 1 March 2008) and b) the Yellow Sea (at 1745 to 1753 UTC 2 March 2008) as well as CALIPSO Aerosol Subtype over the selected areas of c) the inland China (at 1842 to 1856 UTC 1 March 2008) and d) the Yellow Sea (at 1745 to 1800 UTC 2 March 2008).
event, anthropogenic aerosols (i.e., AE > 1) were significant over the Indochina Peninsula, the Philippines and southern China, while a mixture of dust and pollution (i.e., 0.4 < AE < 0.6) were predominant over central to northern China. Most ocean areas in East Asia were covered by a weak-to-mode- rate amount of anthropogenic aerosols while it significantly increased over the East China Sea, possibly due to transport of inland polluted particles.
Absorbing aerosols, such as carbonaceous and mineral dusts, are detected and quantified by the aerosol absorption optical depth (AAOD) provided by OMI. AAOD is insensi- tive to clouds and hence is useful to track the dust and smo- ke aerosols mixed with clouds as well as those over bright surface. In our case, remarkable aerosol absorptions in both the near UV and the visible, with AAOD as high as 0.14 ~ 0.22, were spread over central, central western and northern China, probably due to aerosol mixtures including desert dust and industrial pollution as well as smoke from biomass bur- ning. A sharp increase of AAOD in the near UV than the visi- ble, over the area west to northwest of the Shandong Penin- sula, is possibly due to dust mixed with urban/industrial pollu- tants.
The vertical structure of aerosols and clouds are disclo- sed by using an active laser beam from the lidar instrument on-board CALIPSO. In the case dust storm, on 1 March, high concentration of aerosol reached up to 4 ~ 5 km over the areas from central to northern inland China, including northeastern Inner Mongolia, while areas in southern China were mostly covered by clouds. On 2 March, dense dusts were observed over the Yellow Sea, reaching up to 4 ~ 5 km, and areas over the East China Sea and Taiwan were covered by clouds. Mix- ed cloud layers were observed over the Yellow Sea at 34 ~ 38° N following the path of CALIPSO.
Overall the multi-sensor and multi-algorithm approach using satellite remote sensing provides useful information on various properties of the case dust storm, including location and magnitude of aerosol loading, size mode of aerosols, the behavior of long-lived absorbing aerosols, and the vertical structure. This enables us to make more continuous and com- plete detection of severe SDSs. In addition, our approach pro- vides information on anthropogenic aerosols and pollutants, not just dust particles. Early detection of such aerosols and pollutants is very useful and important to the countries, locat- ed downstream from the source region, in terms of health protection.
Acknowledgments. The authors are grateful to the Korea Meteorological Administration for providing the synoptic analysis charts for this study. This work is supported by the GEMS program of the Ministry of Environment, Korea through the Eco Innovation Program of KEITI (2012000160002) and by the Ministry of Edu- cation, Science and Technology, Korea, through the National Re- search Foundation grant (No. 2009-0083527). A partial support for the US collaborators was provided by the NSF grant 0922772. Furthermore, the authors would like also to acknowledge the use of the Samueli Laboratory in Computational Sciences in the Schmid College of Science and Technology, Chapman University in image processing and data analysis.
References
Adams, J.W., Rodriguez, D., and Cox, R.A. (2005). The uptake of SO2 on Saharan dust: A flow tube study. Atmos. Chem. Phys., 5, 26
79-2689. http://dx.doi.org/10.5194/acp-5-2679-2005
Ahn, C., Torres, O., and Bhartia, P.K. (2008). Comparison of ozone monitoring instrument UV aerosol products with Aqua/Moderate Resolution Imaging Spectroradiometer and Multiangle Imaging Spectroradiometer observations in 2006. J. Geophys. Res. (D
Atmos.), 113(D16), D16S27. http://dx.doi.org/10.1029/2007JD008
832
Ångström, A. (1961). Techniques of determining the turbidity of the atmosphere. Tellus, 13(2), 214-23. http://dx.doi.org/10.1111/j.2153 -3490.1961.tb00078.x
Bhattacharjee, P.S., Prasad, A.K., Kafatos, M., and Singh, R.P. (2007). Influence of a dust storm on carbon monoxide and water vapor over Indo-Gangetic Plains. J. Geophys. Res. (D Atmos.), 112(D18), D18203. http://dx.doi.org/10.1029/2007JD008469
Bryson, R.A., and Barreis, I.A. (1967). Possibilities of major climatic modifications and their implications: Northwest India, a case for study. Bull. Am. Meteorol. Soc., 48, 136-142.
Chan, Y.C., McTainsh, G., Leys, J., McGowan, H., and Tews, K. (2005). Influence of the 23 October 2002 dust storm on the air quality of four Australian cities. Water, Air, Soil Pollut., 164(1-4), 329-348. http://dx.doi.org/10.1007/s11270-005-4009-0
Chen, Y.S., Sheen, P.C., Chen, E.R., Liu, Y.K., Wu, T.N., and Yang, C.Y. (2004). Effects of Asian dust storm events on daily mortality in Taipei, Taiwan. Environ. Res., 95(2), 151-155. http://dx.doi.org/ 10.1016/j.envres.2003.08.008
Chun, Y., Boo, K.O., Kim, J., Park, S.U., and Lee, M. (2001). Sy- nopsis, transport, and physical characteristics of Asian dust in Korea. J. Geophys. Res. (D Atmos.), 106(D16), 18461-18469. http: //dx.doi.org/10.1029/2001JD900184
El-Askary, H., Gautam, R., and Kafatos, M. (2004). Remote sensing of dust storms over the Indo-Gangetic basin. J. Indian Soc. Remote
Sens., 32(2), 121-124. http://dx.doi.org/10.1007/BF03030869
El-Askary, H., Gautam, R., Singh, R.P., and Kafatos, M. (2006). Dust storms detection over the Indo-Gangetic basin using multi sensor data. Adv. Space Res., 37(4), 728-733. http://dx.doi.org/10.1016/j. asr.2005.03.134
El-Askary, H., Farouk, R., Ichoku, C., and Kafatos, M. (2009). Transport of dust and anthropogenic aerosols across Alexandria, Egypt. Ann. Geophys., 27, 2869-2879. http://dx.doi.org/10.5194/an geo-27-2869-2009
El-Askary, H.M., Sarkar, S. and El-Ghazawi, T.A. (2003). A multisensor approach to dust storm monitoring over the Nile delta.
IEEE Trans. Geosci. Remote Sens., 41(10), 2386-2391. http://dx.
doi.org/10.1109/TGRS.2003.817189
Evan, A.T., Dunion, J., Foley, J.A., Heidinger, A.K., and Velden, C.S. (2006). New evidence for a relationship between Atlantic tropical cyclone activity and African dust outbreaks. Geophys. Res. Lett., 33(19), L19813. http://dx.doi.org/10.1029/2006GL026408 Falke, S.R., Husar, R.B., and Schichtel, B.A. (2001). Fusion of
SeaWiFS and TOMS satellite data with surface observations and topographic data during extreme aerosol events. J. Air Waste Ma-
nage. Assoc., 51(11), 1579-1585. http://dx.doi.org/10.1080/104732
89.2001.10464386
Fan, X.B., Okada, K., Niimura, N., Kai, K., Arao, K., Shi, G.Y., Qin, Y., and Mitsuda, Y. (1996). Mineral particles collected in China and Japan during the same Asian dust-storm event. Atmos. Envi-
ron., 30(2), 347-351. http://dx.doi.org/10.1016/1352-2310(95)0027
1-Y
Fang, M., Zheng, M., Wang, F., Chim, K.S., and Kot, S.C. (1999). The long-range transport of aerosols from northern China to Hong
Kong - A multi-technique study. Atmos. Environ., 33(11), 1803-18 17. http://dx.doi.org/10.1016/S1352-2310(98)00318-5
Fouquart, Y., Bonnell, B., Brogniez, G., Buriez, J.C., Smith, L., Morcrette, J.J., and Cerf, A. (1987). Observations of Saharan aerosols: Results of ECLATS field experiment. Part II: Broadband radiative characteristics of the aerosols and vertical radiative flux divergence. J. Appl. Meteorol., 26(1), 38-52. http://dx.doi.org/10. 1175/1520-0450(1987)026<0038:OOSARO>2.0.CO;2
Garrison, V.H., Shinn, E.A., Foreman, W.T., Griffin, D.W., Holmes, C.W., Kellogg, C.A., Majewski, M.S., Richardson, L.L., Ritchie, K.B., and Smith, G.W. (2003). African and Asian dust: From desert soils to coral reefs. BioScience, 53(5), 469-480. http://dx.doi.org/ 10.1641/0006-3568(2003)053[0469:AAADFD]2.0.CO;2
Gerasopoulos, E., Amiridis, V., Kazadzis, S., Kokkalis, P., Elefthe- ratos, K., Andreae, M.O., Andreae, T.W., El-Askary, H., and Zerefos, C.S. (2011). Three-year ground based measurements of aerosol optical depth over the Eastern Mediterranean: the urban environment of Athens. Atmos. Chem. Phys., 11, 2145-2159. http:// dx.doi.org/10.5194/acp-11-2145-2011
Giles, D.M., Holben, B.N., Eck, T.F., Sinyuk, A., Smirnov, A., Slutsker, I., Dickerson, R.R., Thompson, A.M., and Schafer, J.S. (2012). An analysis of AERONET aerosol absorption properties and classifications representative of aerosol source regions. J.
Geophys. Res. (D Atmos.), 117(D17), D17203, http://dx.doi.org/10.
1029/2012JD018127
Ginoux, P., Garbuzov, D., and Hsu, N.C. (2010). Identification of an- thropogenic and natural dust sources using Moderate Resolution Imaging Spectroradiometer (MODIS) Deep Blue level 2 data. J.
Geophys. Res. (D Atmos.), 115(D5), D05204. http://dx.doi.org/10.
1029/2009JD012398
Gong, W., Min, Q., Li, R., Teller, A., Joseph, E., and Morris, V. (2010). Detailed cloud resolving model simulations of the impacts of Saharan air layer dust on tropical deep convection -- Part 1: Dust acts as ice nuclei. Atmos. Chem. Phys. Discuss., 10, 12907- 12952. http://dx.doi.org/10.5194/acpd-10-12907-2010
Goudie, A.S. (2009). Dust storms: Recent developments. J. Environ.
Manage., 90(1), 89-94. http://dx.doi.org/10.1016/j.jenvman.2008.0
7.007
Guerzoni, S., Chester, R., Dulac, F., Herut, B., Loye-Pilot, M.D., Measures, C., Mignon, C., Molinari, E., Moulin, C., Rossini, P., Saydam, C., Soudine, A., and Ziveri, P. (1999). The role of atmospheric deposition in the biogeochemistry of the Mediter- ranean Sea. Prog. Oceanogr., 44(1-3), 147-190. http://dx.doi.org/ 10.1016/S0079-6611(99)00024-5
Holmes, H. (2001). The Secret Life of Dust: From the Cosmos to the
Kitchen Counter, the Big Consequences of Little Things, John
Wiley & Sons, Inc.
Hong, Y.C., Pan, X.C., Kim, S.Y., Park, K., Park, E.J., Jin, X., Yi, S.M., Kim, Y.H., Park, C.H., Song, S., and Kim, H. (2010). Asian dust storm and pulmonary function of school children in Seoul. Sci.
Total Environ., 408(4), 754-759. http://dx.doi.org/10.1016/j.scitot
env.2009.11.015
Hsu, N.C., Tsay, S.C., King, M.D., and Herman, J.R. (2004). Aerosol properties over bright-reflecting source regions. IEEE Trans.
Geosci. Remote Sens., 42(3), 557-569. http://dx.doi.org/10.1109/
TGRS.2004.824067
Hsu, N.C., Tsay, S.C., King, M.D., and Herman, J.R. (2006). Deep blue retrievals of Asian aerosol properties during ACE-Asia. IEEE
Trans. Geosci. Remote Sens., 44(11), 3180-3195. http://dx.doi.org/
10.1109/TGRS.2006.879540
Huang, J., Ge, J., and Weng, F. (2007). Detection of Asia dust storms using multisensor satellite measurements. Remote Sens. Environ., 110(2), 186-191. http://dx.doi.org/10.1016/j.rse.2007.02.022
Husar, R.B., Tratt, D.M., Schichtel, B.A., Falke, S.R., Li, F., Jaffe, D., Gassó, S., Gill, T., Laulainen, N.S., Lu, F., Reheis, M.C., Chun, Y., Westphal, D., Holben, B.N., Gueymard, C., McKendry, I., Kuring, N., Feldman, G.C., McClain, C., Frouin, R.J., Merrill, J., DuBois, D., Vignola, F., Murayama, T., Nickovic, S., Wilson, W.E., Sassen, K., Sugimoto, N., and Malm, W.C. (2001). Asian dust events of April 1998. J. Geophys. Res. (D Atmos.), 106(D16), 18317-18330. http://dx.doi.org/10.1029/2000JD900788
Iwasaka, Y., Minoura, H., and Nagaya, K. (1983). The transport and spacial scale of Asian dust-storm clouds: A case study of the dust-storm event of April 1979. Tellus, 35(3), 189-196. http://dx. doi.org/10.1111/j.1600-0889.1983.tb00023.x
Jickells, T.D., Dorling, S., Deuser, W.G., Church, T.M., Arimoto, R., and Prospero, J.M. (1998). Air-borne dust fluxes to a deep water sediment trap in the Sargasso Sea. Global Biogeochem. Cycles, 12(2), 311-320. http://dx.doi.org/10.1029/97GB03368
Kahn, R.A., Gaitley, B.J., Martonchik, J.V., Diner, D.J., Crean, K.A., and Holben, B. (2005). Multiangle Imaging Spectroradiometer (MISR) global aerosol optical depth validation based on 2 years of coincident Aerosol Robotic Network (AERONET) observations. J.
Geophys. Res. (D Atmos.), 110(D10), D10S04. http://dx.doi.org/10.
1029/2004JD004706
Kahn, R.A., Gaitley, B.J., Garay, M.J., Diner, D.J., Eck, T.F., Smirnov, A., and Holben, B.N. (2010). Multiangle Imaging SpectroRa- diometer global aerosol product assessment by comparison with the Aerosol Robotic Network. J. Geophys. Res. (D Atmos.), 115 (D23), D23209. http://dx.doi.org/10.1029/2010JD014601
Kang, D.H. (2010). Dynamic Analysis for the Development and
Dissipation of Yellow-Sand in Korea, M.S. thesis, Graduate School
of Education, Pukyong National University, Pusan, Republic of Korea.
Kaufman, Y.J., Tanré, D., Remer, L.A., Vermote, E.F., Chu, A., and Holben, B.N. (1997). Operational remote sensing of tropospheric aerosol over land from EOS moderate resolution imaging spec- troradiometer. J. Geophys. Res. (D Atmos.), 102(D14), 17051-170 67. http://dx.doi.org/10.1029/96JD03988
Kim, H.S., and Kai, K. (2007). Recent dust outbreaks in the Taklimakan Desert and their relation to surface wind and land surface condition. Sci. Online Lett. Atmosphere, 3, 69-72. http://dx. doi.org/10.2151/sola.2007-018
Kim, M.J., Kim, Y.J., Sohn, E.H., Kim, K.L., and Ahn, M.H. (2008). The study on the quantitative dust index using geostationary satel- lite. Atmosphere, 18, 267-277 (in Korean with English abstract). Kim, S., Chun, Y., and Kim, S.B. (2010). The features of Asian dust
events originated in Manchuria. Atmosphere, 20, 273-286 (in Ko- rean with English abstract).
Kim, W., Doh, S.J., and Yu, Y. (2012). Asian dust storm as con- veyance media of anthropogenic pollutants. Atmos. Environ., 49, 41-50. http://dx.doi.org/10.1016/j.atmosenv.2011.12.034
Kimura, R. (2012). Effect of strong wind and land cover in dust source regions on the Asian dust event over Japan from 2000 to 2011. Sci. Online Lett. Atmosphere, 8, 77-80. http://dx.doi.org/10. 2151/sola.2012-020
King, M.D., Kaufman, Y.J., Tanré, D., and Nakajima, T. (1999). Remote sensing of tropospheric aerosols from space: Past, present, and future. Bull. Amer. Meteor. Soc., 80(11), 2229-2259. http://dx. doi.org/10.1175/1520-0477(1999)080<2229:RSOTAF>2.0.CO;2 Koehler, K.A., Kreidenweis, S.M., DeMott, P.J., Prenni, A.J., and
Petters, M.D. (2007). Potential impact of Owens (dry) Lake dust on warm and cold cloud formation. J. Geophys. Res. (D Atmos.), 112(D12), D12210. http://dx.doi.org/10.1029/2007JD008413 Koehler, K.A., Kreidenweis, S.M., DeMott, P.J., Prenni, A.J., and
Petters, M.D. (2007). Potential impact of Owens (dry) Lake dust Labonne, M., Bréon, F.M., and Chevallier, F. (2007). Injection height of biomass burning aerosols as seen from a spaceborne lidar.
Geophys. Res. Lett., 34(11), L11806. http://dx.doi.org/10.1029/20
07GL029311
Legrand, M., Plana-Fattori, A., and N'doumé, C. (2001). Satellite detection of dust using the IR imagery of Meteosat: 1. Infrared di- fference dust index. J. Geophys. Res. (D Atmos.), 106(D16), 18251 -18274. http://dx.doi.org/10.1029/2000JD900749
Levelt, P.F., Van den Oord, G.H.J., Dobber, M.R., Malkki, A., Visser, H., de Vries, J., Stammes, P., Lundell, J.O.V., and Saari, H. (2006). The ozone monitoring instrument. IEEE Trans. Geosci. Remote
Sens., 44(5), 1093-1101. http://dx.doi.org/10.1109/TGRS.2006.872
333
Levy, R.C., Remer, L.A., Kleidman, R.G., Mattoo, S., Ichoku, C., Kahn, R., and Eck, T.F. (2010). Global evaluation of the Collection 5 MODIS dark-target aerosol products over land. Atmos. Chem.
Phys., 10, 10399-10420. http://dx.doi.org/10.5194/acp-10-10399-
2010
Levy, R.C., Remer, L.A., Mattoo, S., Vermote, E.F., and Kaufman, Y.J. (2007). Second-generation operational algorithm: Retrieval of aerosol properties over land from inversion of Moderate Reso- lution Imaging Spectroradiometer spectral reflectance. J. Geophys.
Res. (D Atmos.), 112(D13), D13211. http://dx.doi.org/10.1029/20
06JD007811
Li, J., Zhang, P., Schmit, T.J., Schmetz, J., and Menzel, W.P. (2007). Technical note: Quantitative monitoring of a Saharan dust event with SEVIRI on Meteosat-8. Int. J. Remote Sens., 28(10), 2181- 2186. http://dx.doi.org/10.1080/01431160600975337
Lin, C.Y., Liu, S.C., Chou, C.C.K., Liu, T.H., Lee, C.T., Yuan, C.S., Shiu, C.J., and Young, C.Y. (2004). Long-range transport of Asian dust and air pollutants to Taiwan. Terr. Atmos. Ocean. Sci., 15, 759-784.
Lin, I.I., Chen, J.P., Wong, G.T.F., Huang, C.W., and Lien, C.C. (2007). Aerosol input to the South China Sea: Results from the MODerate Resolution Imaging Spectro-radiometer, the Quick Scatterometer, and the measurements of pollution in the Tropo- sphere Sensor. Deep Sea Res. (II Top. Stud. Oceanogr.), 54, 1589- 1601. http://dx.doi.org/10.1016/j.dsr2.2007.05.013
Lin, T.H., Hsu, N.C., Tsay, S.C., and Huang, S.J. (2011). Asian dust weather categorization with satellite and surface observations. Int.
J. Remote Sens., 32(1), 153-170. http://dx.doi.org/10.1080/014311
60903439932
Liu, C.M., Young, C.Y., and Lee, Y.C. (2006). Influence of Asian dust storms on air quality in Taiwan. Sci. Total Environ., 368(2-3), 884- 897. http://dx.doi.org/10.1016/j.scitotenv.2006.03.039
Maley, J. (1982). Dust, clouds, rain types and climatic variations in tropical north Atlantic. Quatern. Res., 18(1), 1-16. http://dx.doi. org/10.1016/0033-5894(82)90018-7
Marey, H.S., Gille, J.C., El-Askary, H.M., Shalaby, E.A., and El-Raey, M.E. (2010). Study of the formation of the "black cloud" and its dynamics over Cairo, Egypt, using MODIS and MISR sensors. J.
Geophys. Res. (D Atmos.), 115(D21), D21206. http://dx.doi.org/10.
1029/2010JD014384
Marey, H.S., Gille, J.C., El-Askary, H.M., Shalaby, E.A., and El-Raey, M.E. (2011). Aerosol climatology over Nile Delta based on MODIS, MISR and OMI satellite data. Atmos. Chem. Phys., 11, 10637-10648. http://dx.doi.org/10.5194/acp-11-10637-2011 Martonchik, J.V., Diner, D.J., Crean, K.A., and Bull, M.A. (2002).
Regional aerosol retrieval results from MISR. IEEE Trans. Geosci.
Remote Sens., 40(7), 1520-1531. http://dx.doi.org/10.1109/TGRS.
2002.801142
Martonchik, J.V., Diner, D.J., Kahn, R., Gaitley, B., and Holben, B.N. (2004). Comparison of MISR and AERONET aerosol optical depths over desert sites. Geophys. Res. Lett., 31(16), L16102. http: //dx.doi.org/10.1029/2004GL019807
Martonchik, J.V., Kahn, R.A., and Diner, D.J. (2009). Retrieval of
aerosol properties over land using MISR observations, in A. Kokhanovsky (Ed.), Satellite Aerosol Remote Sensing over Land, Springer, pp. 267-293, 2009. http://dx.doi.org/10.1007/978-3-540- 69397-0_9
Matsuki, A., Iwasaka, Y., Osada, K., Matsunaga, K., Kido, M., Inomata, Y., and Kwon, S. A. (2003). Seasonal dependence of the long‐range transport and vertical distribution of free tropospheric aerosols over east Asia: On the basis of aircraft and lidar measure- ments and isentropic trajectory analysis. J. Geophys. Res. (D
Atmos.), 108(D23), 8663. http://dx.doi.org/10.1029/2002JD003266
McGill, M.J., Vaughan, M.A., Trepte, C.R., Hart, W.D., Hlavka, D.L., Winker, D.M., and Kuehn, R. (2007). Airborne validation of spatial properties measured by the CALIPSO lidar. J. Geophys.
Res. (D Atmos.), 112(D20), D20201. http://dx.doi.org/10.1029/20
07JD008768
Miller, R.L., and Tegen, I. (1998). Climate response to soil dust aero- sols. J. Climate, 11, 3247-3267. http://dx.doi.org/10.1175/1520-04 42(1998)011<3247:CRTSDA>2.0.CO;2
Nelson, D.L., Averill, C., Boland, S., Morford, R., Garay, M., Thompson, C., Hall, J., Diner, D., and Camphell, H. (2008a). MISR Interactive Explorer (MINX) v1.0 user's guide, NASA Jet Propulsion Laboratory, Pasadena, California. http://www.openchan nelsoftware.com/projects/MINX.
Nelson, D.L., Chen, Y., Kahn, R.A., Diner, D.J., and Mazzoni, D. (2008b). Example applications of the MISR Interactive Explorer (MINX) software tool to wildfire smoke plume analyses. Proc. of
SPIE 7089, Remote Sensing of Fire: Science and Application, San
Diego, California, USA, 708909. http://dx.doi.org/10.1117/12.795 087
Nicholson, S. (2000). Land surface processes and Sahel climate. Rev.
Geophys., 38(1),117-139. http://dx.doi.org/10.1029/1999RG9000 14
Prasad, A.K., and Singh, R.P. (2007). Changes in aerosol parameters during major dust storm events (2001-2005) over the Indo-Gan- getic basin using AERONET and MODIS data. J. Geophys. Res.
(D Atmos.), 112(D9), D09208. http://dx.doi.org/10.1029/2006JD00
7778
Prasad, A.K., Singh, R.P., and Singh, A. (2006). Seasonal climatology of aerosol optical depth over Indian subcontinent: Trend and de- partures in recent years. Int. J. Remote Sens., 27(12), 2323-2329. http://dx.doi.org/10.1080/01431160500043665
Prasad, A.K., Singh, S., Chauhan, S.S., Srivastava, M.K., Singh, R.P., and Singh, R. (2007). Aerosol radiative forcing over the Indo- Gangetic plains during major dust storms. Atmos. Environ., 41(29), 6289-6301. http://dx.doi.org/10.1016/j.atmosenv.2007.03.060 Prasad, A.K., El-Askary, H., and Kafatos, M. (2010). Implications of
high altitude desert dust transport from Western Sahara to Nile Delta during biomass burning season. Environ. Pollut., 158(11), 33 85-3391. http://dx.doi.org/10.1016/j.envpol.2010.07.035
Prospero, J.M., Ginoux, P., Torres, O., Nicholson, S.E., and Gill, T.E. (2002). Environmental characterization of global sources of atmos- pheric soil dust identified with the Nimbus 7 Total Ozone Mapping Spectrometer (TOMS) absorbing aerosol product. Rev. Geophys., 40(1), 1002. http://dx.doi.org/10.1029/2000RG000095
Qian, W., Quan, L., and Shi, S. (2002). Variations of the dust storm in China and its climatic control. J. Climate, 15, 1216-1229. http://dx. doi.org/10.1175/1520-0442(2002)015<1216:VOTDSI>2.0.CO;2 Ramachandran, S. (2004). Spectral aerosol optical characteristics
during the northeast monsoon over the Arabian Sea and the tropical Indian Ocean: 2. Ångström parameters and anthropogenic influence. J. Geophys. Res. (D Atmos.), 109(D19), D19208. http:// dx.doi.org/10.1029/2003JD004483
Remer, L.A., Kaufman, Y.J., Tanré, D., Mattoo, S., Chu, D.A., Martins, J.V., Li, R.R., Ichoku, C., Levy, R.C., Kleidman, R.G.,