저작자표시-비영리-변경금지 2.0 대한민국 이용자는 아래의 조건을 따르는 경우에 한하여 자유롭게 l 이 저작물을 복제, 배포, 전송, 전시, 공연 및 방송할 수 있습니다. 다음과 같은 조건을 따라야 합니다: l 귀하는, 이 저작물의 재이용이나 배포의 경우, 이 저작물에 적용된 이용허락조건 을 명확하게 나타내어야 합니다. l 저작권자로부터 별도의 허가를 받으면 이러한 조건들은 적용되지 않습니다. 저작권법에 따른 이용자의 권리는 위의 내용에 의하여 영향을 받지 않습니다. 이것은 이용허락규약(Legal Code)을 이해하기 쉽게 요약한 것입니다. Disclaimer 저작자표시. 귀하는 원저작자를 표시하여야 합니다. 비영리. 귀하는 이 저작물을 영리 목적으로 이용할 수 없습니다. 변경금지. 귀하는 이 저작물을 개작, 변형 또는 가공할 수 없습니다.
Sleep prediction algorithm
based on deep learning technology
Kyung Mee Park
Department of Medicine
The Graduate School, Yonsei University
[UCI]I804:11046-000000520459
[UCI]I804:11046-000000520459
Sleep prediction algorithm
based on deep learning technology
Kyung Mee Park
Department of Medicine
Sleep prediction algorithm
based on deep learning technology
Directed by Professor Eun Lee
The Doctoral Dissertation
submitted to the Department of Medicine
the Graduate School of Yonsei University
in partial fulfillment of the requirements for the degree
of Doctor of Philosophy
Kyung Mee Park
This certifies that the
Doctoral Dissertation of
Kyung Mee Park is approved.
---
Thesis Supervisor: Eun Lee
---
Thesis Committee Member #1: Jin Young Park
---
Thesis Committee Member #2: Sang Eun Lee
---
Thesis Committee Member #3: Min Kyung Chu
---
Thesis Committee Member #4: Sang Joon Son
The Graduate School
Yonsei University
ACKNOWLEDGEMENTS
First of all, I would like to express my profound gratitude for my
thesis advisor, Professor Eun Lee. Without her advice and guidance,
this research could not have been completed. She always has been
an amazing mentor for me. Thank you for everything, Professor Lee.
I would also like to thank my committee members, Prof. Jin Young
Park, Professor Sang Eun Lee, Professor Min Kyung Chu, and
Professor Sang Joon Song for serving as my committee members
even at hardship. Thank you for brilliant comments and suggestions
which helped me tremendously.
I also want to show my gratitude to professors in department of
psychiatry, Yonsei medical school for teaching and giving me many
opportunities. Also, thanks for the colleagues including fellow
doctors, nurses, and researchers who helped me a lot for completing
this thesis.
Lastly, I wish to express my special thanks to my family and
friends for their consistent love and support. And bless all the
caffeine I consumed.
<TABLE OF CONTENTS>
ABSTRACT ··· 1
I. INTRODUCTION ··· 3
II. MATERIALS AND METHODS ··· 11
1. Study population ··· 11
2. Data collection ··· 12
3. Data processing ··· 14
4. Statistical analysis ··· 17
III. RESULTS ··· 23
1. Baseline characteristics of study participants ··· 23
2. Performance evaluation of sleep prediction models ··· 26
3. Sleep-related factors affecting sleep efficiency ··· 27
IV. DISCUSSION ··· 33
V. CONCLUSION ··· 43
REFERENCES ··· 44
LIST OF FIGURES
Figure 1. Structure of multi-input one-dimensional convolutional
neural network (1D-CNN) model ··· 20
Figure 2. Study process of data selection ··· 25
Figure 3. Mean decrease in impurity (MDI) of random forest
without sleep diary ··· 31
Figure 3. Mean decrease in impurity (MDI) of random forest
with sleep diary ··· 32
LIST OF TABLES
Table 1. Demographic and characteristics of finally analyzed
participants ··· 24
Table 2. Performance of three prediction models without sleep
diary ··· 26
Table 3. Performance of three prediction models with sleep diary
··· 27
Table 4. Factors associated with sleep efficiency from logistic
ABSTRACT
Sleep prediction algorithm based on deep learning technology
Kyung Mee Park
Department of Medicine
The Graduate School, Yonsei University
(Directed by Professor Eun Lee)
Background: Evaluation and adjusting maladaptive behavioral sleep-related
factors such as light exposure and activity during daytime is important to treatment of insomnia. One of the possible ways to gather information about sleep-related factors is actigraphy. However, until now, it is not known how sleep-related factors are related to the sleep of the night. Development of sleep prediction algorithm that integrates sleep-related information with actigraphy can be beneficial for adjusting maladaptive behavioral sleep-related factors of insomnia. This study aimed to develop sleep prediction model using deep learning technology as well as traditional analysis model with information about daytime sleep-related factors.
Methods: Eighty-three healthy participants who does not having sleep
disturbances subjectively were enrolled to this study and were asked to use actigraphy and heart rate sensor (ActiGraph GT3X® and Polar H7® ) for two weeks. From actigraphy, information of physical activity, light exposures were gathered. Heart rate variability (HRV) was measured by heart rate sensor. Other
sleep-related factors including sex, age, body mass index (BMI), daily consumption of caffeine or alcohol, and recuperation were assessed by interview and sleep diary. I used three models for sleep prediction: multi-input one-dimensional convolutional neural network (1D-CNN) model as deep learning model, logistic regression (LR) model, and random forest (RF). I used a dependent variable of the study as sleep efficiency (good sleep for sleep efficiency ≥ 90% and bad sleep for sleep efficiency < 90%).
Results: 1D-CNN model showed the greatest accuracy among three models in
both without sleep diary (87.2%) and with sleep diary (87.2%). Without sleep diary, accuracy of LR model was 78.7% and accuracy of RF model was 74.2%. With sleep diary, accuracy of LR model was 79.4% and accuracy of RF model was 77.4%. Sex, BMI, light exposure during evening, and outdoor light exposure during evening were significantly correlated with sleep efficiency from LR model. From RF model, vigorous physical activity in the morning, moderate physical activity during evening, total light exposure in the afternoon and evening, HRV were found to have more impact than other variables with sleep efficiency.
Conclusions: I found that sleep-related factors during daytime were related to
good sleep at the night. Sleep prediction model with deep learning technology has superior accuracy to the LR model and RF model. Sleep prediction algorithm found in this study can be used for treating maladaptive behavioral sleep-related factors in insomnia.
________________________________________________________
Key words: sleep prediction, insomnia, sleep efficiency, deep learning, actigraphy
Sleep prediction algorithm based on deep learning technology
Kyung Mee Park
Department of Medicine
The Graduate School, Yonsei University
(Directed by Professor Eun Lee)
I. INTRODUCTION
Insomnia is defined as dissatisfaction with sleep quantity or quality accompanied by difficulty in initiating sleep, difficulty in maintaining sleep, or early-morning awakening with an inability to return to sleep despite adequate opportunity for sleep, accompanied with clinically significant distress in important areas of functioning more than three nights per week for at least 3 months. The annual prevalence of insomnia symptom is 35% to 50%, and insomnia disorder is diagnosed with 8–17% of the general population in the United States1,2. This high prevalence of insomnia is also found in Asia. In
Korea, 22.8% of the adult population have symptoms of insomnia through telephone survey 3.
Insomnia is an important health problem that needs to be focused, not only because it is common, but also because it has numerous impacts on mental and physical conditions. Insomnia causes adverse effect on the activity of daily
living, the quality of life, and cognitive function4,5. It is also known that
insomnia interferes with the treatment of coexisted medical and psychiatric conditions6,7. In addition, insomnia can aggravate psychiatric or medical health
problem, which can led to increased mortality. Many studies have already shown that insomnia is a risk factor for depression8 and increases the mortality
rate of congestive heart failure, coronary diseases, and metabolic diseases9,10.
Annualized individual-level association of insomnia is about 11.3 days of lost work performance11. Insomnia is also related to healthcare cost. Mean
healthcare costs were 75% larger in the moderate and severe insomnia group than no insomnia group12. Effective treatment of insomnia can be lead to reduce
social and financial burden of health care.
The most proven effective treatment of insomnia is cognitive behavioral therapy for insomnia (CBT-i). Usually, individuals with insomnia have maladaptive behavioral patterns which are related to insomnia symptoms. For example, excessive time spent in bed, non-sleep related behaviors in bed, and taking naps maintain insomnia symptoms and cause chronic insomnia13-15.
The relationship between modifying daytime behaviors and improvement of insomnia is proven by CBT-i studies16-21. Clinicians believe that less time spent
in bed, not taking daytime nap, routine exercise, fixed sleep schedule are beneficial to insomnia treatment22-24. However, there are paucity of studies
about specific relationship between behavioral sleep-related factors and good sleep. Although there is a study of that reduced physical activity during daytime
worse insomnia 25, research on relationship between sleep-related behavioral
factors during daytime and the following sleep at night is still lacking. Light exposures are also one of the factors that are related to sleep. Bright light exposure is necessary for circadian entrainment in humans26. Lack of light
exposure during daytime causes insomnia. On the other hand, light exposure during late-hour can alter circadian physiology, especially short wavelength light from electronic devices in the evening can delay sleep induction, cause poor sleep quality27. Bright light therapy is one of the treatments for the
insomnia. Clinicians advice their insomnia patients to light as much as possible during daytime28.
Psychological distress is another factor that is associated with sleep, yet there are enough fields left to be studies on insomnia. In CBT-i, dealing with psychological distress that can affect to poor sleep is very important such as excessive worries about sleep and a variety of life-related concerns. Stressful life events and perceived lack of control over stress are related to pre-sleep arousal, which can cause difficulties in sleep initiation or sleep maintenance problem29. Researchers tried to find correlation between psychological distress
and insomnia in objective measurements. Skin conductance response, inflammatory markers such as C-reactive protein, or stress-related hormone such as cortisol also have proven their relationships with insomnia30-33. Heart
rate variability (HRV) is physiological phenomenon of changes in heart rate over time, which reflects the effects on sino-artrial node by sympathetic and
parasympathetic nervous systems34. It is measured with intervals in
milliseconds between heart beats on the electrocardiogram, thus it can be assessed with non-invasive methods. It can be a good stress-related index for insomnia evaluation. An accurate assessment of insomnia is essential to effective treatment, which can reduce the burden of health care. From this aspect, insomnia evaluation tool which can assess both of maladaptive behavioral pattern and stress-related index is needed.
For the treatment and relapse prevention of insomnia, assessment of maladaptive sleep-related behavioral factors during daytime and prediction of their sleep with those factors are essential. With the sleep assessment and prediction tool, clinicians can feedback to their insomnia patients with specific behavioral modification advices. With the sleep assessment and prediction tool, insomnia patients can be provided personalized feedback while using them to know exact factors which needs to be modified. Knowing relationship between sleep-related factors during daytime and the following sleep at night would make it possible to predict the following sleep with the daytime information related to sleep. Some researchers tried for predicting sleep with daytime behavior. Bai et al. evaluated sleep quality prediction using mobile data including physical activity, surroundings, and social activities, which showed 78.26% of accuracy35. Another study tried to predict sleep quality with
actigraphy data using deep learning technology, which showed better performance than traditional logistic regression36. However, the number of the
studies is still lacking to use it in clinical practice. For the abovementioned reasons, it is necessary to develop a tool which can evaluate sleep-related behavioral factors and predict good sleep. It would be consisted of integrated information of multiple sleep-related factors including time spent in bed, daytime physical activity, light exposures during daytime, and stress-related index.
Most of the existing assessment tools for insomnia are targeted at sleep itself, not at sleep-related factors during daytime. Assessment tools for insomnia include polysomnography, sleep diary, and actigraphy. Polysomnography is a gold standard for measuring sleep itself. However, it can only measure sleep outcome, cannot assess daytime activity or other factors related to sleep such as alcohol or caffeine use, taking naps, excessive time spent in bed. Sleep diary can measure some of sleep-related factors including nap time, alcohol or caffeine history, and subjective sleep quality. However, it is lacking in objectivity because it solely relies on subjective report of patients. The downside of sleep diary is that possible lack of accuracy while being used by patients who have difficulties in reporting their states due to various reasons including old age, intellectual disability, or inability to recognize their misplaced behavioral patterns. Moreover, sleep diary cannot gather information about exact amount of daytime activity, or light exposure. Among existing tools for assessing insomnia, actigraphy has the largest potential. When it comes to measuring sleep itself, it has comparable sensitivity to polysomnography37,38. It
can assess continuous daytime sleep-related behaviors. Limitation of actigraphy is that there is no known algorithm to reveal relationships between sleep-related factors and good sleep. The clinicians can only guess the relevance of good or poor sleep to sleep-related factors by looking at information obtained through actigraphy. A more automated and large-scale analysis method is needed to correlate huge sleep-related data, such as daytime light exposure, activity, nap, and stress index, to sleep and develop prediction models there from.
Machine learning and deep learning technology is one of the solutions. Machine learning technology enables building a computational model from a relationship between input data and output result by processing available data (“training”). The trained model can be used to automatically make predictions using developed mechanism of it. The techniques in machine learning technology can be broadly classified into two main categories: unsupervised and supervised learning techniques. Unsupervised learning technique requires only the input data and algorithm itself discovers hidden structure and result based on them. Supervised learning technique requires the value of output variable for each training sample, and by training model can develop and predict the outcome by given input data. By using the machine learning technology, sleep prediction can be done with minimized possible errors that can be occurred due to large amounts of information gathered with actigraphy39.
learning technology. It is the representation-learning method with multiple levels of representation, obtained by composing simple but non-linear modules that each transforms the representation at one level into a representation at a higher, slightly more abstract level. The limitation of machine learning technology lies in difficulties of analyzing data with the raw form. To achieve results through machine learning, researcher should trim up the data in advance. Usage of deep learning technology can compensate this limitation. Without the need of processing data manually, more clinically accessible sleep prediction tool can be made40. An algorithm that can automatically predict sleep status of
following day with the information of one’s daytime sleep-related factors can be developed by adapting deep learning technology into analyzing of actigraphy data.
While deep learning algorithm generally has greater performance than traditional methods, it has its shortcoming. Deep learning algorithm is within category of black-box models, which only can be verified externally without possible interpretation. On the other hand, white-box models, including traditional analysis and machine learning technology, generally show worse performance than black-box models, however it allows interpretation of model parameters41. With sole usage of deep learning algorithm, it is not possible to
find about which factors affecting sleep. In order to using sleep prediction model in clinical setting, it would be more helpful for knowing the information of significant factors. For compensating these shortcomings, it is decided to
develop prediction model which can show its decision process. This can be performed as two good ways in this study. First, as mentioned above, is that we can find important variables that can affect sleep. Second is that accuracy each model can be compared and verified whether the performance of deep learning model is superior to others or not.
The primary aim of this study is to develop sleep prediction model with deep learning technology with the data gathered from portable devices. Thus, I chose the accuracy of prediction model for good sleep as primary outcome of this study. Target variable of sleep outcome in my study was sleep efficiency. Sleep efficiency is the proportion of total sleep time compared to the total amount of time spent in bed. It is crucial and validated parameter of insomnia and its treatment. Poor sleep efficiency, which is related to excessive time in bed, is a key component toward chronic insomnia and target of the behavioral therapy of insomnia42. It is also known that poor sleep efficiency is
associated with poor daytime function, including both physical activity and cognitive function43,44. Binary outcome of sleep efficiency as good or bad sleep
was used to maximize model accuracy. Good sleep was defined as ≥90% of sleep efficiency, otherwise it was considered as bad sleep. Sleep efficiency is defined as the percentage of total sleep time during the bedtime, but also as a limited percentage of actual sleep time during the bedtime while tried to sleep.45.
In this study, I used latter term as sleep efficiency. The secondary aim of this study is to confirm the factors that are known to affect sleep by using
white-box models. Researchers believe that daytime activity, light exposure, stress-related index are stress-related to sleep. However, there is paucity of evidences about exact influences of each factor. From this study, I wanted to confirm their influences to sleep with objective measurement. Logistic regression and random forest models can both find the correlations of each factor to target variable.
II. MATERIALS AND METHODS
1. Study population
Healthy participants reporting no sleep disturbances were enrolled to this study. Exclusion criteria were having a history of major psychiatric disorder (schizophrenia and other related psychotic disorder, bipolar disorder, major depressive disorder, anxiety disorder, obsessive compulsive disorder, or any substance-related disorder), having uncontrolled medical illness, and having regular medication for sleep (> 3 times a week). Recruitment for study participants was made through advertisements posted at college of medicine, Yonsei university and at Severance hospital, Yonsei university health system. Participants who agreed to enroll the study with written consent were interviewed with the researcher for eligibility. Through interview, baseline characteristics including sex, age, height, weight, educational level, social economic status, smoking, alcohol, and caffeine use history were collected.
Initial information about sleep of participants was gathered by Pittsburgh sleep quality index (PSQI) and insomnia severity index (ISI) 46-48. The PSQI is a
24-item scale that measures sleep disturbances along 7 dimensions: subjective sleep quality, sleep latency, sleep duration, habitual sleep efficiency, sleep disturbances, use of sleep medication, and daytime dysfunction. Scores from these seven areas are added together into a global score. Responses are based on the majority of days (and nights) of the previous month. A global PSQI score of 5 or greater is indicative of poor sleep quality among younger adults, though others suggest a cut-off of 846. ISI is a brief self-report measurement about
patient’s perception of their insomnia symptom, a validated tool for quantify perceived insomnia severity, and for screening. Characteristics of ISI is that it targets subjective symptoms and consequences of insomnia as well as the degree of concerns or distress caused by insomnia symptom. From ISI, assessing to information including sleep-onset and maintenance difficulties, satisfaction with current sleep pattern, daily functioning impairment due to sleep disturbance, and distress or concern with sleep problem can be done. Higher score indicates more severe insomnia47. This study was approved by the
institutional review board of Severance hospital (4-2017-0384).
2. Data collection
After screening interview, participants were asked to use two wearable monitoring devices (ActiGraph GT3X+® and polar H7® heart rate sensor
(HRS)). ActiGraph GT3X+® was asked to put on their non-dominant wrist, while polar H7® HRS was asked to attach around their chest. Study participants were instructed to continue to wear the devices, except when it was washed and when there was a possibility of damage to the appliance by violent movement.
ActiGraph GT3X+® has triaxial-accelometer and light sensor, thus it can assess to daytime activity, sleep time (ST), wake time (WT), and light exposure. Physical activity is measured by movement detected with triaxial-accelometer. Obtained raw data was consisted of 3-dimensional input data, as acceleration of x-, y-, z-axis movement. We used metabolic equivalent of tasks (METs) as unit of physical activity. METs are objective measures of the physical activities, which is the rate at which a person spends energy to their mass. Vector magnitudes were calculated by gathered data of each axis movement, and then they are converted into METs. For ST and WT, Cole Kripke algorithm was used, which is well-known algorithm to identification of sleep/wake status from actigraphy data49. Light sensor of ActiGraph GT3X+®
can detect the intensity of light of surrounding. It was measured as lux, the unit of illuminance, which is luminous flux per unit area. Light exposure was also measured by every 10 seconds.
Polar H7® HRS is a wireless heart rate monitoring device with elastic electrode belt for detecting R-R interval with a resolution of 1 millisecond. It is originally developed as a self-monitoring device for exercise. However, some previous studies validate that its function to measure heart rate monitoring is as
good as electrocardiography when being used in the field50,51 It can detect R-R
interval per every second with the detection of heartbeat.
All data were collected in real time, then restored into actigraphy. Polar H7® HRS communicated with ActiGraph GT3X+® via Bluetooth function which is wireless transmission method. Therefore, all the heart rate data were sent and stored on the ActiGraph GT3X+® during the period of study participation. I used ActiLife® software (version 6.13.3, ActiGraph) for data extraction and analysis.
Participants were asked to log sleep diary while they are using portable devices. Sleep diary is a one of the self-report measures for sleep, in which an individual completes a series of questions each morning pertaining to the previous night of sleep52. The sleep diary I used in this study is based on
consensus sleep diary53. From sleep diary, assessing the information of daily
consumption of caffeine, daily consumption of alcohol, or other sleep-related index including time to bed, sleep latency, wake time after sleep onset, nap time, and subjective sleep quality was possible. The time when the participants did not wear devices was also recorded in the sleep diary.
3. Data processing
I calculated physical activity using the following formula, which was a validated equation converting vector magnitudes from triaxial accelerometer to METs54.
METs = 1.439008 + (0.000795 * (axis x + axis y + axis z))
All of the physical activity data except sleep time were used for analysis. Physical activity data for periods of time not wearing the device with reference to the sleep diary were excluded from the analysis. In addition, if there were no physical activity data for more than 30 minutes in a row and this absence of data occupies more than 20% of the data in the morning, afternoon, or evening.
Light exposure data was collected every 10 seconds. However, I found there was no continuity of collected light exposure data due to multiple reasons. Sometimes it was assumed that the participants covered the device with sleeves and at another time there was a mechanical error in data collection. Therefore, two imputation methods were used to correct these errors. First, if there are valid value of data before 10 seconds and after 10 seconds and only one data value is missing, the missed value was replaced by the average of the back and forth values. Second, for the longer missing values, I assumed that the behavior or postures of the participants were maintained in the same way for a certain period of time. Therefore, it was assumed that the light sensor was covered by clothing and was not collected properly. In this case, the missing values were replaced by the maximum value of the three minutes of the periods.
HRV was measured in the form of R-R intervals gathered from HRS, then was converted into three units: average heart rate (avgHR), RMSSD (square root of the mean squared differences of successive NN intervals), and
pNN50 (proportion derived by dividing NN50 by the total number of NN intervals). Traditional way of measuring HRV is time-domain measures including avgHR, RMSSD, pNN50, and SDNN (standard deviation of NN intervals for period of interest). Average heart rate (avgHR) is the simplest way to assess HRV. It allows researchers to find basic information of HRV of participants. SDNN reflects total HRV because it requires data of all NN intervals, while RMSSD and pNN50 are more focused on reflecting vagal activity affecting normal sinus rhythm34. Most global HRV measure is SDNN.
However, if one has normal sinus rhythm, RMSSD or pNN50 can be useful for assessing vagal activity of them, which can reflect stress level of individuals. Higher stress can cause vagal suppression, thus lower RMSSD or pNN50 can be related to high-level of stress55. Continuous measurement of HRV data were
done throughout study periods, however, I found lack of continuity from collected data due to technical and mechanical errors. For compensation, 5-minutes of HRV data during awake status was used for predicting sleep34.
Imputation method was performed for correct errors of HRV data, either. First, outstandingly exceeding measures which can be interpreted as an error (e.g. R-R interval that exceeded the value between 0 and 3) was excluded. Second, the data of nearest time within 4 hours before and after ST are used for the calibration with the lack of proper data.
Data were subdivided by time for the analysis with white-box models to confirm which factors affect the sleep efficiency. All of the acquired data
were divided into three part based on time: wake-up to noon (period 1, morning), noon to 18:00 (period 2, afternoon), 18:00 to the time before trying to sleep (period 3, evening). In this way, it was able to determine which particular factors at the specific time of the day are affecting sleep heavily. Another sub-categorization for the physical activity and light exposure was done in the same manner. For the physical activity, beside of total activity (total amount of METs) below sub-categorization was done: vigorous physical activity (number of assessed METs ≥6), moderate physical activity (3 ≤ number of assessed METs < 6), and light activity (number of assessed METs < 3). Light exposure was subdivided into two variables: outdoor light exposure (≥ 1,000 lux), indoor light exposure (< 1,000 lux)56. In analysis, indoor light exposure was
considered as sub-variable with total light exposure.
4. Statistical analysis
Three sleep prediction models were developed using deep learning technology, traditional logistic regression analysis, and machine learning technology. First, for deep learning model, I used convolutional neural network (CNN) technology. CNN is one of the artificial neural networks, a type of deep learning technology. One of the main features of CNN is convolution, which is done with repetitive filters or kernels applied to local time slots. From this process, CNN can compose high level of abstract feature. After convolution, most significant abstract features are selected by a process called pooling36.
This process is done with multiple layers of CNN. Every layer of CNN transforms the input data to an output result of neuron activation, eventually leading to the final fully connected layers showing synthesized results57.
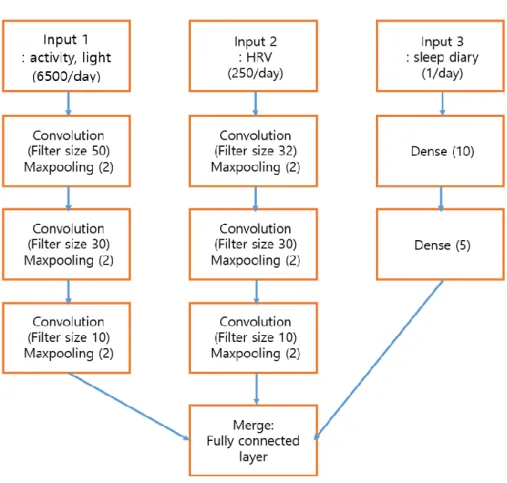
Usually, CNN model is used for analyzing 2-dimensional or 3-dimensional data such as visual images, but out data is 1 dimensional (1D) data, so I made 1D-CNN model for analysis. With sufficient data for training, 1D-1D-CNN model will be developed and be able to distinguish and predict target variable58.
In this study, 1D-CNN model consisted of 3 input, 4 layers, filter size of 50, pooling size of 2. Data was randomly into two set for learning: training set (80%) and test set (20%). Because of the number of data differences from each variable, multi-input 1D-CNN model was used and supervised learning were performed. Total three parallel data input processes were done; physical activity and light exposure at the first, HRV at the second, sleep diary information at the third one (Figure 1). For each feature, convolution and pooling process was repeated four times. After that, all of the process data was merged into one layer, and analyzed in fully connected area. One of the possible problems in CNN model is overfitting. It means that the production of analysis corresponds too closely to a particular set of data, and fail to fit another dataset other than original dataset59. To avoid over-fitting, I subdivided it into two sub-
datasets: training dataset for developing model, and testing dataset for validating model. In addition, batch normalization layer and dropout layer were added. Batch normalization is used to normalize data distribution for reducing
internal covariate shift and accelerate deep network training60. Dropout is the
technique that randomly removes units from the network. This process can minimize the differences between training and test dataset which can lead to avoid overfitting61. 1D-CNN model of this study was programmed to predict
good sleep with binary classification, I used binary cross-entropy cost function with Adam optimizer62,63.
Figure 1. Structure of multi-input one-dimensional convolutional neural
network (1D-CNN) model
Second, for the traditional analysis, logistic regression model was used. It was used for two purposes; the first one was to compare with the accuracy of prediction model using deep learning technology. And the other purpose was to find correlations between sleep-related factors and good sleep. For the latter
purpose, regression coefficient was calculated from the logistic regression model. This logistic regression analysis could reveal which factors are associated significantly with good sleep efficiency. Because it does not require as much data as deep learning model to be developed, 70% of total data was used for developing logistic regression model, and 30% of data was used to test validity of model.
Lastly, for the machine learning technology, random forest model was developed. Random forest is a nonparametric machine learning technology, an ensemble of decision tree classifiers which shows numerous factors affecting decision making 39. Each tree makes predictions of itself and majority vote is
made among the ensembles to make final decision of forest. Every branch of decision trees is formed by random process, thus possible correlations between the tress can be reduced and most importance correlation can be found64.
Random forest model is one of the white-box models, which means it is able to assess to which factor affected final decision more. One of the most common ways to interpret the process of RF is calculating mean decrease in impurity (MDI). MDI is the terms using in machine learning technology area, which means overall improvement in node impurity for a tree have also been proposed calculates the increase in the prediction by randomly noising up variables, thus it can help to select most predictive variables in the process65. With using MDI,
I can assess to relative importance of the factors used in analysis to the target variable. Same proportion of divided data for training (70%) and testing (30%)
with logistic regression model was applied to random forest model.
Two ways of analysis were performed for the all models to check the possibility of fully-automatized sleep prediction only with objective sleep-related factors; without and with sleep diary information. Without sleep diary information, the features we used in this study were categorized into three: physical activity, light exposure, and HRV. For sleep diary information, I used below factors: amount of alcohol consumption within 6 hours before bedtime, amount of caffeine consumption within 6 hours before bedtime, subjective sleep quality (recuperation), and self-reported nap time. Demographic information including sex and body mass index (BMI) was also added to analysis with sleep diary information.
Performance of each model was evaluated with accuracy, sensitivity, specificity, positive predictive value (PPV), negative predictive value (NPV), and area under the ROC curve (AUC). Accuracy is the proportion of all correct predictions (both true positive and true negative) of the total number of predictions. In this study, I considered that accuracy was most important because the study aimed to develop prediction model with fair prediction rate both on positive and negative outcome. Sensitivity is the fraction of true positive predictions to the actual positive values, and specificity is the fraction of true negative predictions to the actual negative values. PPV is the proportion of true positive predictions of all positive predictions made by each model, and NPV is the opposite of PPV, which is the proportion of true negative predictions
of all negative predictions. PPV and sensitivity are model’s ability to distinguish positive predictions from others, which are good sleep efficiency in this study. NPV and specificity, on the contrary, are targeted to distinguish negative prediction, bad sleep, to others. AUC is used to show total combined predictability and validity of each model. All statistical analyses were performed using R-Studio version 1.1463 (RStudio, Inc) and Python 3.6.4 (Python software foundation).
III. RESULTS
1. Baseline characteristic of study participants
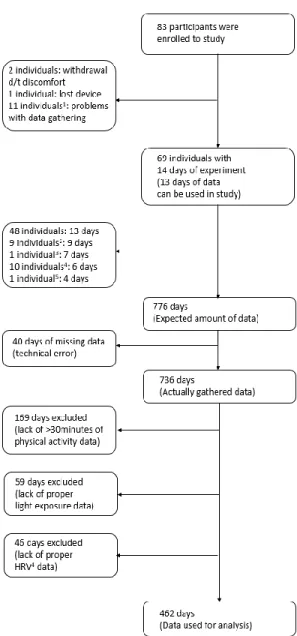
Eighty-three participants who did not report any sleep disturbance were enrolled to the study. Among them, two individuals were resigned from study due to discomfort, one individual lost their device. And the data of eleven individuals could not be used for analysis due to problems caused by mechanical errors. In total, dataset from 69 participants (age 21-61, mean age 30.8) were used for the analysis. Demographic and clinical characteristics of participants are shown in Table 1.
All possible participants were asked to wear devices for two weeks. Available data were 13 days and nights from each participant with two weeks of experiment, Among 69 participants, a total of 21 individuals had less than two weeks of experiments. 9 individuals were due to mechanical errors of devices (5 days (n=1), 7 days (n=6), 8 days (n=1), 10 days (n=1)), and 12
individuals were due to personal schedule (7 days (n=4), 10 days (n=8)). In addition, 40 days of data were sporadically missed due to mechanical errors including battery depletion. Thus, 736 days of raw data were gathered. Among 736 days of gathered data, 169 days of data were excluded if there is continuous lack of physical activity data more than 30 minutes, and more than 20% of portion of any of each period. 59 days of data were excluded for the lack of properly recorded light exposure data after calibration, and 46 days of data were excluded due to lack of HRV data even with calibration. In total, 462 days of data were used to develop and to validate prediction models (Figure 2).
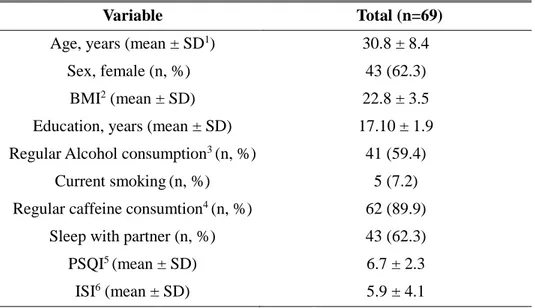
Table 1. Demographic and characteristics of finally analyzed participants
1SD: Standard deviation. 2BMI: Body mass index. 3Alcohol consumption more than 300cc/week, mean 800cc with beer/1.84 times per week. 4Caffein consumption more than 1 cup/day. 5Pittsburgh Sleep Questionnaire Index. 6Insomnia severity index.
Variable Total (n=69)
Age, years (mean ± SD1) 30.8 ± 8.4
Sex, female (n, %) 43 (62.3)
BMI2 (mean ± SD) 22.8 ± 3.5
Education, years (mean ± SD) 17.10 ± 1.9
Regular Alcohol consumption3 (n, %) 41 (59.4)
Current smoking(n, %) 5 (7.2)
Regular caffeine consumtion4 (n, %) 62 (89.9)
Sleep with partner (n, %) 43 (62.3)
PSQI5 (mean ± SD) 6.7 ± 2.3
Figure 2. Study process of data selection
1Eight individuals due to study schedule, one individual due to technical error. 2Due to technical error. 3Four individuals due to study schedule, six individuals due to technical error. 4due to technical error. 5HRV: Heart rate variability.
2. Performance evaluation of sleep prediction models
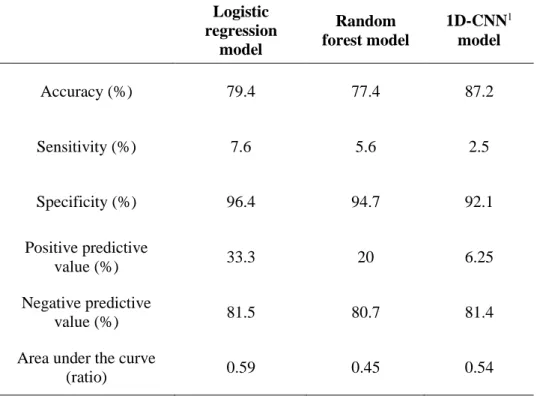
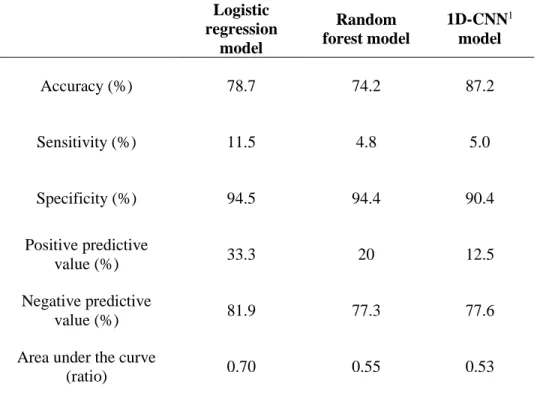
Performance evaluations of three models without sleep diary information were presented in Table 2. 1D-CNN model showed the greatest accuracy among three models. All of the models also showed good specificity and negative predictive value, but relatively lower sensitivity and positive predictive value. These results remained unchanged with sleep diary information (Table 3).
Table 2. Performance of three prediction models without sleep diary
Logistic regression model Random forest model 1D-CNN1 model Accuracy (%) 79.4 77.4 87.2 Sensitivity (%) 7.6 5.6 2.5 Specificity (%) 96.4 94.7 92.1 Positive predictive value (%) 33.3 20 6.25 Negative predictive value (%) 81.5 80.7 81.4
Area under the curve
(ratio) 0.59 0.45 0.54
Table 3. Performance of three prediction models with sleep diary Logistic regression model Random forest model 1D-CNN1 model Accuracy (%) 78.7 74.2 87.2 Sensitivity (%) 11.5 4.8 5.0 Specificity (%) 94.5 94.4 90.4 Positive predictive value (%) 33.3 20 12.5 Negative predictive value (%) 81.9 77.3 77.6
Area under the curve
(ratio) 0.70 0.55 0.53
11D-CNN: 1-dimensional convolutional neural network
3. Sleep-related factors affecting sleep efficiency
From logistic regression analysis without sleep diary information, outdoor light exposure during period 3 (18:00 to bedtime) showed positive correlation to sleep efficiency (p = 0.004), and total light exposure during period 3 showed negative correlation with sleep efficiency (p = 0.044, Table 4). With adding sleep diary information to logistic regression, sex (p = 0.007) and BMI (p = 0.002) showed significant correlation to sleep efficiency. Positive correlation of outdoor light exposure (p = 0.012) and negative correlation of
total light exposure (p = 0.036) remained significantly. Light physical activity during period 1 (wake up to noon) showed a tendency to have a good sleep efficiency without sleep diary information in logistic regression (p = 0.085). Vigorous physical activity during period 1 (p = 0.051) also showed a relationship with good sleep efficiency at trend level. With sleep diary information, daytime nap (p = 0.099) and pNN50 (p = 0.053) showed trend level correlation with to sleep efficiency.
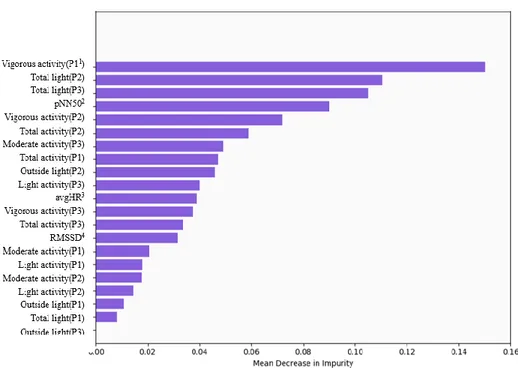
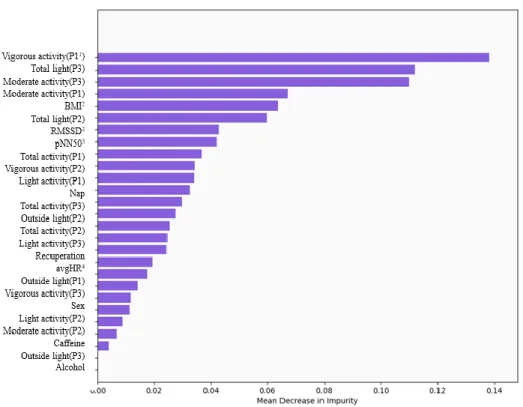
In random forest model, vigorous physical activity during period 1 (MDI = 0.150), total light exposure during period 2 (MDI = 0.110), total light exposure during period 3 (MDI = 0.105) showed relatively more influences than other factors without sleep diary (Figure 3). When sleep diary information added, vigorous physical activity during period 1 (MDI = 0.138), total light exposure during period 3 (MDI = 0.112), moderate physical activity during period 3 (MDI = 0.110) showed greater impact to the sleep efficiency than other variables in random forest model (Figure 4).
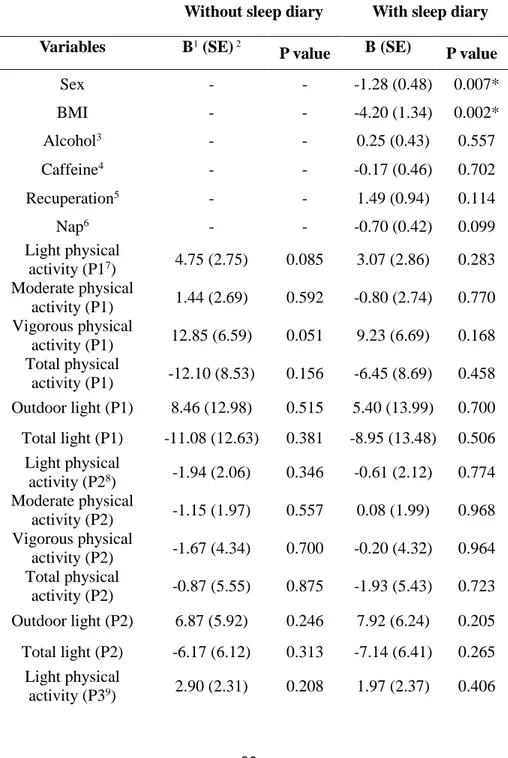
Table 4. Factors associated with sleep efficiency from logistic regression
Without sleep diary With sleep diary
Variables B1 (SE) 2
P value B (SE) P value
Sex - - -1.28 (0.48) 0.007* BMI - - -4.20 (1.34) 0.002* Alcohol3 - - 0.25 (0.43) 0.557 Caffeine4 - - -0.17 (0.46) 0.702 Recuperation5 - - 1.49 (0.94) 0.114 Nap6 - - -0.70 (0.42) 0.099 Light physical activity (P17) 4.75 (2.75) 0.085 3.07 (2.86) 0.283 Moderate physical activity (P1) 1.44 (2.69) 0.592 -0.80 (2.74) 0.770 Vigorous physical activity (P1) 12.85 (6.59) 0.051 9.23 (6.69) 0.168 Total physical activity (P1) -12.10 (8.53) 0.156 -6.45 (8.69) 0.458 Outdoor light (P1) 8.46 (12.98) 0.515 5.40 (13.99) 0.700 Total light (P1) -11.08 (12.63) 0.381 -8.95 (13.48) 0.506 Light physical activity (P28) -1.94 (2.06) 0.346 -0.61 (2.12) 0.774 Moderate physical activity (P2) -1.15 (1.97) 0.557 0.08 (1.99) 0.968 Vigorous physical activity (P2) -1.67 (4.34) 0.700 -0.20 (4.32) 0.964 Total physical activity (P2) -0.87 (5.55) 0.875 -1.93 (5.43) 0.723 Outdoor light (P2) 6.87 (5.92) 0.246 7.92 (6.24) 0.205 Total light (P2) -6.17 (6.12) 0.313 -7.14 (6.41) 0.265 Light physical activity (P39) 2.90 (2.31) 0.208 1.97 (2.37) 0.406
Moderate physical activity (P3) -1.60 (2.00) 0.423 -2.64 (2.21) 0.232 Vigorous physical activity (P3) 5.80 (4.73) 0.220 4.21 (4.85) 0.385 Total physical activity (P3) -4.37 (5.21) 0.102 -3.16 (5.40) 0.558 Outdoor light (P3) 6.20 (2.15) 0.004* 6.20 (2.48) 0.012* Total light (P3) -4.52 (2.24) 0.044* -4.93 (2.35) 0.036* avgHR10 -0.67 (1.59) 0.672 -0.36 (1.63) 0.826 RMSSD11 -1.07 (1.44) 0.454 -1.89 (1.58) 0.231 pNN5012 1.06 (0.87) 0.221 1.90 (0.98) 0.053
1B: regression coefficient. 2Standards error. 3amount of alcohol consumption within 6 hours before bedtime. 4amount of caffeine consumption within 6 hours before bedtime. 5subjective recuperation after sleep. 6amount of nap in the daytime. 7P1: wake-up to noon. 8P2: noon to 18:00. 9P3: 18:00 to the time before trying to sleep. 10avgHR: average heart rate. 11RMSSD: root mean square successive difference of RR interval. 12pNN50: percentage of successive normal sinus intervals of heart (NN intervals) > 50ms. *Statistically significant (p<0.05)
Figure 3. Mean decrease in impurity (MDI) of random forest model without sleep diary
1P1: wake-up to noon. P2: noon to 18:00. P3: 18:00 to the time before trying to sleep. 2pNN50: percentage of successive normal sinus intervals of heart (NN intervals) > 50ms. 3avgHR: average heart rate. 4RMSSD: root mean square successive difference of RR interval.
Figure 4. Mean decrease in impurity (MDI) of random forest model with sleep diary
1P1: wake-up to noon. P2: noon to 18:00. P3: 18:00 to the time before trying to sleep. 2RMSSD: root mean square successive difference of RR interval. 3pNN50: percentage of successive normal sinus intervals of heart (NN intervals) > 50ms. 4avgHR: average heart rate.
IV. DISCUSSION
The primary aim for this study was to develop sleep prediction model. Three kinds of sleep prediction models including deep learning model were developed and were validated their performance. The accuracy of 1D-CNN sleep prediction model was 87.2%, which was same for both including and excluding sleep diary information. For logistic regression model, accuracy was 79.4% without sleep diary, and 78.7% of accuracy with sleep diary. Random forest model predicted good sleep efficiency with 77.4% of accuracy without sleep diary, and 74.2% of accuracy with sleep diary.
The secondary aim for this study was to confirm the relationship between sleep-related factors and good sleep. Logistic regression models and random forest model have found various factors that affect good sleep. In logistic regression model without sleep diary, total light exposure during period 3 (18:00 to the time before trying to sleep, evening) and outdoor light exposure during period 3 was significantly related to good sleep efficiency. Significant relevance of sex and BMI to good sleep are also found in logistic regression model with sleep diary information. In random forest model without sleep diary information, vigorous physical activity during period 1 (wake-up to noon, morning), total light exposure during period 2 (noon to 18:00, afternoon) and period 3 had greater MDI than the other factors. Random forest model with sleep diary information showed that total light exposures during period 3, vigorous physical activity during period 1, moderate physical activity during
period 3 were considered to have more influences than the others.
Sleep prediction model with deep learning technology showed the greatest accuracy among the three prediction models. I assume that the highest performance of 1D-CNN model is due to characteristics of deep learning technology. Because raw data were used for deep learning technology model, it makes the deep learning model having the better performance than the others. Deep learning model can use the whole data and many variables to interact freely with hidden variables. The result of this study is in agreement with the previous meta-analysis study comparing the discriminatory power of artificial neural networks and logistic regression models. In the study, 51% of papers shows better performance of artificial neural networks models than logistic regression models while the opposite result were only 7%41. This would be
beneficial point when it used in clinical field, because 1D-CNN model has both strong points in good performance and accessibility by using raw data. Using raw data for analysis can reduce the burden of researchers, and minimize potential errors that can occur during data process. In the aspect of that the primary goal of this study was that develop automatized algorithm to predict sleep, the result is favorable for using unprocessed behavioral data from patients.
It is also notable that all the three models have comparable accuracy without sleep diary information to those with sleep diary information. Especially with 1D-CNN model, good sleep efficiency can be predicted with
the accuracy of 87.2% without or with sleep diary related variables. It means that good sleep efficiency can be predicted solely based on actigraphy and HRS information. If we use this model in sleep clinic, insomnia patients will no longer have to fill out sleep diaries to show their doctors. The results suggest that using the actigraphy and HRS information alone can provide therapeutic feedback to insomnia patients in the clinic. It would be especially useful for the older adults with cognitive impairment who cannot provide reliable sleep related information on their own. This automated prediction model can be used not only for the assessment of insomnia symptoms, but also for measurement of the effect of insomnia treatment.
As a result of the performance test, sensitivity, positive predictive value, and area under the curve were relatively unsatisfactory compared to the good enough specificity and negative predictive value which were founded in all three models. Although the study target was healthy adults who does not report any sleep disturbance, about 80% of collected data identified as “bad sleep” with cut-off point of sleep efficiency≥90%. This might be associated with characteristics of the participants. First, most of the participants were young (mean age 30.2 years). The participants are likely to do other activity than sleep in bed including checking smartphone. A previous study suggested that about 75% of the young adults use electronic devices in bed before going to sleep at least one evening per week66. It is possible that sleep efficiency of
time for the participants was 365 minutes. It is 72.7% of OECD average sleep time 502 minutes67. Many of the participants were medical school students, or
researchers or office workers. The recruitment of this study was made through the posting or the posters on hospital and medical school boards. It may have led to the participants in this study were likely to have little sleep. Considering that average sleep time for Koreans (469 minutes) is lowest among 18 countries, the result may reflect the situation of South Korea68. Third, the issue of
differences between subjective and objective indicators in clinical research on sleep is an issue that is continuously raised69. In this study, I enrolled
participants who did not report any sleep disturbance. However, good or bad discrimination by actigraphy indicates that they do not sleep well through study period. It is assumed that this imbalance might have affected the performance of the prediction model. For the future study, additional data from people of the more diverse age, and who objectively does not having sleep disturbance are needed.
From the traditional regression analysis, I could assess to which factor were found to be associated more with sleep efficiency with white-box model. First, light exposure during period 3 (18:00 to bedtime, evening) was significantly negatively correlated with good sleep efficiency in logistic regression models both with and without sleep diary information. This implicates that higher exposure to light in total during evening lead to poor sleep efficiency. It is known that light exposure in late evening can alter
circadian cycle, resulting circadian-related sleep Short-wavelength enriched light emitted from electronic devices is known to have negative influences to sleep. There are previous studies about evening exposure of blue-enriched polychromatic light alters the sleep of the same day27,70. In this study, the impact
of artificial light exposure might have caused negative influence of total light exposure71.
On the contrary, outdoor light exposure during period 3 was found to be related with good sleep efficiency in this study. One of the possible reasons of this is that outdoor light exposure variable does not include indoor light exposure including light from electronic devices. Outdoor light exposures during evening period are likely to have taken place in the early evening before sunset, not in the late evening when it close to bedtime. In addition, the finding is in accordance with previous finding about evening light exposure can act positively to sleep quality to the office workers72. Late afternoon-evening
outdoor light might positively act to sleep to individuals without of morning and daytime light exposure.
Female sex, higher BMI were found to correlate with poor sleep efficiency in logistic regression model with sleep diary information. There are some evidences that female sex is one of the factors that can negatively affect sleep latency and sleep quality in normal population73. Higher BMI is also
known to be associated with poor sleep. Even without reported sleep disorder, overweight and obese population tends to have poorer sleep than normal body
weighted population.
In the logistic regression model, of light and vigorous physical activity during period 1 (wake-up to noon, morning) showed a tendency to have positive impact to good sleep efficiency without sleep diary information. There are studies that prove morning physical activity can improve sleep quality74,75.
There is also a study which shows correlation between physical activity and sleep efficiency with usage of actigraphy76. Physical activity is one of the
well-known contributing factors for sleep. Several studies found that exercise increases slow-wave sleep, total sleep time, and decreases sleep latency77.
There are several hypotheses about this mechanism. Some researchers claim that physical activity makes one spend energy, which led to sleep for energy conservation and body restoration, while others claim it is due to raising body temperature by physical activity78. Thus, there certainly is a possibility that
physical activity has more potent influences to sleep efficiency than the findings of this study. The reason that this study did not show statistically significant correlations between physical activity and sleep might be due to similar physical patterns including low activity level of participants. In this study, I used METs for physical activity unit. Many of the studies about physical activity and sleep used total time of the categorized physical activity, activity count during day, or subjective questionnaire about activity so it was hard to compare the result of this study with previous studies. However, most of the participants were office worker who does not have lots of physical activity,
which can be led to the result of this study about physical activity. It is clear that physical activity has a positive effect on sleep, given the tendency of the results.
With sleep diary information, influences of daytime nap and pNN50 also showed a tendency to have positive impact to good sleep efficiency in logistic regression model. It is also remarkable pNN50 have a tendency to have an impact to sleep efficiency. The possibility that association between HRV during daytime and sleep was one of the recent interest in sleep medicine34.
There are previous studies that claim HRV during wake time correlate with sleep79,80. Statistically significant correlation between HRV and good sleep
efficiency was not found in this study. This might due to unexpected lack of continuity of collected HRV data caused by mechanical errors of HRV devices in this study. Because of this, I used 5 minutes of HRV data of the day. With compensation of this problem and enabling continuous gathering of HRV data might led to more distinct finding of correlation between HRV and sleep in future study.
In MDI analysis in random forest model, some results were different from logistic regression model. Random forest model is one of the machine learning technique based models, which has different decision-making process than logistic regression. MDI is also different concept than regression coefficient, which is the how each variable can reduce the impurity of the classification of models. It should be interpreted as relative importance during
process of decision tree ensemble, not an absolute value to be considered. Without sleep diary information, the importance with vigorous physical activity during period 1 was found higher than other factors. Total light exposure during period 2 and period 3 was followed by that. With sleep diary information, greater importance of vigorous activity during period 1, total light exposure during period 3, and moderate physical activity during period 3 than other factors was found in random forest model. Overall great impact with late afternoon and evening light exposure was remained similar; however, there are also some different points such as higher importance of activity, relatively low importance of sleep diary information including sex, BMI, and outdoor light exposure during period 3. From this aspect, it is important that focusing on the common factors that found to be have higher impact than other factors in both models, which is total light exposure in period 3.
This study has some limitations. First, there was excessive lack of data with HRV. More than 70% of the participants showed lack of continuity from 24 hours continuously detected HRV data. In this study, both ActiGraph GT3X+® and polar H7 HRS® were used simultaneously. From this process, unexpected errors were occurred including data submission failure, and too much consumption of battery which results in battery depletion. This problem ends up with scarce data of HRV. For compensating this problem, I decided to use only 5 minute of HRV data around bedtime. This made only 9.2% of data loss in the analysis after compensation (46/508 days, Figure 2). However, it is
possible that the scarcity of data can lead to inaccuracy of analysis. In this study, HRV did not showed statistically significant influences to sleep, only a tendency to correlate with sleep in logistic regression model. This technical problem around HRV should be considered for the future study.
Another limitation is homogenous characteristics of study participants. As mentioned above, most of the study population was young-adults, highly educated office workers. This might have caused similar behavioral patterns among participants including less intense physical activity, less exposure to light, shorter total sleep time than general population. Because of the similar behavioral patterns of participants, it might have been difficult sleep prediction models to be developed. From this reason, some predictive values including sensitivity, PPV, and AUC showed relatively unsatisfactory result compared to other successive values. This may be improved with enrollment of participants with more diverse characteristics including age, education, and job. Data of participants having more various behavioral patterns including physical activity and light exposure levels can contribute to refine prediction models and to make more accurate prediction. Participants also have high mean PSQI score, 6.7 ± 2.3 (mean ± SD). I assume that it is also due to occupational characteristics of participants. Among PSQI subcomponent, score for sleep duration and daytime dysfunction were higher than other scores, higher than general population. I performed additional performance test for sub-group which divided by PSQI score (cut off point <5)46. Only white-box model were able to be developed due
to small amount of data. Overall performance was better in group with lower PSQI score (PSQI<5), however, it was not statistically significant. This might be due to small number of data used for model develop in the group with lower PSQI score, which were 98 days (21. 2% of total data). Even so, this result might indicate that sleep prediction model performs better in participants who have lower PSQI score. For further study, it might be helpful to develop a separate model for subgroup divided by PSQI score.
From my knowledge, 1D-CNN model in this study is the first deep-learning based sleep prediction algorithm using multiple variables with temporal continuity as using data including daytime activity, light exposure, and HRV. There is one study about sleep prediction model using actigraphy information with deep learning technology36. The previous study only focused
on daytime activity data gathered by actigraphy, without using light exposure or HRV data. Predicting sleep with various factors can be more appropriately used in clinical practice. Also, this is one of the few study focusing on sleep prediction based on personalized monitoring with wearable devices. There are growing need of personalized monitoring and modification of sleep combined with mobile technology81,82. From this aspect, prediction and forecasting sleep
based on one’s daytime behavior can provide personalized feedback to modify one’s sleep. Given the fact that researches in the field of sleep prediction is scarce, this study could serve as a baseline for future researches that can be used with personalized medicine.
V. CONCLUSION
From this study, I found that sleep prediction model with deep learning technology has superior accuracy to the logistic regression and random forest model. I also found sleep-related factors during daytime were related to good sleep at the night. Male sex, lower BMI, vigorous physical activity during morning, moderate physical activity during evening, total light exposure in the afternoon and evening, and outdoor light exposure during evening can significantly affect the good sleep efficiency. This result suggests sleep prediction by automation of integration and interpretation of the data can be a basis for the future clinical use of wearable devices to treat maladaptive behavioral sleep-related factors in insomnia. It is necessary to develop a time-series model with several days’ sleep-related information that predicts sleep at the following night.
REFERENCES
1. Roth T, Coulouvrat C, Hajak G, Lakoma MD, Sampson NA, Shahly V, et al. Prevalence and perceived health associated with insomnia based on DSM-IV-TR; International Statistical Classification of Diseases and Related Health Problems, Tenth Revision; and Research Diagnostic Criteria/International Classification of Sleep Disorders, Second Edition criteria: results from the America Insomnia Survey. Biol Psychiatry 2011;69:592-600.
2. Walsh JK, Coulouvrat C, Hajak G, Lakoma MD, Petukhova M, Roth T, et al. Nighttime insomnia symptoms and perceived health in the America Insomnia Survey (AIS). Sleep 2011;34:997-1011. 3. Cho YW, Shin WC, Yun CH, Hong SB, Kim J, Earley CJ.
Epidemiology of insomnia in Korean adults: prevalence and associated factors. Journal of clinical neurology 2009;5:20-23.
4. Lee E CH, Olmstead R, Levin MJ, Oxman MN, Irwin MR. Persistent Sleep Disturbance: A Risk Factor for Recurrent Depression in Community-Dwelling Older Adults. Sleep. 2013;36:1685-1691. 5. Williamson AM, Feyer A-M. Moderate sleep deprivation produces
impairments in cognitive and motor performance equivalent to legally prescribed levels of alcohol intoxication. Occupational and
environmental medicine 2000;57:649-655.
6. Simeit R, Deck R, Conta-Marx B. Sleep management training for cancer patients with insomnia. Support Care Cancer 2004;12:176-183. 7. Kallestad H, Hansen B, Langsrud K, Ruud T, Morken G, Stiles TC, et
al. Impact of sleep disturbance on patients in treatment for mental disorders. BMC Psychiatry 2012;12:179.
8. Taylor DJ, Lichstein KL, Weinstock J, Sanford S, Temple JR. A pilot study of cognitive-behavioral therapy of insomnia in people with mild depression. Behav Ther 2007;38:49-57.
9. Tobaldini E, Costantino G, Solbiati M, Cogliati C, Kara T, Nobili L, et al. Sleep, sleep deprivation, autonomic nervous system and
cardiovascular diseases. Neurosci Biobehav Rev 2017;74:321-329. 10. Laugsand LE, Strand LB, Platou C, Vatten LJ, Janszky I. Insomnia and
the risk of incident heart failure: a population study. Eur Heart J 2014;35:1382-1393.
11. Kessler RC, Berglund PA, Coulouvrat C, Hajak G, Roth T, Shahly V, et al. Insomnia and the performance of US workers: results from the America insomnia survey. Sleep 2011;34:1161-1171.
12. Sarsour K, Kalsekar A, Swindle R, Foley K, Walsh JK. The association between insomnia severity and healthcare and productivity costs in a health plan sample. Sleep 2011;34:443-450.
13. Spielman AJ SP, Thorpy MJ. Treatment of chronic insomnia by restriction of time in bed. Sleep 1987;10:45-56.
14. Edinger JE CC. Overcoming Insomnia: A Cognitive-Behavioral Therapy Approach: Oxford University Press; 2008.
15. Baillargeon L, Demers M, Ladouceur R. Stimulus-control: nonpharmacologic treatment for insomnia. Can Fam Physician 1998;44:73-79.
16. Edinger JD, Wohlgemuth WK, Radtke RA, Marsh GR, Quillian RE. Cognitive behavioral therapy for treatment of chronic primary insomnia: a randomized controlled trial. JAMA 2001;285:1856-1864. 17. Espie CA, Inglis SJ, Tessier S, Harvey L. The clinical effectiveness of