Sensory and Motor Systems
Heartbeat Induces a Cortical Theta-Synchronized
Network in the Resting State
Jaejoong Kim,1 and Bumseok Jeong1,2
https://doi.org/10.1523/ENEURO.0200-19.2019
1Graduate School of Medical Science and Engineering, Korea Advanced Institute for Science and Technology (KAIST), Daejeon 34141, Republic of Korea, and2KI for Health Science and Technology, KAIST Institute, KAIST, Daejeon 34141, Republic of Korea
Abstract
In the resting state, heartbeats evoke cortical responses called heartbeat-evoked responses (HERs), which reflect cortical cardiac interoceptive processing. While previous studies have reported that the heartbeat evokes cortical responses at a regional level, whether the heartbeat induces synchronization between regions to form a network structure remains unknown. Using resting-state MEG data from 85 human subjects of both genders, we first showed that heartbeat increases the phase synchronization between cortical regions in the theta frequency but not in other frequency bands. This increase in synchronization between cortical regions formed a network structure called the heartbeat-induced network (HIN), which did not reflect artificial phase synchronization. In the HIN, the left inferior temporal gyrus and parahippocampal gyrus played a central role as hubs. Furthermore, the HIN was modularized, containing five subnetworks called modules. In particular, module 1 played a central role in between-module interactions in the HIN. Furthermore, synchronization within module 1 had a positive association with the mood of an individual. In this study, we show the existence of the HIN and its network properties, advancing the current understanding of cortical heartbeat processing and its relationship with mood, which was previously confined to region level.
Key words: emotion; heartbeat-induced network; interoception; MEG; resting state network
Introduction
One of the important purposes of the brain is to main-tain homeostasis by continuously sensing the
homeo-static state (for example, visceral sensations and immunologic signals), which is termed interoception, and the brain regulates the bodily condition using this
homeo-Received May 29, 2019; accepted July 16, 2019; First published July 30, 2019. The authors declare no competing financial interests.
Author contributions: J.K. and B.J. designed research; J.K. and B.J. per-formed research; J.K. analyzed data; J.K. and B.J. wrote the paper.
This work was supported by the Brain Research Program through the National Research Foundation of Korea (NRF) funded by the Ministry of Science and ICT Grants NRF-2016M3C7A1914448 and NRF-2017M3C7A1031331 (to B.J.).
Significance Statement
Complex brain processing usually occurs at a network level, which requires an interaction between brain regions. However, despite its importance in homeostasis and affective processing, a network level pro-cessing of cardiac interoception has not been investigated. Here, we first provided an evidence that the heartbeat induces phase synchronizations between cortical regions those comprise a heartbeat-induced network (HIN) with control analyses excluding the possibility of an artificial synchronization. Furthermore, by applying graph-theoretical analysis, we find hubs of the HIN and found out that it is a modularized network with five modules. Finally, we also showed the relationship between the participants’ mood and the HIN. These results provide the first evidence of network-level heartbeat processing and its relevance with emotion.
static information even in the resting state (Craig, 2009). Recently, interoceptive processing, especially at the cor-tical level, has been proposed to play various roles not only in reflective homeostatic regulation but also in psy-chological processes, including affective and cognitive processing (Tsakiris and De Preester, 2018). Therefore, understanding the precise mechanism of cortical intero-ceptive processing is important for understanding “em-bodied” emotion and cognition.
Because the brain processes interoceptive information, there exist brain responses related to visceral signal pro-cessing. For example, the heartbeat signal evokes cortical activity defined as heartbeat-evoked responses (HERs;
Pollatos and Schandry, 2004). HERs are associated with many psychological processes, including heartbeat awareness (Pollatos and Schandry, 2004), emotion pro-cessing (Couto et al., 2015;Maister et al., 2017;Kim et al., 2019), visual awareness (Park et al., 2014), bodily self-consciousness (Park et al., 2016), and autobiographical self-related processing (Babo-Rebelo et al., 2016a,b). Furthermore, disruption of resting-state HERs is known to be related to emotion-related psychiatric diseases/disor-ders, such as depression and borderline personality dis-order (Terhaar et al., 2012;Müller et al., 2015).
While previous studies have shown that the heartbeat evokes region-level or sensor-level cortical responses and is related to a variety of psychological states and functions, whether the heartbeat also induces interactions between cortical regions remains unknown. However, previous fMRI studies have shown that network-level fluc-tuations vary with visceral signal-related measures such as heart rate variability (HRV;Chang et al., 2013;Rebollo et al., 2018), indicating that heartbeat-related interactions may occur between cortical regions. Therefore, we hy-pothesized that the heartbeat induces functional coupling between cortical regions involved in heartbeat processing and forms a network structure in the resting state. In this study, using a resting-state MEG dataset, we investigated the heartbeat-induced network (HIN), which was defined as a network composed of significantly increased phase synchronization between regions compared with baseline values. We first showed the existence of the HIN and that it does not reflect artificial synchronization between cor-tical regions. Then, we investigated the properties of the HIN using graph-theoretical measures. In particular, we first investigated the hubs of the HIN, which play a central role in the HIN. Next, we investigated the modularized
property of the HIN to determine whether the HIN is one homogeneous network or can be segregated into several subnetworks. Finally, cardiac interoceptive processing has been suggested to be closely related to an affective state of an individual (Terhaar et al., 2012;Müller et al., 2015). Therefore, we hypothesized that synchronization within the HIN, reflecting network-level cardiac interocep-tive processing, is related to an affecinterocep-tive state of an individual. We tested this hypothesis by investigating the relationship between synchronization within the HIN and affective state scores of study participants.
Materials and Methods
Dataset descriptionResting-state MEG data from 89 subjects collected from the Human Connectome Project (HCP) S1200 data release were used in this study (Larson-Prior et al., 2013;
Van Essen et al., 2013, RRID:SCR_008749). All subjects were young (22–35 years of age) and healthy. MEG re-cordings were collected on a whole-head Magnes 3600 scanner (4D Neuroimaging) with 248 magnetometer chan-nels at a sampling rate of 2034.51 Hz. Recordings were performed in three sessions, and each session lasted 6 min. HERs were extracted from the preprocessed version of the MEG dataset, which is publicly available at Con-nectome DB (Hodge et al., 2016). The preprocessing pipeline of HCP data included segmentation of the raw data into epochs of 2 s and removal of bad segments and bad channels. Importantly, an independent component analysis (ICA; Hämäläinen et al., 1993) was applied to remove cardiac field artifacts (CFAs) and electrooculog-raphy (EOG)-related artifacts, and the data were finally downsampled to 508.68 Hz. Notably, because these pre-processed data did not include electrocardiogram (ECG) recordings, which are essential for HER extraction, we used an ECG recording included in the raw MEG data. Among 89 subjects, four subjects were excluded (IDs 133019, 140117, 149741, and 17746); we failed to detect the R-peak in the ECG recording of subject 149741, and in subjects 133019, 140117, and 177741, an excessive error occurred when performing Brainnetome atlas-based (Fan et al., 2016) source time course extraction [the time course extraction of ⬎16 cortical regions (among 210 cortical regions) failed in this subject]. Finally, 85 subjects were included in our analysis (47 males and 38 females).
MEG analysis
HER extraction procedure
HER extraction and preprocessing were performed us-ing the FieldTrip toolbox (Oostenveld et al., 2011, RRID:
SCR_004849). First, preprocessed HCP MEG data, which were initially segmented into 2-s epochs, were concate-nated into one continuous time series such that each segment was realigned to its original location in the raw MEG recording (preprocessed data contained information about the locations of each segment in the raw MEG recording). Because bad segments were removed, the concatenated continuous time series data had empty spaces where the bad segments existed. These empty spaces were replaced by NaN. Next, the R-peak was
Acknowledgments: We thank Hyeong-Dong Park for helpful comments and discussions on the manuscript. Data were provided by the Human Connec-tome Project of the WU-Minn Consortium (principal investigators: David Van Essen and Kamil Ugurbil; 1U54MH091657), which was funded by the 16 NIH Institutes and Centers that support the NIH Blueprint for Neuroscience Re-search and the McDonnell Center for Systems Neuroscience at Washington University.
Correspondence should be addressed to Bumseok Jeong at bs.jeong@ kaist.ac.kr.
https://doi.org/10.1523/ENEURO.0200-19.2019
Copyright © 2019 Kim and Jeong
This is an open-access article distributed under the terms of theCreative Commons Attribution 4.0 International license, which permits unrestricted use, distribution and reproduction in any medium provided that the original work is properly attributed.
detected in the ECG recordings using the Pan-Tomkins algorithm (Pan and Tompkins, 1985). Then, epoching of HERs from 900 ms before the R-peak to 1800 ms after the R-peak was performed on the concatenated continuous MEG data. As mentioned above, the concatenated MEG data contained the time window including NaN; thus, the HER epoching procedure resulted in some NaN-containing epochs. These NaN-NaN-containing HER epochs were removed. Finally, the HER extraction procedure re-sulted in 840.8 (⫾138.7) HER epochs on average. The mean interbeat interval (IBI) of every subject was 981.8 ms [⫾151.5, corresponding heart rate: 61.11 beats per min-ute (BPM)], with a range of 675.4 –1374.2 ms (heart rate range: 43.67– 88.84 BPM).
Source reconstruction of HERs
All sensor HER data were source-reconstructed using the linearly constrained minimum variance (LCMV) beam-former methods (Van Veen et al., 1997) provided in the FieldTrip toolbox in a manner similar to that used in a previous study (Heusser et al., 2016). A common spatial filter was estimated for each source point using HER data from all trials, an HCP-provided single-shell volume con-duction head model and an HCP-provided 4-mm grid source model for every subject (Larson-Prior et al., 2013). Then, this common spatial filter was applied to sensor HER data (sensor ⴱ time matrices) to calculate the time courses of each source. Finally, we used Brainnetome atlas-based parcellation (Fan et al., 2016, RRID: SCR_014091) to perform a region of interest (ROI)-based connectivity analy-sis. Among the total of 246 brain regions, because an HER is known to mainly reflect cortical heartbeat processing (Pollatos et al., 2005) and the deep source activity esti-mation including the subcortex and cerebellum in MEG data are less reliable than cortical source estimation (Hämäläinen et al., 1993), we excluded 36 subcortical cerebellar regions. We also excluded 15 cortical regions among the remaining 210 cortical regions because the source reconstruction procedure failed to extract time courses in these regions in at least one subject (indicating that these regions did not contain source vertices in some participants). Therefore, the time courses of vertices within each of the 195 cortical regions (Extended Data
Table 1-1) were averaged. This final step produced the time courses of HERs for all 195 cortical regions, epochs and subjects.
Calculation of the debiased wPLI estimator in the theta frequency range between cortical regions
The debiased estimator for weighted phase lag index (wPLI-D; Vinck et al., 2011) was used as a measure of functional connectivity between cortical regions. The weighted phase lag index (wPLI; Vinck et al., 2011) is a measure of phase coherence and is robust to the spurious connectivity induced by volume conduction, which is re-flected in “zero-phase synchronization” between sources. Furthermore, the wPLI is invariant to linear mixing of two dependent sources (Vinck et al., 2011;Palva et al., 2018), and in the presence of true interactions, this measure is immune to false-positive detection (Palva et al., 2018). Because a direct estimator of the wPLI is biased by
sample size (Vinck et al., 2011), we used the debiased wPLI estimator (wPLI-D;Vinck et al., 2011), which ranges from zero to one (maximum coherence). We hypothesized that synchronization would occur in the theta band (4 –7 Hz), which is the frequency band with the strongest in-crease in phase synchronization within regions according to a previous study (Park et al., 2018). First, complex Morlet wavelet transformation was performed on every trial (which was epoched from –900 to 1800 ms R-peak) with a 20-ms time step starting from –300 to 600 ms R-peak and a frequency ranging from 4 –7 Hz with 1-Hz steps. Four cycles were used in the wavelet transforma-tion procedure. Then, the wPLI-D was calculated for every pair of regions in each time and frequency step. wPLI-Ds from 4 to 7 Hz were averaged to obtain the wPLI-D of the theta frequency range. These procedures resulted in 195 (number of ROIs) by 195 by 31 (time windows from –300 to 600 ms at the R-peak with 20-ms steps) wPLI-D ma-trices for each subject. Additionally, although our fre-quency band of interest was the theta band, which has been shown to be a major frequency band with respect to HERs, we tested whether similar HINs exist in the␣ (8–13 Hz) and (14–29 Hz) bands by using the same pipeline used in the theta band HIN.
Identification of the HIN using network-based statistics (NBSs)
We compared the wPLI-Ds between the baseline pe-riod, which was defined as a time window 300 –100 ms before the R-peak onset, and a time window 200 – 600 ms after the R-peak onset, which is the time window in which the effects of HERs were reported in most previous HER studies (Fukushima et al., 2011;Pollatos and Schandry, 2004), to determine whether the heartbeat induced a network composed of significantly increased phase syn-chronization between regions, and we called this time window the “induced” period. The 200-ms period after the R-peak onset corresponds to the approximate time that the heartbeat signal enters the CNS following carotid baroreceptor stimulation, which is the major input path of the heartbeat to the CNS (Eckberg and Sleight, 1992). However, note that because the heartbeat signal is con-veyed to the CNS via various pathways except this path-way including somatosensory pathpath-way via spinal cord or stimulation of cardiac afferent neuron at heart wall, the timing of this CNS entrance of the heartbeat signal could be varying (Park and Blanke, 2019). The baseline period used in the present study is the same period used in a previous study of HER-induced phase synchronization within regions. This baseline period was postulated to avoid cardiac artifacts around the ECG P-wave (Park et al., 2018).
We then performed a group-level NBS (Zalesky et al., 2010; RRID:SCR_002454) analysis, which is a statistical method that controls multiple comparisons at the network level. This analysis enabled us to identify a network com-posed of significantly increased wPLI-Ds between cortical regions in the induced period compared to the baseline period at the group level. First, baseline and induced wPLI-D matrices were computed by averaging wPLI-Ds from each time window for every subject, which resulted
in one baseline wPLI-D matrix and one induced wPLI-D matrix for each subject. Second, multiple paired t tests comparing wPLI-Ds from the induced period and the baseline wPLI-D were performed for every pair of cortical regions, which resulted in one matrix of t values from these paired t tests. Then, a threshold t value of 2.51 was applied to the matrix of t values, and a t value⬍ 2.51 was therefore set to 0. The network statistic was computed by adding the t values of all the connected components in the thresholded matrix (a connected component refers to any two nodes within a component are connected by a path of edges). Next, a null distribution of the network statistic was created from 5000 permutations by ran-domly permuting an element of the induced wPLI-D ma-trices and the baseline wPLI-D mama-trices within each subject. Finally, network-level familywise-error (FWE)-corrected p values of the network were obtained using the original network statistic and null distribution. Next, we constructed a heartbeat-induced synchronization (HIS) matrix whose elements corresponded to the increase in the wPLI-D in the induced period compared to that in the baseline period, and each element was significant in the NBS results. Therefore, the HIS matrix was composed of elements with significantly increased wPLI-Ds in the group-level NBS analysis and represents the structure of the HIN.
Examination of increased theta phase synchronization between ECG signals and brain regions
We postulated that the HIN that we identified may represent an artificial increase in phase synchronization caused by a CFAs. We expected that if an electromag-netic field induced by cardiac contractile activity directly influenced both regions A and B and this effect artificially increased phase synchronization between these two re-gions, then phase synchronization would increase be-tween regions A and B, and the phase synchronization between the ECG signal and both regions A and B should increase after a heartbeat because the same electromag-netic field induced by cardiac contraction influenced all three signals, including the ECG signal and the signals from regions A and B. We assessed whether theta-phase synchronization between ECG signals and brain regions increased during an induced period (200 – 600 ms after the R-peak) compared to that in the baseline period to test this hypothesis. We calculated the wPLI-Ds between ECG signals and 195 cortical regions in the theta band for every subject, which resulted in two 195 by one vector of ECG-brain region wPLI-Ds from the baseline and induced periods for every subject. Then, we performed 195 group-level paired t tests between the wPLI-Ds from the induced and baseline periods for all 195 cortical regions to deter-mine which wPLI-Ds between each ECG-brain region pair were significantly increased in the induced period com-pared to that at baseline.
The forward and inverse-modeled trial-shuffled surro-gate method for evoked component estimation of the HIN
We next tested whether phase synchronization in the HIN reflected artificial synchronization due to evoked re-sponses within distributed regions, which are
phase-locked to the heartbeat (Hirvonen et al., 2018), using the forward and inverse-modeled trial-shuffled surrogate method, which was used to identify an evoked compo-nent of phase synchronization in a previous study ( Hir-vonen et al., 2018). This method selectively and more effectively identifies true-induced interareal interactions compared to the conventional trial shuffling method (Lachaux et al., 1999). Briefly, using the source-modeled single-trial data, the time course of each source vertex within a particular region was simulated with the region time courses of a random trial (trial shuffle) and using the forward model, sensor-level surrogate data were gener-ated. Finally, the sensor-level surrogate data were source-reconstructed, and the wPLI-Ds between cortical regions were calculated with procedures identical to those used for the real data. As noted in a previous study (Hirvonen et al., 2018), by using this procedure, surrogate data contain both evoked, stimulus-phase-locked components and signal spread caused by MEG data acquisition and inverse modeling, while non-stimulus locked (induced) phase synchronization between regions is eliminated. Therefore, by comparing the HIN of the surrogate data with the HIN of the real data, we can identify whether phase synchronization within the HIN was caused by evoked responses. We established 20 sets of surrogate data and compared phase synchronization within the HIN between the surrogate data and the real data.
Network properties of the HIN
After confirming that the HIN does not reflect artificial synchronization induced by either CFAs or evoked re-sponses, we identified the following characteristics of the HIN. First, we identified the hubs of the HIN, which play an important role in connecting regions within the HIN. Then, we identified whether the HIN is one homogeneous net-work or can be divided into subnetnet-works called modules, indicating that the HIN is modularized. Additionally, we also investigated how synchronization within the HIN changes over time by summing the wPLI-D of every HIN edge at every time point from –300 to 600 ms.
Identification of the hubs of the HIN
One of the important features of a network is the hub of the network, which is defined as a node that plays an important role within a network, such as connecting nodes (Fornito et al., 2016). To identify the hubs of the HIN, we calculated the strength and betweenness cen-trality of each region. The strength of a node is defined as a sum of the weights of all edges connected to that node, and betweenness centrality is defined as the fraction of all the shortest paths in a network that pass through a given node (Brandes, 2001). The graph-theoretical measures used to define hubs were calculated using the functions of the brain connectivity toolbox (BCT;Rubinov and Sporns, 2010; RRID:SCR_004841).
Identification of the modularized structure of the HIN
Because we expected that the HIN would have a mod-ular structure, we applied a community detection algo-rithm to the HIS matrix to determine how the HIN is partitioned into different subnetworks. However, to iden-tify whether the HIN is modularized, one should examine
the extent of modularity compared to random networks. Therefore, we compared the “modularity index” of the HIN with 100 random networks (Bassett et al., 2011). Optimal partitioning of cortical regions was performed using the Louvain greedy algorithm (Blondel et al., 2008) to maxi-mize the modularity index Q formulated using the follow-ing equation:
Q ⫽ 1
2
兺
ij [Aij⫺␥Pij]␦(gi, gj).In this equation, Aijrepresents the strength of the edge
between node i and node j, Pij represents the expected
weight between node i and node j, is the sum of the strengths of all edges in the network, and ␦共gigj兲 is 1 if
node i and j belong to the same community and 0 other-wise (gi is a label of the community to which node i
belongs). The resolution parameter␥ was set to 1, which is a default value. However, because the partition that maximizes Q can vary across each algorithm run, we used the consensus partition method to identify the most rep-resentative partition S (Lancichinetti and Fortunato, 2012) using the functions of the BCT (Rubinov and Sporns, 2010). The consensus partition procedure, which is iden-tical to a previously reported procedure (Fornito et al., 2016), is briefly explained below. First, a community de-tection algorithm (Louvain greedy algorithm) was run 10,000 times to create 10,000 partitions. Second, the agreement matrix D was constructed. Each element of D corresponded to the proportion of the number of times that nodes i and j were in the same module to the number of total iterations. Third, a threshold ⫽ 0.2 was applied to D. The value of was set to ⬍0.4 as recommended in a previous study (Lancichinetti and Fortunato, 2012). Fourth, community detection was performed 10,000 times using D, which created another agreement matrix, D’. Fifth, steps 2 through 4 were repeated until the consensus matrix exhibited a block-diagonal structure in which all edge weights equaled one for node pairs in the same community and zero otherwise. We initially constructed the agreement matrix with 10,000 iterations of the HIS matrix. Then, 10,000 partitions were provided as the func-tional input for steps 2 through 4, and these processes were repeated until convergence was achieved. By this consensus partitioning procedure, we achieve optimal partitioning and obtain the modularity index Q of this optimal partition. To test whether the HIN is modularized, we constructed 100 random networks with preservation of the weight distribution and then applied the same consensus partition procedure on these random net-works. As a result, we obtained 100 Q values of each random network, which constituted a surrogate distribu-tion of the Q. Then, we tested the locadistribu-tion of the Q value of the HIN in this surrogate distribution.
Properties of each module of the HIN
After partitioning the HIN, we identified the properties of each module of the HIN. Specifically, we extracted the time course of within-module synchronization for each module, which was defined as the sum of the edge weights within each module at every time point, and then
determined which node was the “connector hub” of the modules. These connector hubs connect modules and enable effective interactions between modules and are defined by graph-theoretical measurements called the within-module degree z score (Guimera and Amaral, 2005) and the participation coefficient (Guimera and Amaral, 2005). The within-module degree z score quantifies the normalized within-module strength, while the participation coefficient quantifies a node’s participation in each mod-ule. Using within-module degree z scores and participa-tion coefficients, we defined the role of every node according to the z-P classification (Guimera and Amaral, 2005). In particular, the connector hub is a node with many connections within the module to which the node belongs and also forms many connections with nodes of other modules; thus, the connector hub efficiently con-nects nodes within one module to nodes of other modules (Fornito et al., 2016). In our study, the connector hub was defined as a node with a within-module degree z score ⬎2.5 and a participation coefficient (P) ⬎ 0.3 (Guimera and Amaral, 2005;Fornito et al., 2016).
Identification of between-module interactions using graph-theoretical analysis
We next investigated synchronization patterns between modules. Between-module synchronization of5C2pairs of
modules was computed by the sum of the edge weights between each module, which resulted in a 5⫻ 5 between-module synchronization matrix. By applying graph-theo-retical analysis to this between-module synchronization matrix, we identified which module plays a central role within the HIN using module-level nodal strength and betweenness centrality.
The relationship between emotional status and the HIN
To identify relationships between the HIN and partici-pants’ emotional states, we used the emotional statuses included in the HCP data. The HCP data included a measure for six negative emotional affective states, in-cluding anger-affect, anger-hostility, anger-aggression, fear-affect, fear-somatic, and sadness, and positive affect surveys were retrieved from the NIH Toolbox (Gershon et al., 2010). To reduce dimensions, we performed a principal component analysis of seven survey scores and extracted the first principal component (PC) reflecting the moods of the participants. Then, we fit a stepwise linear regression model in which the first PC was a dependent variable to the within-module and between-module syn-chronizations of the five HIN modules.
Results
Theta-phase synchronization between cortical regions increased after the heartbeat, confirming the existence of the HIN
The NBS analysis showed a network displaying a sig-nificant increase in phase synchronization in the induced period compared to that in the baseline period (network-level FWE-corrected p⬍ 0.001), revealing the existence of the HIN. The density of the network was 9.2%, indicat-ing that among the total of195C2pairs of regions, 9.2% of
the region pairs showed significantly increased phase synchronization after the heartbeat. Additionally, no HIN formed in the␣-frequency or -frequency bands.
No significant change in phase synchronization occurred between ECG signals and cortical regions
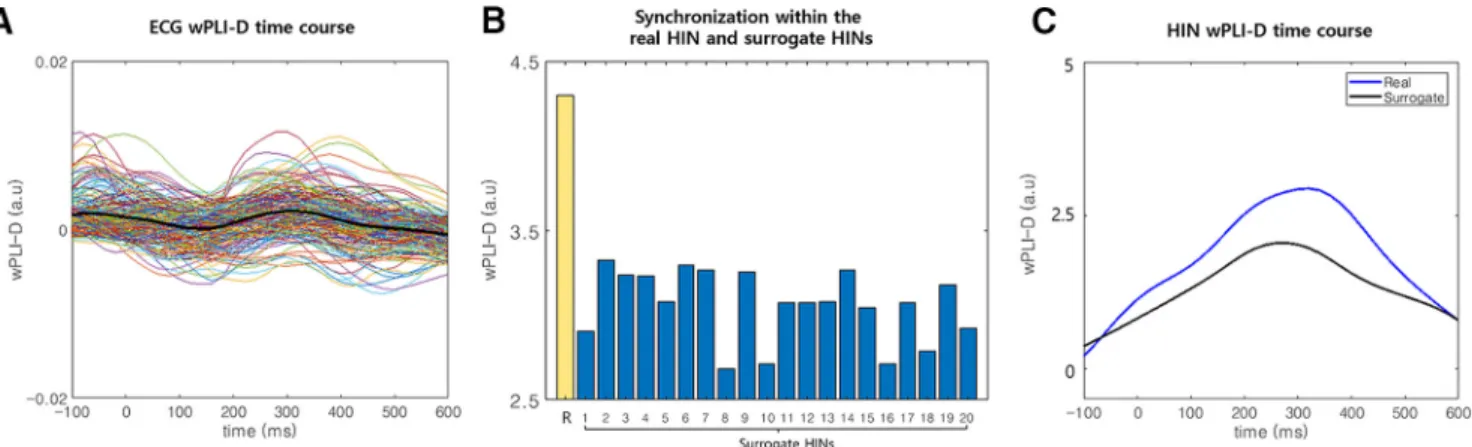
The paired t tests (wPLI-Ds for ECG signals and cortical regions) comparing responses between the induced pe-riod (200 – 600 ms after the R-peak) and the baseline period did not reveal a significant increase or decrease in wPLI-Ds between ECG signals and cortical regions in the theta band (the minimum p value among the 195 cortical regions was p ⫽ 0.104 [false discovery rate (FDR)-corrected] with t(86)⫽ 2.97 in the “right postcentral gyrus
A2”; Fig. 1A). If the electromagnetic field generated by cardiac contractile activity induced artificially increased phase synchronization between regions in the HIN com-pared with the baseline period, then the ECG signal orig-inating from the same electromagnetic field should show increased phase synchronization with cortical regions within the HIN. However, phase synchronization between cortical regions and ECG signals did not change in the induced period compared to baseline, while phase syn-chronization between the regions in the HIN increased in the induced period, indicating that the increased theta-phase synchronization between cortical regions in the HIN was not caused by CFAs (Fig. 1A). Furthermore, the HIN was not likely caused by a pulse artifact (PA), which occurs when sensors are influenced (moved) by vascular pulsation. In our study, we used MEG data, and MEG sensors do not directly contact the subject; thus, a vessel cannot induce pulsatile movement of the sensors to cause a PA. To our knowledge, no previous studies have reported a PA in MEG recordings. Furthermore, according to a previous HER study using electrocorticography
(ECoG; Kern et al., 2013), if PA-induced artificial syn-chrony occurs between ECoG electrodes, then the ECG and ECoG electrodes likely display high phase synchro-nization (Kern et al., 2013), which was not observed in our results. By summarizing these results, the HIN that we identified in the theta frequency band was not caused by an artificial increase in phase synchronization induced by CFAs or a PA. While the theta-phase synchronization between ECG signals and cortical regions was not in-creased compared to baseline, a CFA-induced increase in phase synchronization compared with baseline may exist in lower frequency bands, such as the␦ band (0.5–4 Hz), because cardiac contractile activity typically occurs at a rate of 60 –100 BPM, which corresponds to a frequency of 1–1.67 Hz belonging to the␦ band. Similarly, in our data, the subjects displayed a maximum heart rate of 88.84 BPM (⬃ 1.48 Hz); therefore, the CFAs or PA induced by pulsation may have increased artificial synchronization in the␦ band.
The HIN is not composed of artificially increased synchronization induced by evoked responses
We compared the synchronization within the HIN in 20 surrogate datasets and in the real data. The results showed that the HIS within the HIN in the real data were significantly stronger than that in all 20 surrogate datasets (Monte Carlo p⬍ 0.05;Fig. 1B,C; Extended DataFig. 1-1), indicating that the synchronization within the HIN could not be explained by artificial synchronization caused by evoked responses in distributed regions. Notably, if the HIN is composed of evoked responses in distributed re-gions, the existence of only a small proportion of edges among all possible edges (9.2%) within HIN regions is unlikely.
Figure 1. Results of the control analysis. A, The time course of synchronization between the ECG signal and HIN regions. We plotted
the wPLI-D in the theta band between the ECG signal and HIN regions for all HIN regions (thin colored lines). In addition, the averaged synchronization time course was also plotted (thick black line). These time courses show similar levels of synchronization between the baseline and induced periods. B, Comparison of the synchronization within the HIN between real and surrogate data in the induced period. We generated 20 surrogate datasets without an induced component of synchronization and compared synchroni-zation within the HIN between real (yellow bar with the label R) and surrogate data (blue bar). This figure shows that the synchronization within the real data are stronger than the synchronization in all 20 surrogate datasets in the induced period, indicating that the synchronization within the HIN cannot be explained by artificial synchronization caused by evoked responses (Extended Data Fig. 1-1). C, The time courses of synchronization within the HIN for real and surrogate data. This panel shows that the synchronization within the real data are stronger than the mean synchronization in the surrogate datasets in the induced period (Extended DataFig. 1-1). Note that in A, B, baseline subtraction was performed (–300 to –100 ms at the R-peak).
Network properties of the HIN
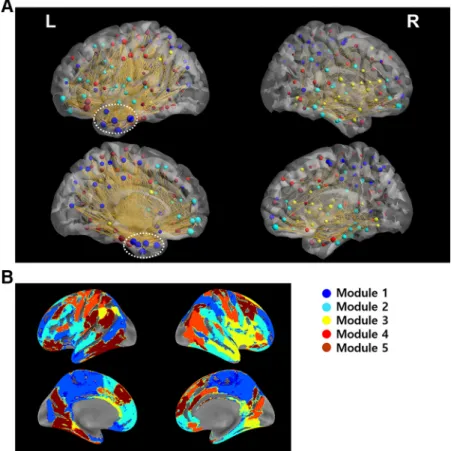
Within the HIN, left inferior temporal regions including the temporal pole and parahippocampal gyrus had high strength and betweenness centrality (Fig. 2A; Table 1).
Figure 2A shows that the connections between HIN re-gions are centered at the polar part of an inferior temporal region including the inferior temporal gyrus and parahip-pocampal gyrus. Specifically, “left inferior temporal gyrus A20il” had the highest betweenness centrality and strength among the regions (Table 1), suggesting its im-portance as a hub of the HIN. In addition to these regions, orbitofrontal regions also had a high degree and between-ness centrality. Notably, the HIN was left-dominant such that the HIS between regions was substantially stronger within left hemispheric regions than that within right
hemi-spheric regions (t(84)⫽ 5.22, p ⬍ 0.001 in a paired t test
comparing induced synchronization between the right and left hemispheres;Fig. 2A). Finally, the time course of the synchronization within the HIN showed that the de-gree of synchronization increases from baseline and was maximal at⬃300 ms after the R-peak (Fig. 1C).
The HIN is a modularized network with five subnetworks, and module 1 plays a central role within the HIN
Based on the consensus partitioning results, the HIN was partitioned into five modules (Fig. 2A,B). Using the consensus partitioning result for the real data and the consensus partitioning of the random network, we tested whether the HIN is modularized. We found that the HIN Figure 2. Structures of the HIN. A, Synchronization patterns within the HIN. The figure shows that the synchronization within the HIN
is concentrated in the left inferior temporal region (white dashed circles), particularly in the polar part and the parahippocampal gyrus, which are hubs of the HIN. Furthermore, these regions were contained in module 1. B, Spatial pattern of each module of the HIN. In this spatial map of each module, module 1 contained most of the polar part of the left inferior temporal regions and the parahippocampal gyrus. The posteromedial part of the bilateral hemispheres was also contained in this module. Module 2 contained the ventromedial and orbitofrontal cortices, which are also hubs of the HIN.
Table 1. High-strength nodes of the HIN
Region name BC Strength Module
Left inferior temporal gyrus A20il, intermediate lateral area 20 8661 30.1 1
Left parahippocampal gyrus A35/36r, rostral area 35/36 4775 25.9 1
Left inferior temporal gyrus A20iv, intermediate ventral area 20 2781 25.4 4
Left inferior temporal gyrus A20r, rostral area 20 4069 24.8 1
Left fusiform gyrus A20rv, rostroventral area 20 1556 24.3 4
Five regions having high strength are reported here with their betweenness centrality and modules they belong to. Full list of regions and their network char-acteristics are provided in the Extended DataTable 1-1. BC, betweenness centrality.
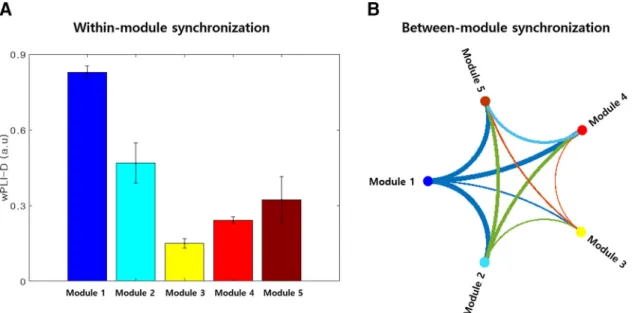
had a significantly greater modularity index than the ran-dom network (Monte Carlo p⬍ 0.01), indicating that the HIN is modularized rather than one homogeneous net-work. Importantly, among the five modules, the synchro-nization within module 1 was the strongest (Figs. 2A,3A). This module contained most of the polar part of the left inferior temporal gyrus and parahippocampal gyrus (Fig. 2B). Specifically, left inferior temporal gyrus A20il, which had the highest betweenness centrality and strength, was also contained in this module. Furthermore, graph-theoretical analysis of the between-module synchroniza-tion matrix showed that module 1 was the center of an interaction between the HIN modules with the highest strength (1.29) and betweenness centrality (2) among the modules (Fig. 3B). The posteromedial regions including the middle cingulate cortex, supplementary motor area, posterior cingulate and precuneal regions were also con-tained in this module (Fig. 2B). Module 2 had the second strongest within-module synchronization and contained the bilateral ventromedial/orbital frontal regions (Figs. 2A,
3A). Finally, seven hubs connected each module, most of which were located in the temporal polar regions and orbitofrontal regions.
The relationship between affective status and synchronization within the HIN
The first PC explained 47% of the variance of the emotion survey data and had positive loading on the positive affect score and negative loading on the other negative affect scores. Therefore, we surmised that this PC reflected the moods of the participants. Stepwise linear regression analysis resulted in a model that only contained the within-module synchronization of module 1 in the HIN, which explains⬃10% of the variance of the mood data (model F(1,83)⫽ 8.95, p ⫽ 0.004, R
2⫽ 0.10,
of the within-module synchronization of module 1⫽ 0.57,
t⫽ 3.00, p ⫽ 0.004;Fig. 4), indicating that an individual with higher synchronization within module 1 has a more positive mood or is less likely to experience a negative mood. Notably, the relationship between these two vari-ables was also significant when we applied a robust regression or non-parametric correlation to reduce the effect of outlier points (all p⬍ 0.05).
Discussion
In the resting state, our brain receives cardiac afferent signals, and previous studies have shown regional mod-ulation of HERs. As shown in the present study, we found that the heartbeat induces theta-phase synchronization of cortical regions, thus generating a network that we called Figure 3. module and between-module synchronization in the HIN. A, module synchronization in the HIN.
Within-module synchronization was strongest in Within-module 1, followed by that in Within-module 2. B, Between-Within-module synchronization pattern of the HIN. The between-module synchronization pattern graph shows that module 1 is the center of interaction between modules such that it has strong connections with other modules, which were quantified by the strength of this node.
Figure 4. The relationship between mood and the within-module
synchronization of module 1. Stepwise linear regression showed that the within-module synchronization of module 1 has a posi-tive association with the moods of the participants.
the HIN, which did not reflect artificially-induced synchro-nization. This HIN was not present within other frequency bands, including ␣ and  bands. The synchronization within the HIN was maximal at⬃300 ms after the R-peak, and the left inferior temporal gyrus and parahippocampal gyrus played a central role as hubs. Furthermore, the HIN was a modularized network with five modules. Module 1 included major hubs of the HIN and played a central role in interactions between modules of the HIN. Finally, we found that the stronger synchronization within module 1 of the HIN explained 10% of the variance in mood and had a positive association with mood.
In this study, we first showed that the heartbeat in-creases “true” induced synchronization between cortical regions by controlling several factors that can cause arti-ficial synchronization. By using the wPLI-D as a synchro-nization metric, we controlled the effect of zero-phase synchronization caused by volume conduction (Cohen, 2014). Furthermore, we controlled for the possibility of artificially increased synchronization induced by CFAs from cardiac contractile activity or a PA by analyzing the increase in ECG-cortical region phase synchronization. However, because an artifact-induced increase in phase synchronization compared with synchronization at base-line may exist in a lower frequency band, such as the␦ band, we suggest that for MEG studies, an investigation of the HIN in the frequency ranges covering the theta and higher frequency bands would be more reliable because these bands are unlikely to be influenced by CFAs or a PA, while an investigation of the HIN in the␦ band and lower frequency bands would be less reliable because artifacts and the HIN would be difficult to discriminate in these frequency bands. Lastly, we controlled for large-scale synchronization within the HIN that may occur artificially due to evoked responses in cortical regions. We com-pared the HIN of real data with that of surrogate data whose non-heartbeat-locked phase relationships were eliminated while evoked components were preserved (Hirvonen et al., 2018) and found that the phase synchro-nization within the HIN could not be explained by artificial synchronization caused by evoked responses. These re-sults from the control analyses consistently suggest the existence of the HIN, which is likely composed of truly increased neural-phase synchronization induced by the heartbeat.
Several studies have investigated brain regions or net-works related to cardiac activity. Chang and colleagues investigated a resting-state brain network that fluctuated with HRV using the dorsal anterior cingulate cortex and amygdala as seed regions (Chang et al., 2013). In the recent reviews ofAzzalini et al. (2019), authors mentioned that because HRV was reported to be largely driven by the brain, the HRV-associated resting-state brain networks are likely to be associated with descending influences from the brain to heart (Azzalini et al., 2019). Another recent fMRI study showed regions associated with a low-frequency peripheral pulse fluctuation called an auto-nomic network (Shokri-Kojori et al., 2018). Based on these studies showing cortical regions or networks related to cardiac activity-related measures, we showed ascending
cardiac afferent signal-induced phase synchronization between cortical regions in this study. Furthermore, we quantified the interaction pattern between these regions in the network using graph-theoretical measures, which have not been investigated in previous studies.
In the analysis of the properties of the HIN, synchroni-zation within the HIN was maximal at⬃300 ms after the R-peak, which is the time after the heartbeat enters the CNS (Eckberg and Sleight, 1992). Most of the hubs of the HIN with high strength and betweenness centrality were concentrated around the left inferior temporal gyrus and the parahippocampal gyrus. In particular, the parahip-pocampal gyrus has been reported to be related to the cardiac cycle duration (Kim et al., 2019) and to be part of an autonomic network (Shokri-Kojori et al., 2018). Addi-tionally, the bilateral orbitofrontal region also had high strength and betweenness centrality, which is a viscero-motor region that sends viscero-motor signals to the viscera (Kleckner et al., 2017). Notably, unlike previous theories emphasizing the role of the insula in processing intero-ceptive signals, in our study, the insula did not serve as a hub (Craig, 2009). However, some recent studies of HERs showed that the insula is not always the most important structure for heartbeat processing, but its importance varies according to the task or situation that one is en-gaged in (Babo-Rebelo et al., 2016a,b; Tsakiris and De Preester, 2018).
Next, we found that the HIN was a modularized network with greater modularity than random networks. The HIN was divided into five modules, and module 1 was the center of interactions between these five modules with high module-level betweenness centrality and strength, indicating that module 1 is responsible for a large portion of the interactions between modules of the HIN. Module 1 contained left inferior temporal regions including the para-hippocampal gyrus and posteromedial regions. Interest-ingly, an autonomic network identified in a previous fMRI study was composed of regions showing stronger inter-actions with low-frequency peripheral pulse amplitude fluctuations (occurring at⬃0.01–0.09 Hz) than with other brain regions (Shokri-Kojori et al., 2018), and the network had some topological overlap with module 1 such that it also contained a large portion of posteromedial regions and the parahippocampal gyrus. Notably, this previous study also used an HCP dataset (fMRI and behavior data, 18 participants in the previous study were also included in our study) as in our study. Furthermore, while module 1 showed a significant relationship with the mood score, the autonomic network also showed a significant relationship with the emotion PC extracted from the HCP behavioral data of emotion (which is slightly different from our study because the authors not only extracted an emotion PC from the score related to mood but also included other measures such as an emotion recognition score; Shokri-Kojori et al., 2018). The topological overlap between mod-ule 1 and the autonomic network, which is also a cardiac activity-related network, and their similar relationships with emotion may suggest that they are the same or a similar kind of network induced by the heartbeat although they were measured by different modalities and methods,
with the autonomic network emphasizing a peripheral pulse-cortical region relationship and module 1 of the HIN focusing on heartbeat-induced interactions between cor-tical regions. However, the regions included in each net-work were not entirely the same; therefore, we cannot determine whether the automatic network and module 1 are the same in this study. However, we can conclude that a strong relationship exists between the regions included in both networks and heartbeat processing and also be-tween heartbeat-related processing within these regions and the emotional state of an individual.
A limitation of our study is that although interoceptive processing typically includes subcortical regions, such as the amygdala (Kleckner et al., 2017), we used only cortical regions to construct the HIN. The HIN including subcor-tical regions may show different properties than those reported in this study. Therefore, future studies on HINs including subcortical regions using deep source imaging MEG techniques are needed.
In conclusion, we first showed the existence of HIN interactions with hubs in inferior temporal regions. The HIN was modularized and contained five modules, with module 1 as the center of module interactions. The syn-chronization within module 1 of the HIN had a positive association with the mood scores of the participants. Considering recent theories on abnormal interoceptive processing in mood disorder patients (Paulus and Stein, 2010), investigating the HIN within such patients may also improve our understanding of the corresponding patho-physiology.
References
Azzalini D, Rebollo I, Tallon-Baudry C (2019) Visceral signals shape brain dynamics and cognition. Trends Cogn Sci 23:488 –509. Babo-Rebelo M, Richter CG, Tallon-Baudry C (2016a) Neural
re-sponses to heartbeats in the default network encode the self in spontaneous thoughts. J Neurosci 36:7829 –7840.
Babo-Rebelo M, Wolpert N, Adam C, Hasboun D, Tallon-Baudry C (2016b) Is the cardiac monitoring function related to the self in both the default network and right anterior insula? Philos Trans R Soc Lond B Biol Sci 371:20160004.
Bassett DS, Wymbs NF, Porter MA, Mucha PJ, Carlson JM, Grafton ST (2011) Dynamic reconfiguration of human brain networks dur-ing learndur-ing. Proc Natl Acad Sci USA 108:7641–7646.
Blondel VD, Guillaume JL, Lambiotte R, Lefebvre E (2008) Fast unfolding of communities in large networks. J Stat Mech 2008: P10008.
Brandes U (2001) A faster algorithm for betweenness centrality. J Math Sociol 25:163–177.
Chang C, Metzger CD, Glover GH, Duyn JH, Heinze H-J, Walter M (2013) Association between heart rate variability and fluctuations in resting-state functional connectivity. Neuroimage 68:93–104. Cohen MX (2014) Analyzing neural time series data: theory and
practice. Cambridge: The MIT Press.
Couto B, Adolfi F, Velasquez M, Mesow M, Feinstein J, Canales-Johnson A, Mikulan E, Martínez-Pernía D, Bekinschtein T, Sigman M, Manes F, Ibanez A (2015) Heart evoked potential triggers brain responses to natural affective scenes: a preliminary study. Auton Neurosci 193:132–137.
Craig AD (2009) How do you feel—now? the anterior insula and human awareness. Nat Rev Neurosci 10:59 –70.
Eckberg DL, Sleight P (1992) Human baroreflexes in health and disease. New York: Oxford University Press.
Fan L, Li H, Zhuo J, Zhang Y, Wang J, Chen L, Yang Z, Chu C, Xie S, Laird AR, Fox PT, Eickhoff SB, Yu C, Jiang T (2016) The human brainnetome atlas: a new brain atlas based on connectional archi-tecture. Cereb Cortex 26:3508 –3526.
Fornito A, Zalesky A, Bullmore E (2016) Fundamentals of brain network analysis. San Diego: Academic Press.
Fukushima H, Terasawa Y, Umeda S (2011) Association between interoception and empathy: evidence from heartbeat-evoked brain potential. Int J Psychophysiol 79:259 –265.
Gershon RC, Cella D, Fox NA, Havlik RJ, Hendrie HC, Wagster MV (2010) Assessment of neurological and behavioural function: the NIH Toolbox. Lancet Neurol 9:138 –139.
Guimera R, Amaral LAN (2005) Functional cartography of complex metabolic networks. Nature 433:895.
Hämäläinen M, Hari R, Ilmoniemi RJ, Knuutila J, Lounasmaa OV (1993) Magnetoencephalography—theory, instrumentation, and applications to noninvasive studies of the working human brain. Rev Mod Phys 65:413.
Heusser AC, Poeppel D, Ezzyat Y, Davachi L (2016) Episodic se-quence memory is supported by a theta– gamma phase code. Nat Neuroscie 19:1374.
Hirvonen J, Monto S, Wang SH, Palva JM, Palva S (2018) Dynamic large-scale network synchronization from perception to action. Netw Neurosci 2:442–463.
Hodge MR, Horton W, Brown T, Herrick R, Olsen T, Hileman ME, . . . Harms MP (2016) ConnectomeDB—sharing human brain connec-tivity data. Neuroimage 124:1102–1107.
Kern M, Aertsen A, Schulze-Bonhage A, Ball T (2013) Heart cycle-related effects on event-cycle-related potentials, spectral power changes, and connectivity patterns in the human ECoG. Neuroim-age 81:178 –190.
Kim K, Ladenbauer J, Babo-Rebelo M, Buot A, Lehongre K, Adam C, Hasboun D, Lambrecq V, Navarro V, Ostojic S, Tallon-Baudry C (2019) Resting-state neural firing rate is linked to cardiac cycle duration in the human cingulate and parahippocampal cortices. J Neurosci 39:3676 –3686.
Kleckner IR, Zhang J, Touroutoglou A, Chanes L, Xia C, Simmons WK, Quigley KS, Dickerson BC, Barrett LF (2017) Evidence for a large-scale brain system supporting allostasis and interoception in humans. Nat Hum Behav 1:0069.
Lachaux JP, Rodriguez E, Martinerie J, Varela FJ (1999) Measuring phase synchrony in brain signals. Hum Brain Mapp 8:194 –208. Lancichinetti A, Fortunato S (2012) Consensus clustering in complex
networks. Sci Rep 2:336.
Larson-Prior LJ, Oostenveld R, Della Penna S, Michalareas G, Prior F, Babajani-Feremi A, Schoffelen JM, Marzetti L, de Pasquale F, Di Pompeo F, Stout J, Woolrich M, Luo Q, Bucholz R, Fries P, Pizzella V, Romani GL, Corbetta M, Snyder AZ; WU-Minn HCP Consortium (2013) Adding dynamics to the human connectome project with MEG. Neuroimage 80:190 –201.
Müller LE, Schulz A, Andermann M, Gäbel A, Gescher DM, Spohn A, Herpertz SC, Bertsch K (2015) Cortical representation of afferent bodily signals in borderline personality disorder: neural correlates and relationship to emotional dysregulation. JAMA Psychiatry 72: 1077–1086.
Maister L, Tang T, Tsakiris M (2017) Neurobehavioral evidence of interoceptive sensitivity in early infancy. Elife 6:e25318.
Oostenveld R, Fries P, Maris E, Schoffelen JM (2011) FieldTrip: open source software for advanced analysis of MEG, EEG, and invasive electrophysiological data. Comput Intell Neurosci 2011:156869. Palva JM, Wang SH, Palva S, Zhigalov A, Monto S, Brookes MJ,
Schoffelen JM, Jerbi K (2018) Ghost interactions in MEG/EEG source space: a note of caution on inter-areal coupling measures. Neuroimage 173:632–643.
Pan J, Tompkins WJ (1985) A real-time QRS detection algorithm. IEEE Trans Biomed Eng 32:230 –236.
Park HD, Blanke O (2019) Heartbeat-evoked cortical responses: underlying mechanisms, functional roles, and methodological con-siderations. Neuroimage 197:502–511
Park HD, Correia S, Ducorps A, Tallon-Baudry C (2014) Spontaneous fluctuations in neural responses to heartbeats predict visual de-tection. Nat Neurosci 17:612–618.
Park HD, Bernasconi F, Bello-Ruiz J, Pfeiffer C, Salomon R, Blanke O (2016) Transient modulations of neural responses to heartbeats covary with bodily self-consciousness. J Neurosci 36:8453–8460. Park HD, Bernasconi F, Salomon R, Tallon-Baudry C, Spinelli L, Seeck M, Schaller K, Blanke O (2018) Neural sources and under-lying mechanisms of neural responses to heartbeats, and their role in bodily self-consciousness: an intracranial EEG study. Cereb Cortex 28:2351–2364.
Paulus MP, Stein MB (2010) Interoception in anxiety and depression. Brain Struct Funct 214:451–463.
Pollatos O, Schandry R (2004) Accuracy of heartbeat perception is reflected in the amplitude of the heartbeat᎑evoked brain potential. Psychophysiology 41:476 –482.
Pollatos O, Kirsch W, Schandry R (2005) Brain structures involved in interoceptive awareness and cardioafferent signal processing: a dipole source localization study. Hum Brain Mapp 26:54 –64. Rebollo I, Devauchelle A-D, Béranger B, Tallon-Baudry C (2018)
Stomach-brain synchrony reveals a novel, delayed-connectivity resting-state network in humans. Elife 7:e33321.
Rubinov M, Sporns O (2010) Complex network measures of brain connec-tivity: uses and interpretations. Neuroimage 52:1059 –1069.
Shokri-Kojori E, Tomasi D, Volkow ND (2018) An autonomic network: synchrony between slow rhythms of pulse and brain resting state is associated with personality and emotions. Cereb Cortex 28: 3356 –3371.
Terhaar J, Viola FC, Bär K-J, Debener S (2012) Heartbeat evoked potentials mirror altered body perception in depressed patients. Clin Neurophysiol 123:1950 –1957.
Tsakiris M, De Preester H (2018) The interoceptive mind: from homeostasis to awareness. New York: Oxford University Press. Van Essen DC, Smith SM, Barch DM, Behrens TE, Yacoub E, Ugurbil K; WU-Minn HCP Consortium (2013) The WU-Minn human con-nectome project: an overview. Neuroimage 80:62–79.
Van Veen BD, Van Drongelen W, Yuchtman M, Suzuki A (1997) Localization of brain electrical activity via linearly constrained min-imum variance spatial filtering. IEEE Trans Biomed Eng 44:867– 880.
Vinck M, Oostenveld R, Van Wingerden M, Battaglia F, Pennartz CM (2011) An improved index of phase-synchronization for electro-physiological data in the presence of volume-conduction, noise and sample-size bias. Neuroimage 55:1548 –1565.
Zalesky A, Fornito A, Bullmore ET (2010) Network-based statistic: identifying differences in brain networks. Neuroimage 53:1197– 1207.